Spending and Activity for Pacific Northwest Salmon Habitat Restoration
B. Van Deynze
March 10, 2020
This document is intended as a primer on the Pacific Northwest Salmonoid Habitat Projects (PNSHP) database, with a focus on the availability of project costs. The primary goal of this report is to evaluate the usefulness of the data for modeling habitat restoration costs. We begin by discussing the extent, structure, and origin of the PNSHP data. We then explore where, when, and what is reported in the data through a series of figures. Along the way, we highlight opprotunities to dig deeper or focus future analysis.
Data Background
The PNSHP data set brings together data on habitat restoration actions related directly or indirectly to salmonoid habitat in Oregon, Washington, Idaho, and Montana. Actions are categorized in to one of 82 action types and grouped by a geo-coded work site. Work sites are further grouped by project. Project-level information is available on the source (who reported the project, often a funder or another database) and expenditures. For many projects, information on the extent of the action taken (e.g. length of stream or road treated, area treated) is also available, though how this information is structured varies widely by action-type, source, and project complexity.
In this document, we include projects between 1991 and 2015 (25 years). During this period, the number of ESA-listed salmon Evolutionarily Significant Units (ESUs) grew from zero to 19 (including steelhead). The first listing was Snake River sockeye, listed as endangered in 1991. The most recent listing was the Oregon coast coho, listed as threatened in 2008. This period also covers major changes in available financing for the habitat projects. A major population boom in the region, especially in the Puget Sound basin, increased the tax base for state-funded projects (while simultaneously increasing pressure on salmon habitat via development and water demands). The financial crisis of 2008 also lead to funding cuts across government agencies. Projects are added to the database in batches in a rolling fashion, so far fewer projects are reported in the most recent years. To accommodate for this, I include only projects up to 2015.
I have also removed a handful of projects that are extreme outliers in either cost or number or work sites. Only projects with costs less than $50mill and with fewer than 50 work sites are included.
Project Structure Typology
Due to differences in how projects are funded, organized, and reported across sources, project data are structured in different ways. Some projects are quite complex, spanning dozens work sites miles apart with different actions at each. Some are simple, consisting of a single action at a single work site. Many are in-between, consisting of a handful of work site with the same action or a single work site with many actions.
To make matters more complex, project costs (i.e. expenditures) are always reported at the project level (rather than the action or work site level), while it appears that metrics (i.e. extent of action) are sometimes reported at the project level, sometimes at the work site level, and sometimes at the individual action level. This makes directly comparing average costs (i.e. expenditures per unit) between projects difficult.
Below, I present a typology of projects based on their structure. I distinguish between the number of work sites and the number of action types. From there, I further breakdown each category by whether costs and metrics are available, costs only are available, or no costs are available (metrics without costs are not useful for the purpose of modeling costs).
The majority of projects fall into either the single work site, single action type category. Among multiple work site projects, the majority fall into the single action type category, which will greatly simplify subsequent analysis. For multiple action type projects, directly modeling average costs will be difficult, as distinguishing between spending on different action types is impossible. One approach may be to model individual actions and use multiple action type projects as a check, using single action type model results to project expected costs for multiple action type projects and compare projected and observed total project costs between the two.
For projects where costs are available but not metrics, all is not lost. We could consider a more general model of costs at the project level, where the number of distinct actions, the total number of actions, or which types of actions, and the number of work sites are considered as covariates. This kind of model could inform decisions on project structure. Are more complex projects more expensive than simpler projects? Or do scale effects swamp increased costs due to complexity?
All projects (n = 29,916)
- Single work site (n = 24,132)
- Single action type (n = 18,078)
- Costs and metrics available (n = 3,306)
- Costs only (n = 7,858)
- Costs unavailable (n = 6,914)
- Multiple action types (n = 6,054)
- Costs and metrics available (n = 893)
- Costs only (n = 2,465)
- Costs unavailable (n = 2,696)
- Multiple work sites (n = 5,784)
- Single action type (n = 3,101)
- Costs and metrics available (n = 528)
- Costs only (n = 2,388)
- Costs unavailable (n = 185)
- Multiple action types (n = 2,683)
- Costs and metrics available (n = 348)
- Costs only (n = 2,052)
- Costs unavailable (n = 283)
Source Glossary
Thirty-eight different organizations, referred to as sources, contribute data to PNSHP. Below you will find a glossary of each source code.
ASOTIN - Asotin County Conservation District (Asotin County is the southeastern-most county in Washington and contains important Snake River watersheds)
BLM - Bureau of Land Management
BOR - Bureau of Reclamation (Department of the Interior agency responsible for water storage and irrigation, including federal dams)
BPA - Bonneville Power Administration
CBFWA - Columbia Basin Fish and Wildlife Authority (Now defunct group of state, federal, and tribal agencies organized to advise BPA on habitat improvement efforts)
CHEHALIS - Chehalis Tribe (Southwestern Washington)
COLVILLE - Colville Tribe (Northeastern Washington)
COQUILLE - Coquille Tribe (Southwestern Oregon)
COWLITZ - Cowlitz Tribe (Northeastern Washington)
CRITFC - Columbia River Inter-Tribal Fisheries Commission
DUCKS UNLIMITED - Ducks Unlimited
FISHER FISHERIES - Fisher Fisheries Consultancy
GRAND RONDE - Grand Ronde Tribe (Central Western Oregon)
GRMWP - Grande Ronde Model Watershed Program (Northeastern Oregon river)
HABITAT WORK SCHEDULE - Washington State program for tracking projects by the 27 “Lead Entities”, local boards responsible for managing state salmon habitat spending ID OSC - Idaho Office of Species Conservation
IDAHODEQ - Idaho Department of Environmental Quality
IDFG - Idaho Department of Fish and Game
IDFG SCREEN SHOP - Fish screen efforts for IDFG
KRITFWC - Klamath River Inter-Tribal Fish and Water Commission (Southern Oregon river)
MONTANA WATER CENTER - Research institute based at Montana State
NMFS - NOAA Fisheries
NOAA RESTORATION - NOAA Restoration Center
NRRSS - National River Restoration Science Synthesis project (a project of American Rivers)
NWIFC - Northwest Indian Fisheries Commission
OR WATER TRUST - Oregon Water Trust
OWRI - Oregon Watershed Restoration Inventory
PCSRF - Pacific Coastal Salmon Recovery Fund (federal grant program administered by NOAA)
REO - United States Forest Service Region 6 Regional Ecosystem Office
SHOSHONE-BANNOCK - Shoshone-Bannock Tribes (Southeastern Idaho)
SRFBD - Salmon Funding Recovery Board Database (Washington State Recreation and Conservation Office grant program)
STREAMNET - Data project of the Pacific States Marine Fisheries Commission
WA DOE - Washington State Department of Ecology
WA RCO - Washington State Recreation and Conservation Office
WA WATER TRUST - Washington Water Trust
WDFW FISHWAY - Washington State Department of Fish and Wildlife (WDFW) Fish way Program
WDFW WRIP - WDFW Watershed Recovery Inventory Project
WDOT - Washington Department of Transportation
Action and Project Counts
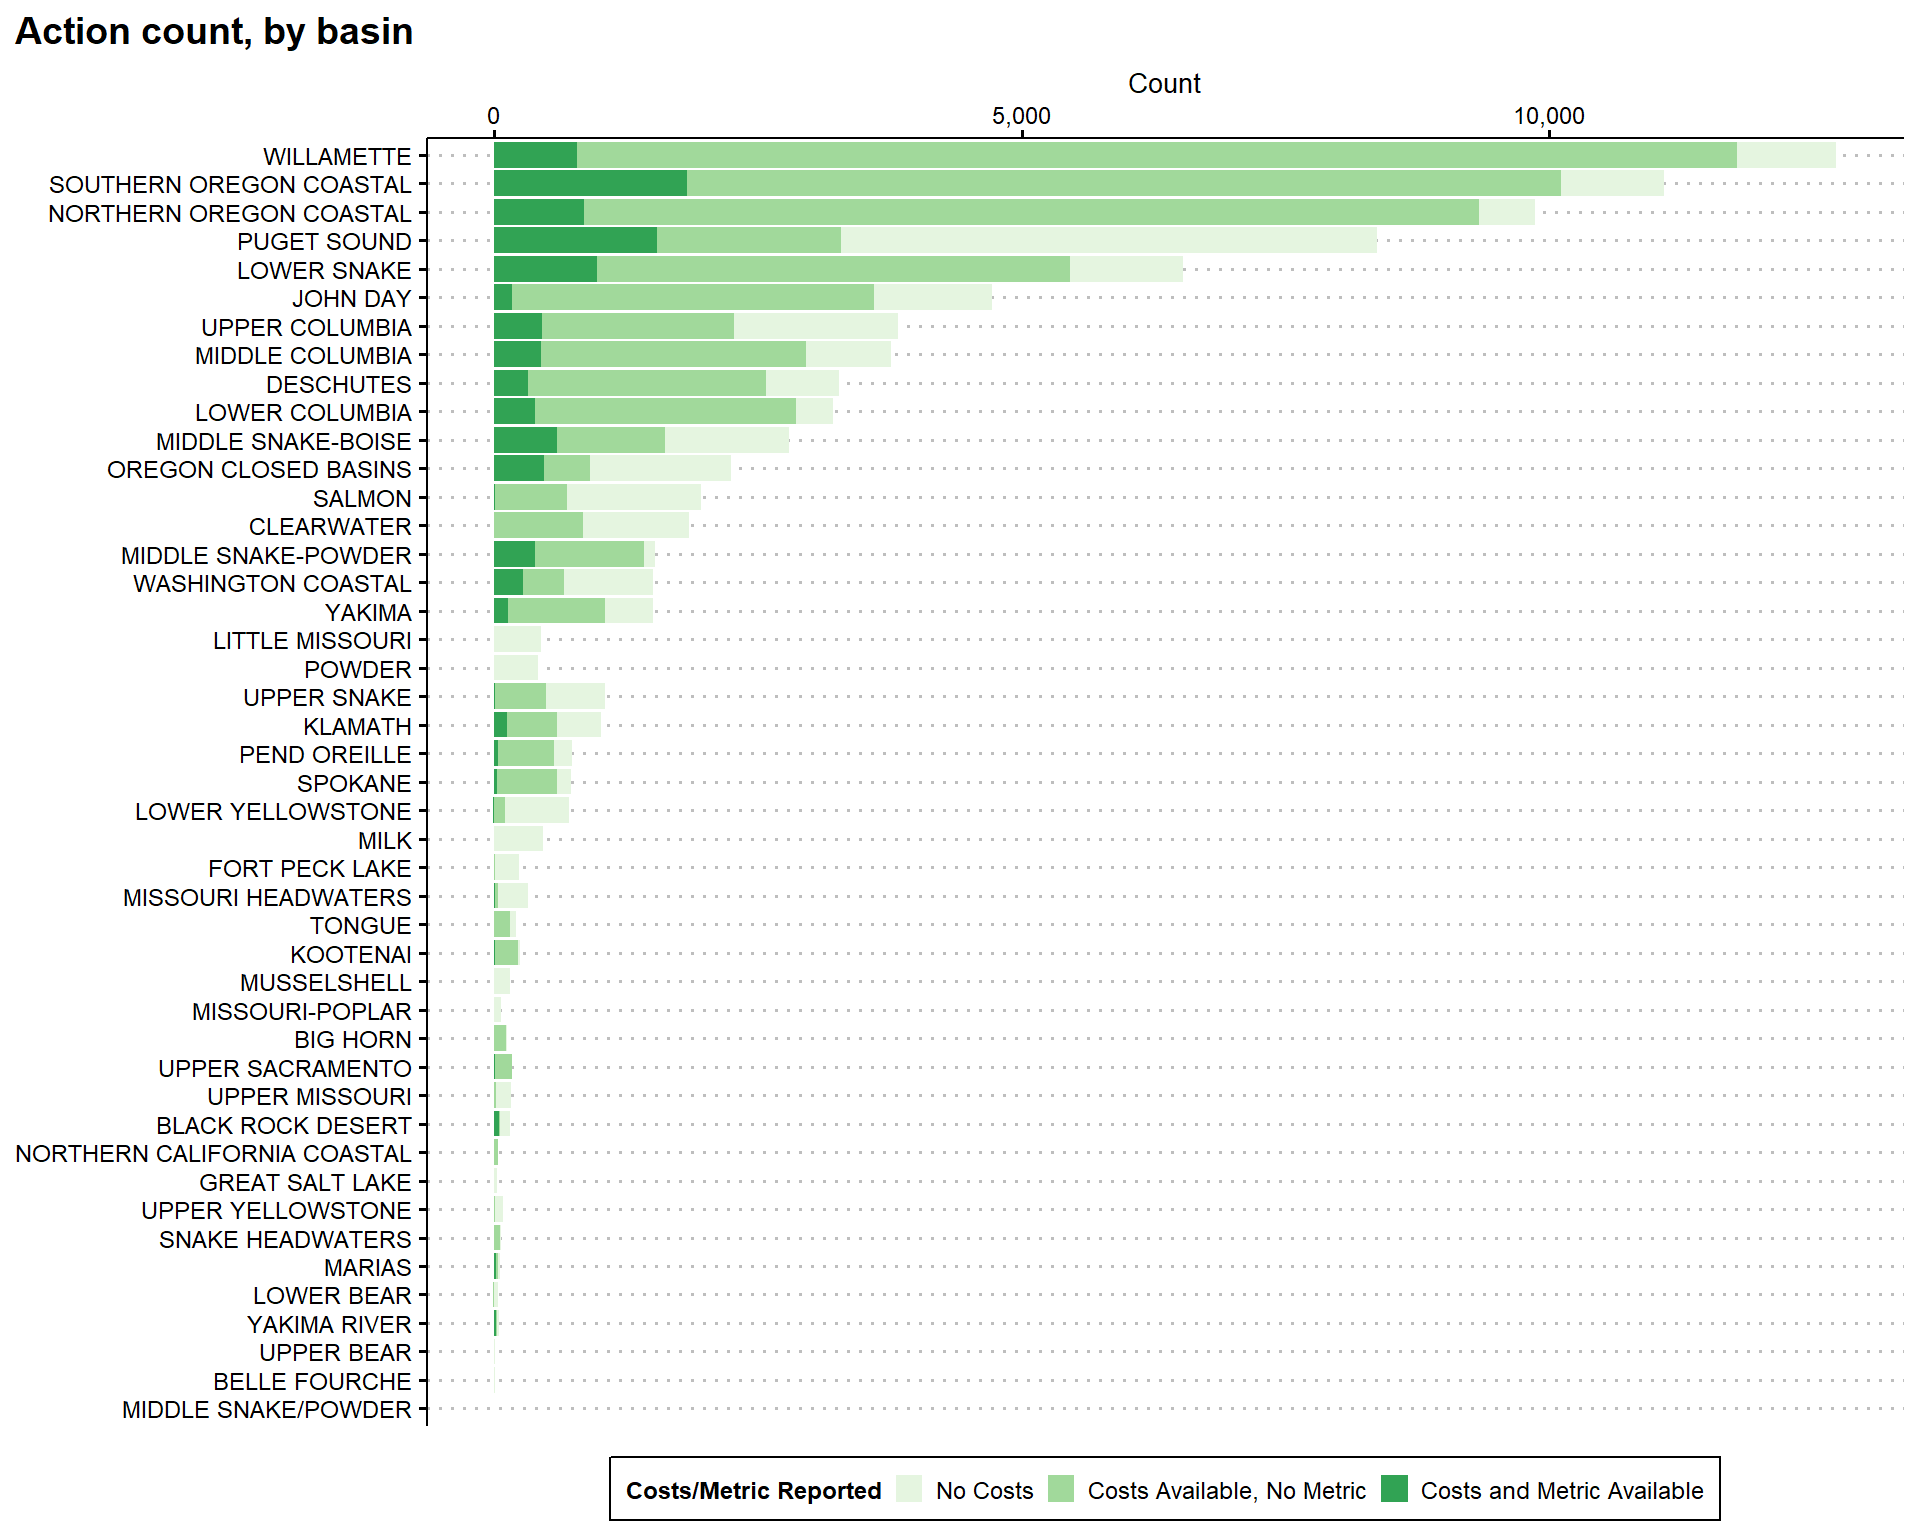
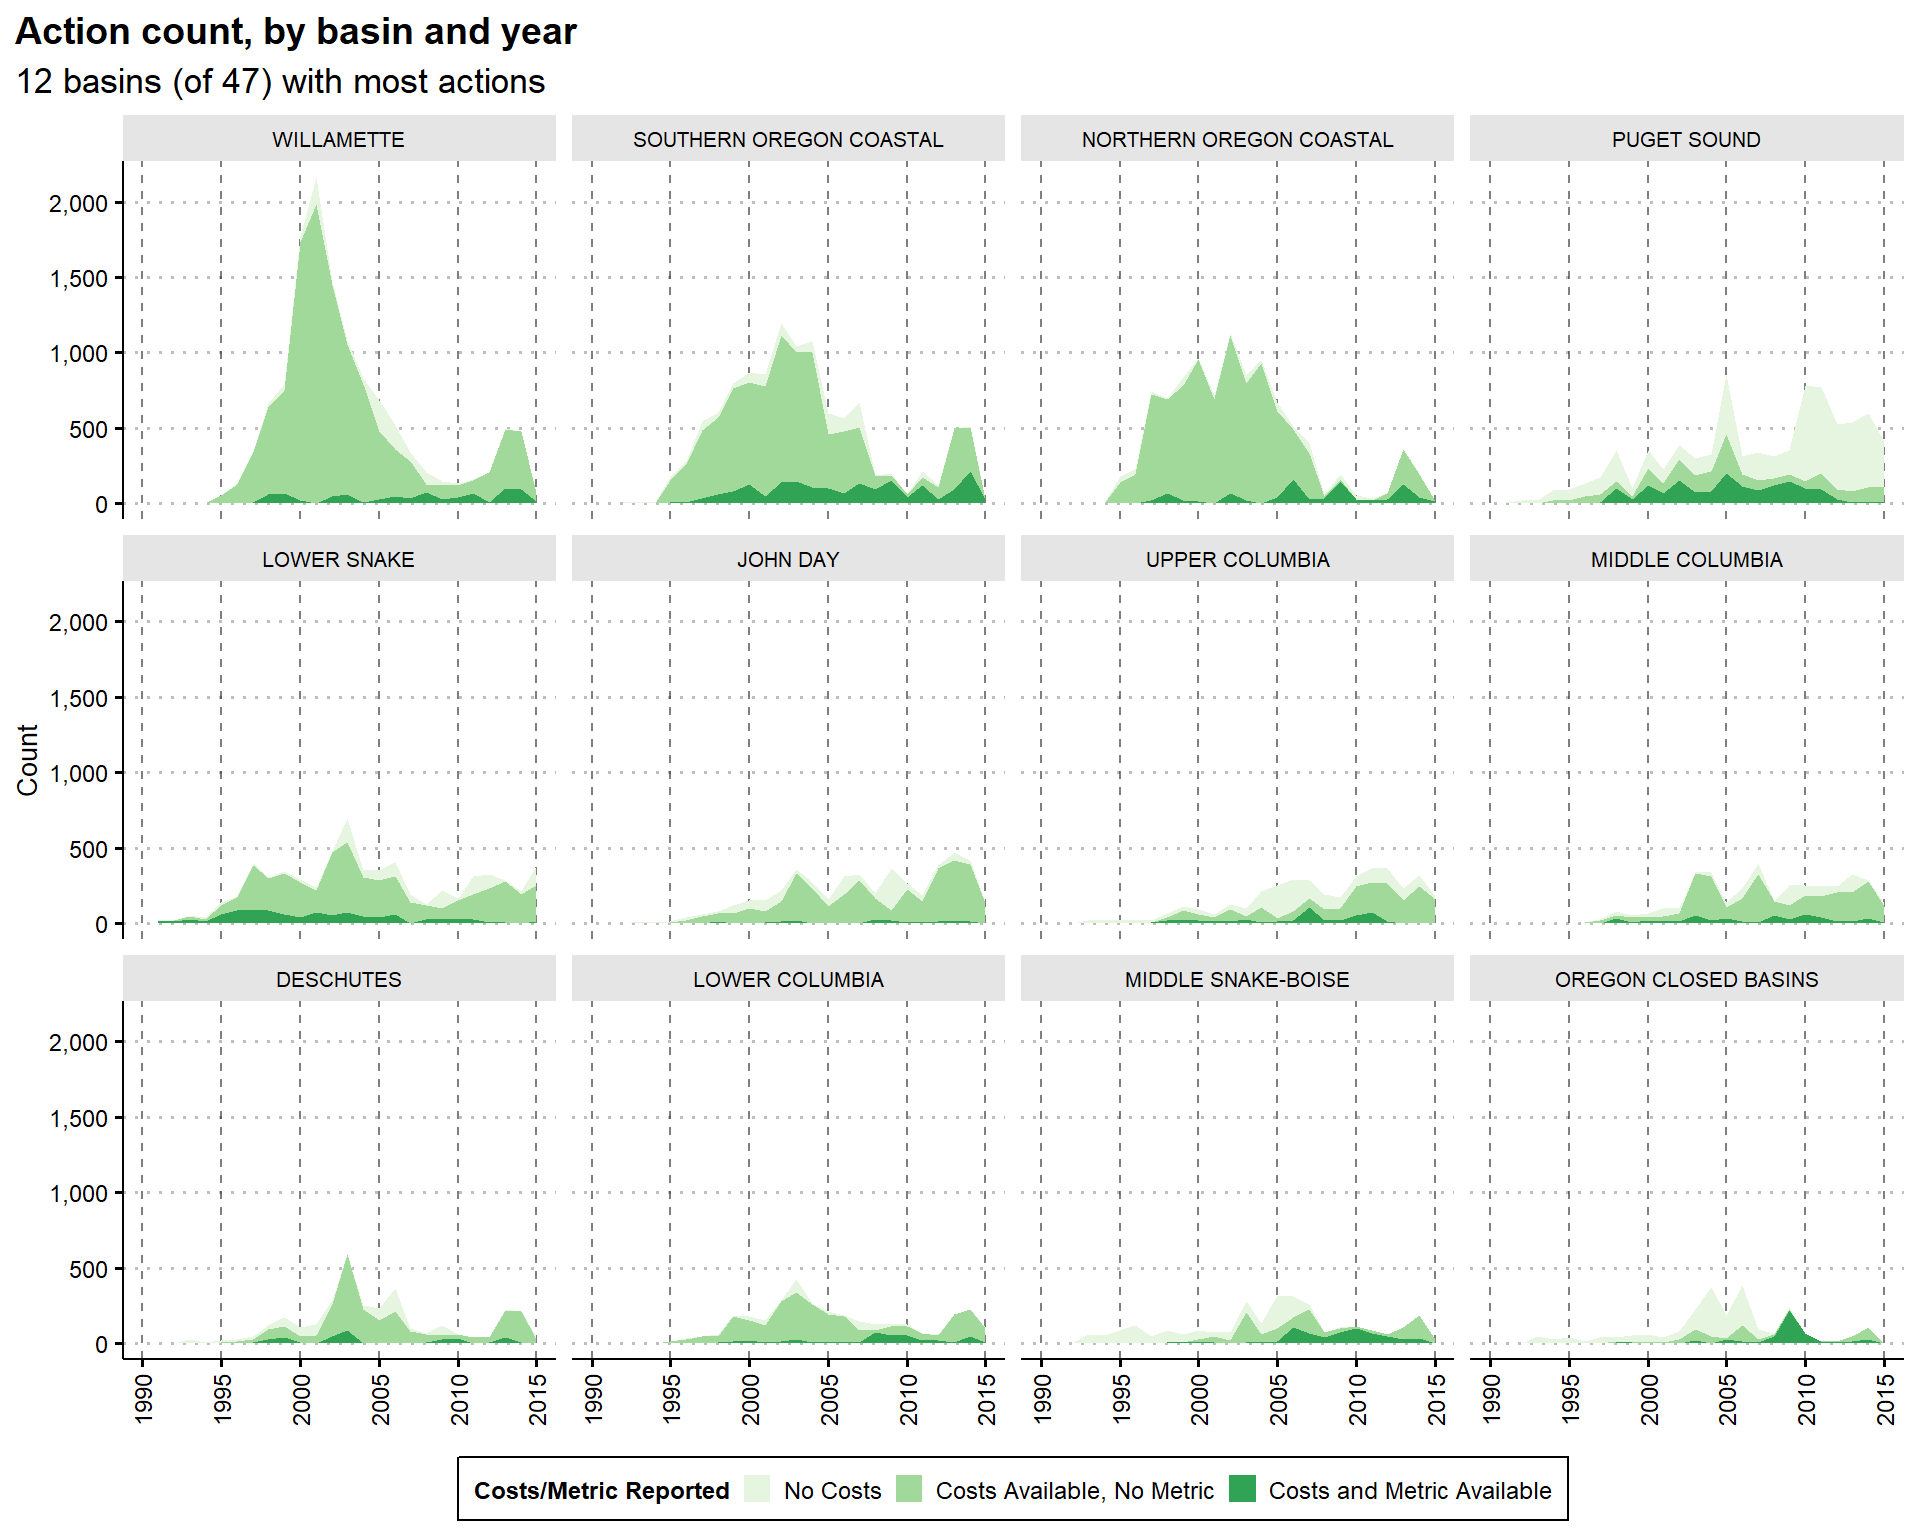
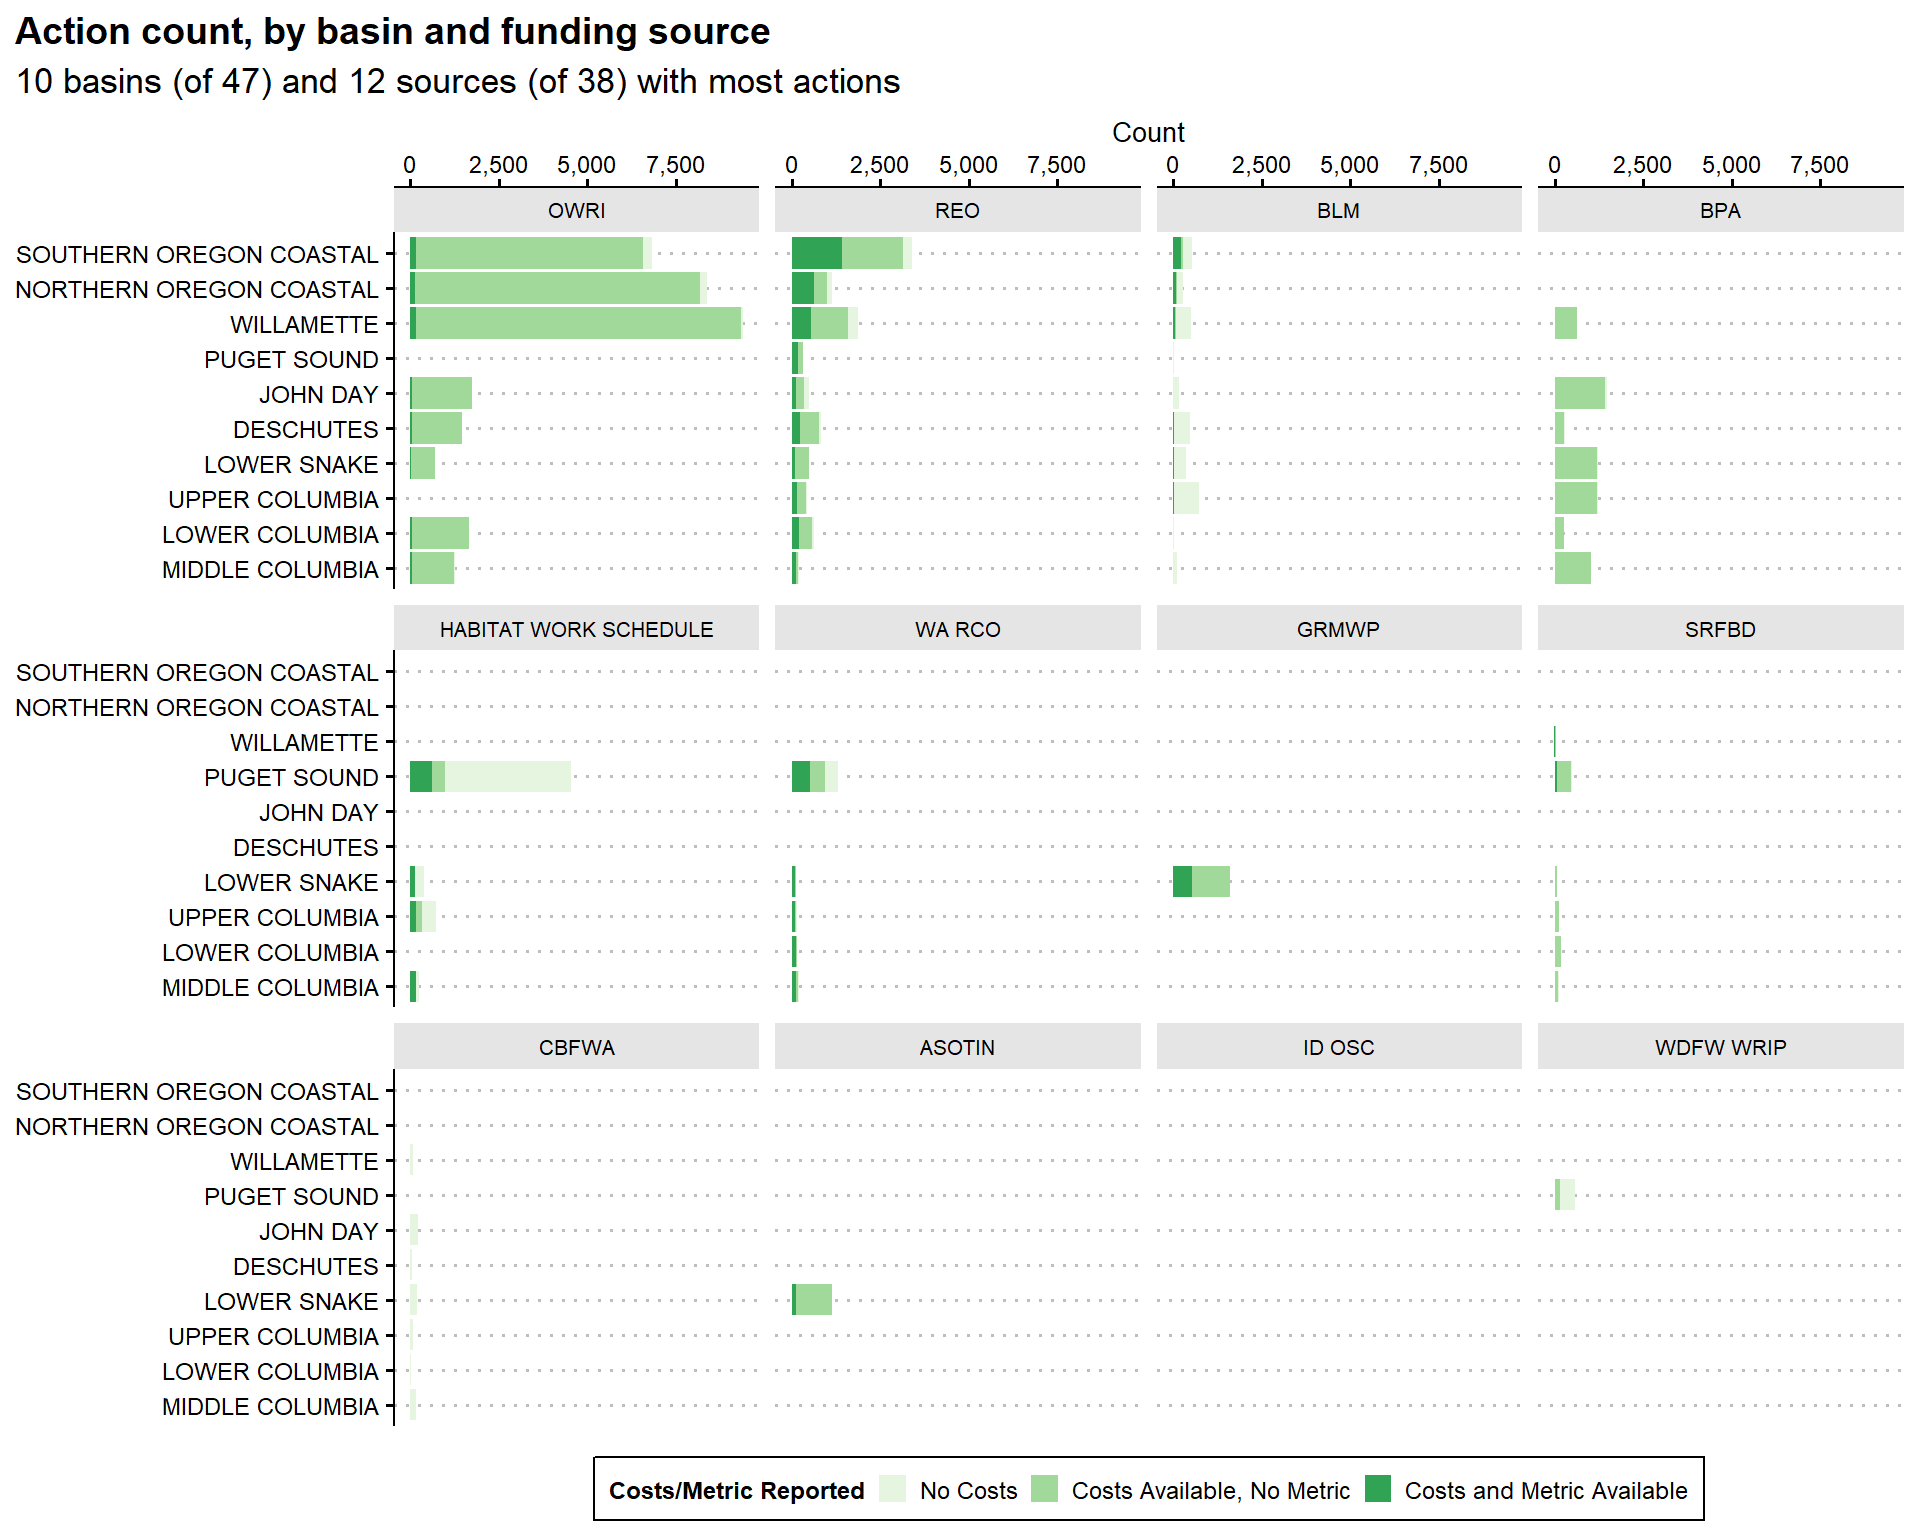
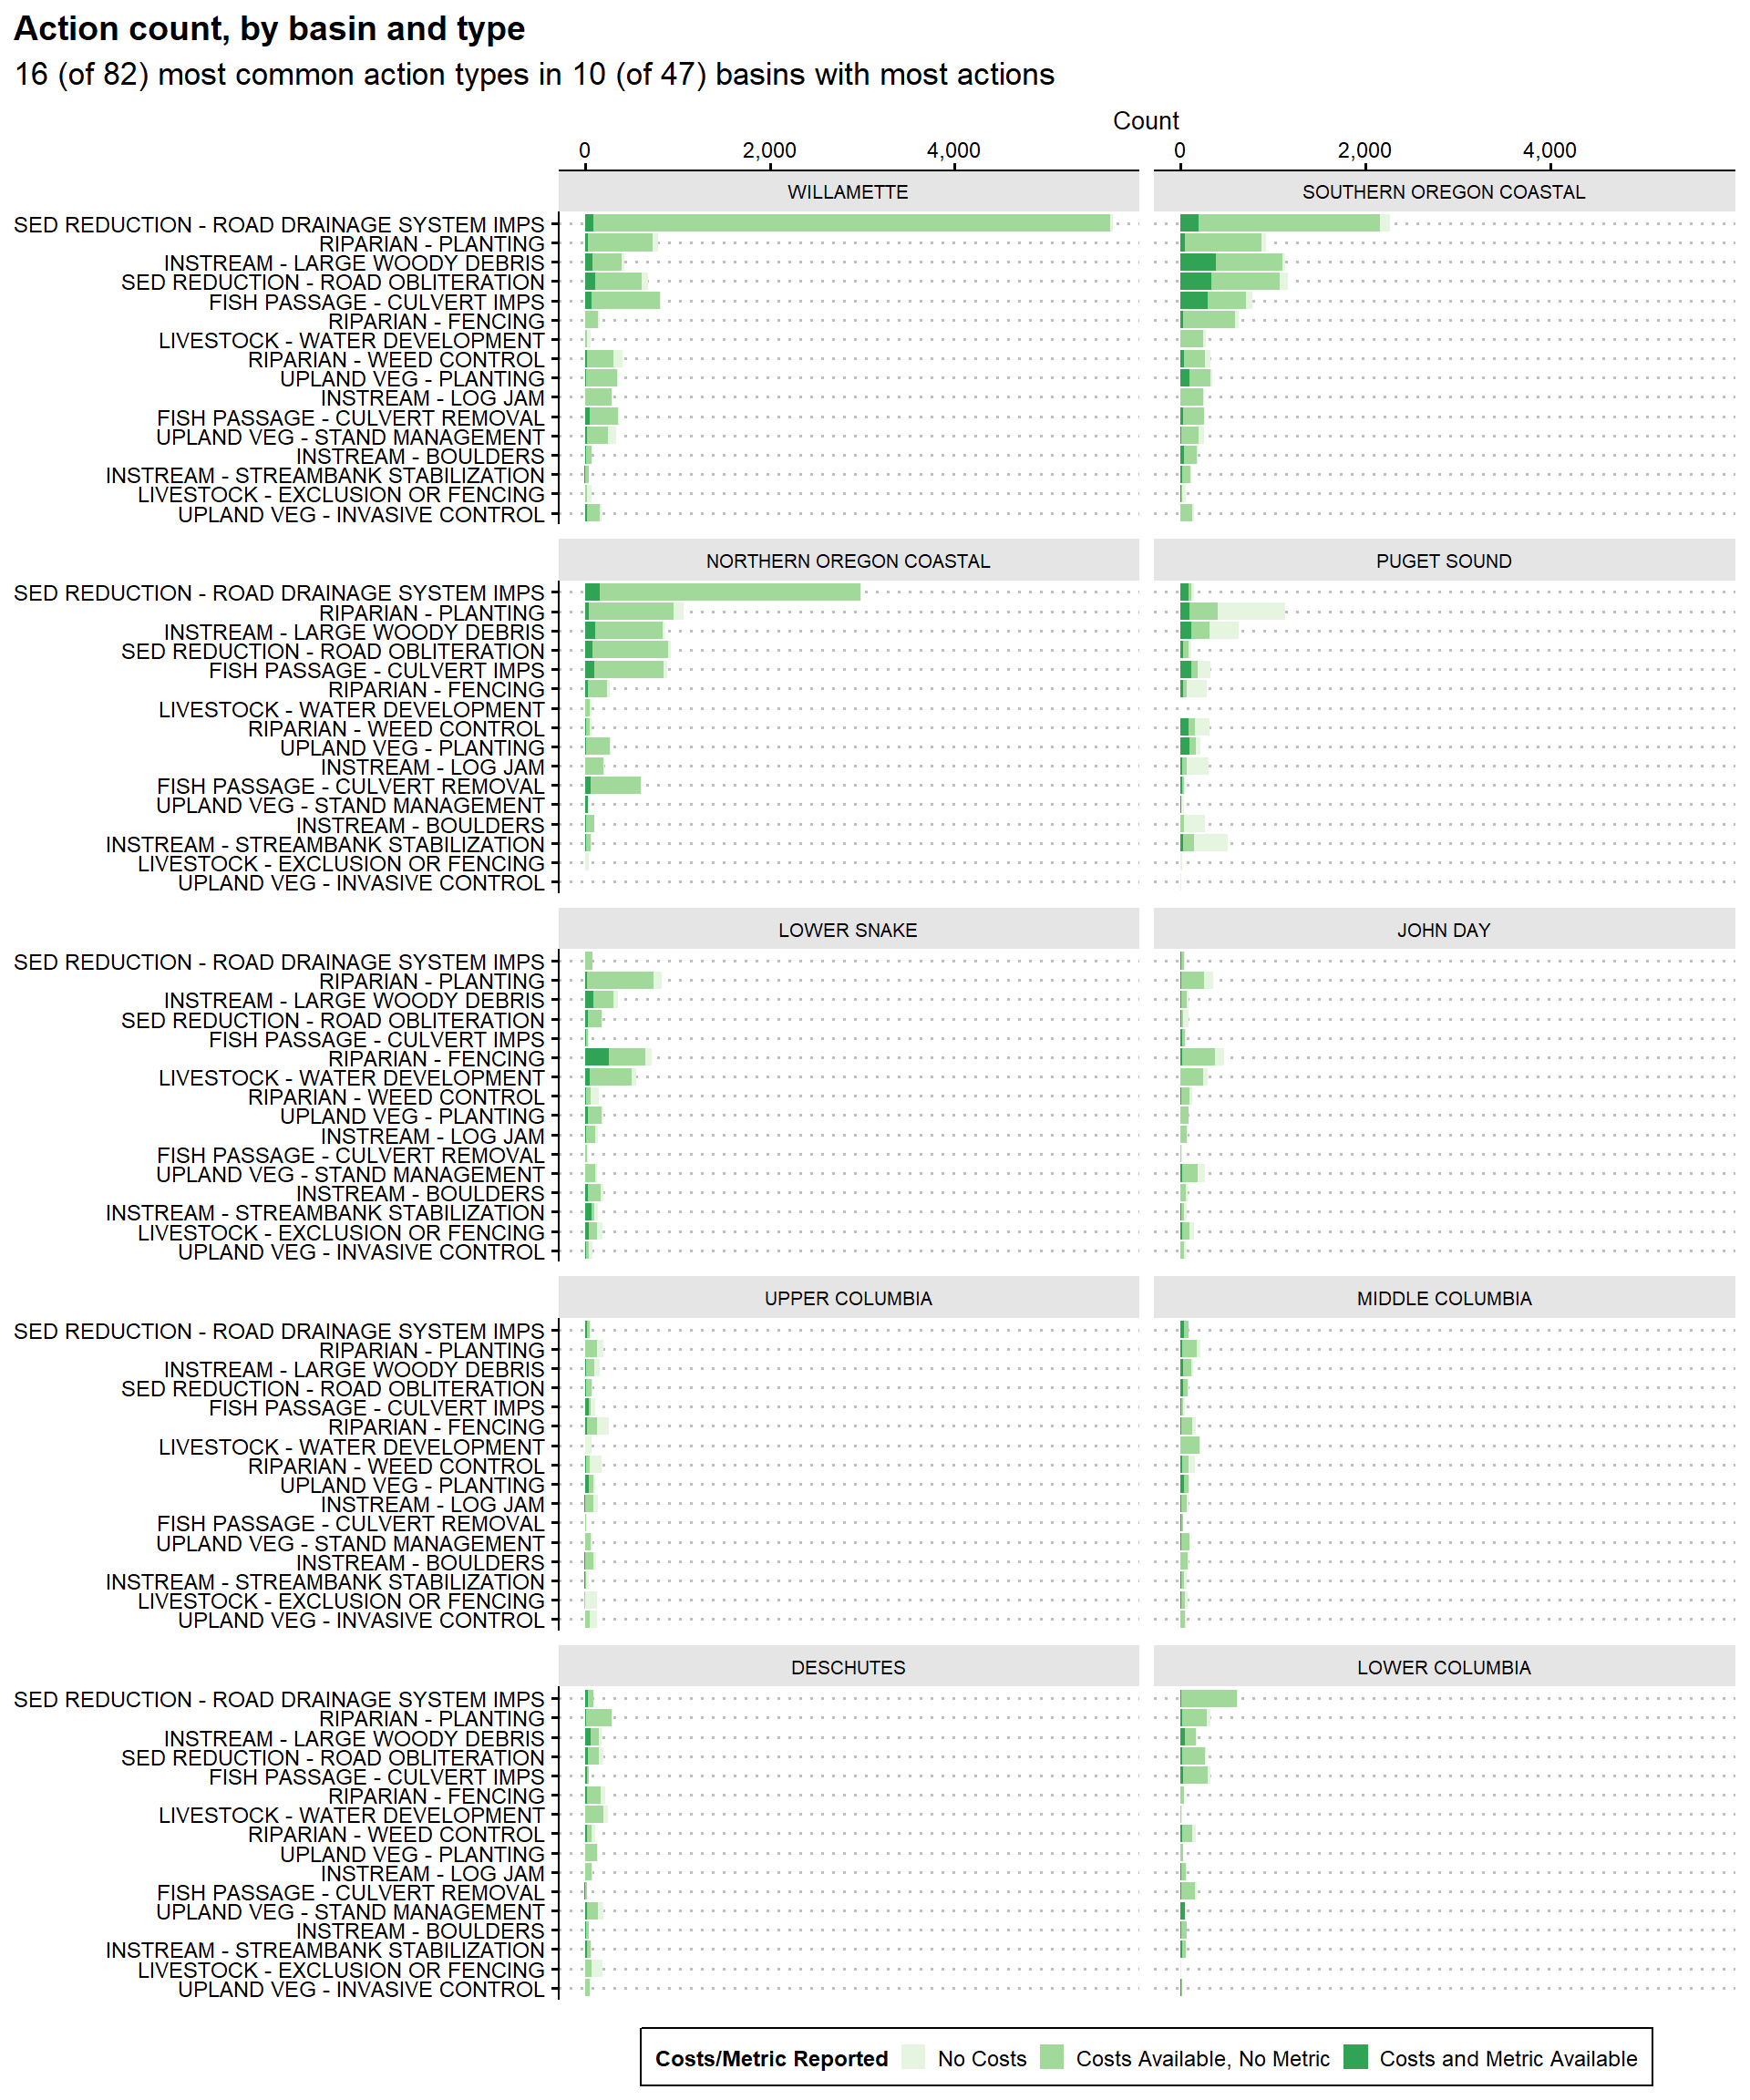
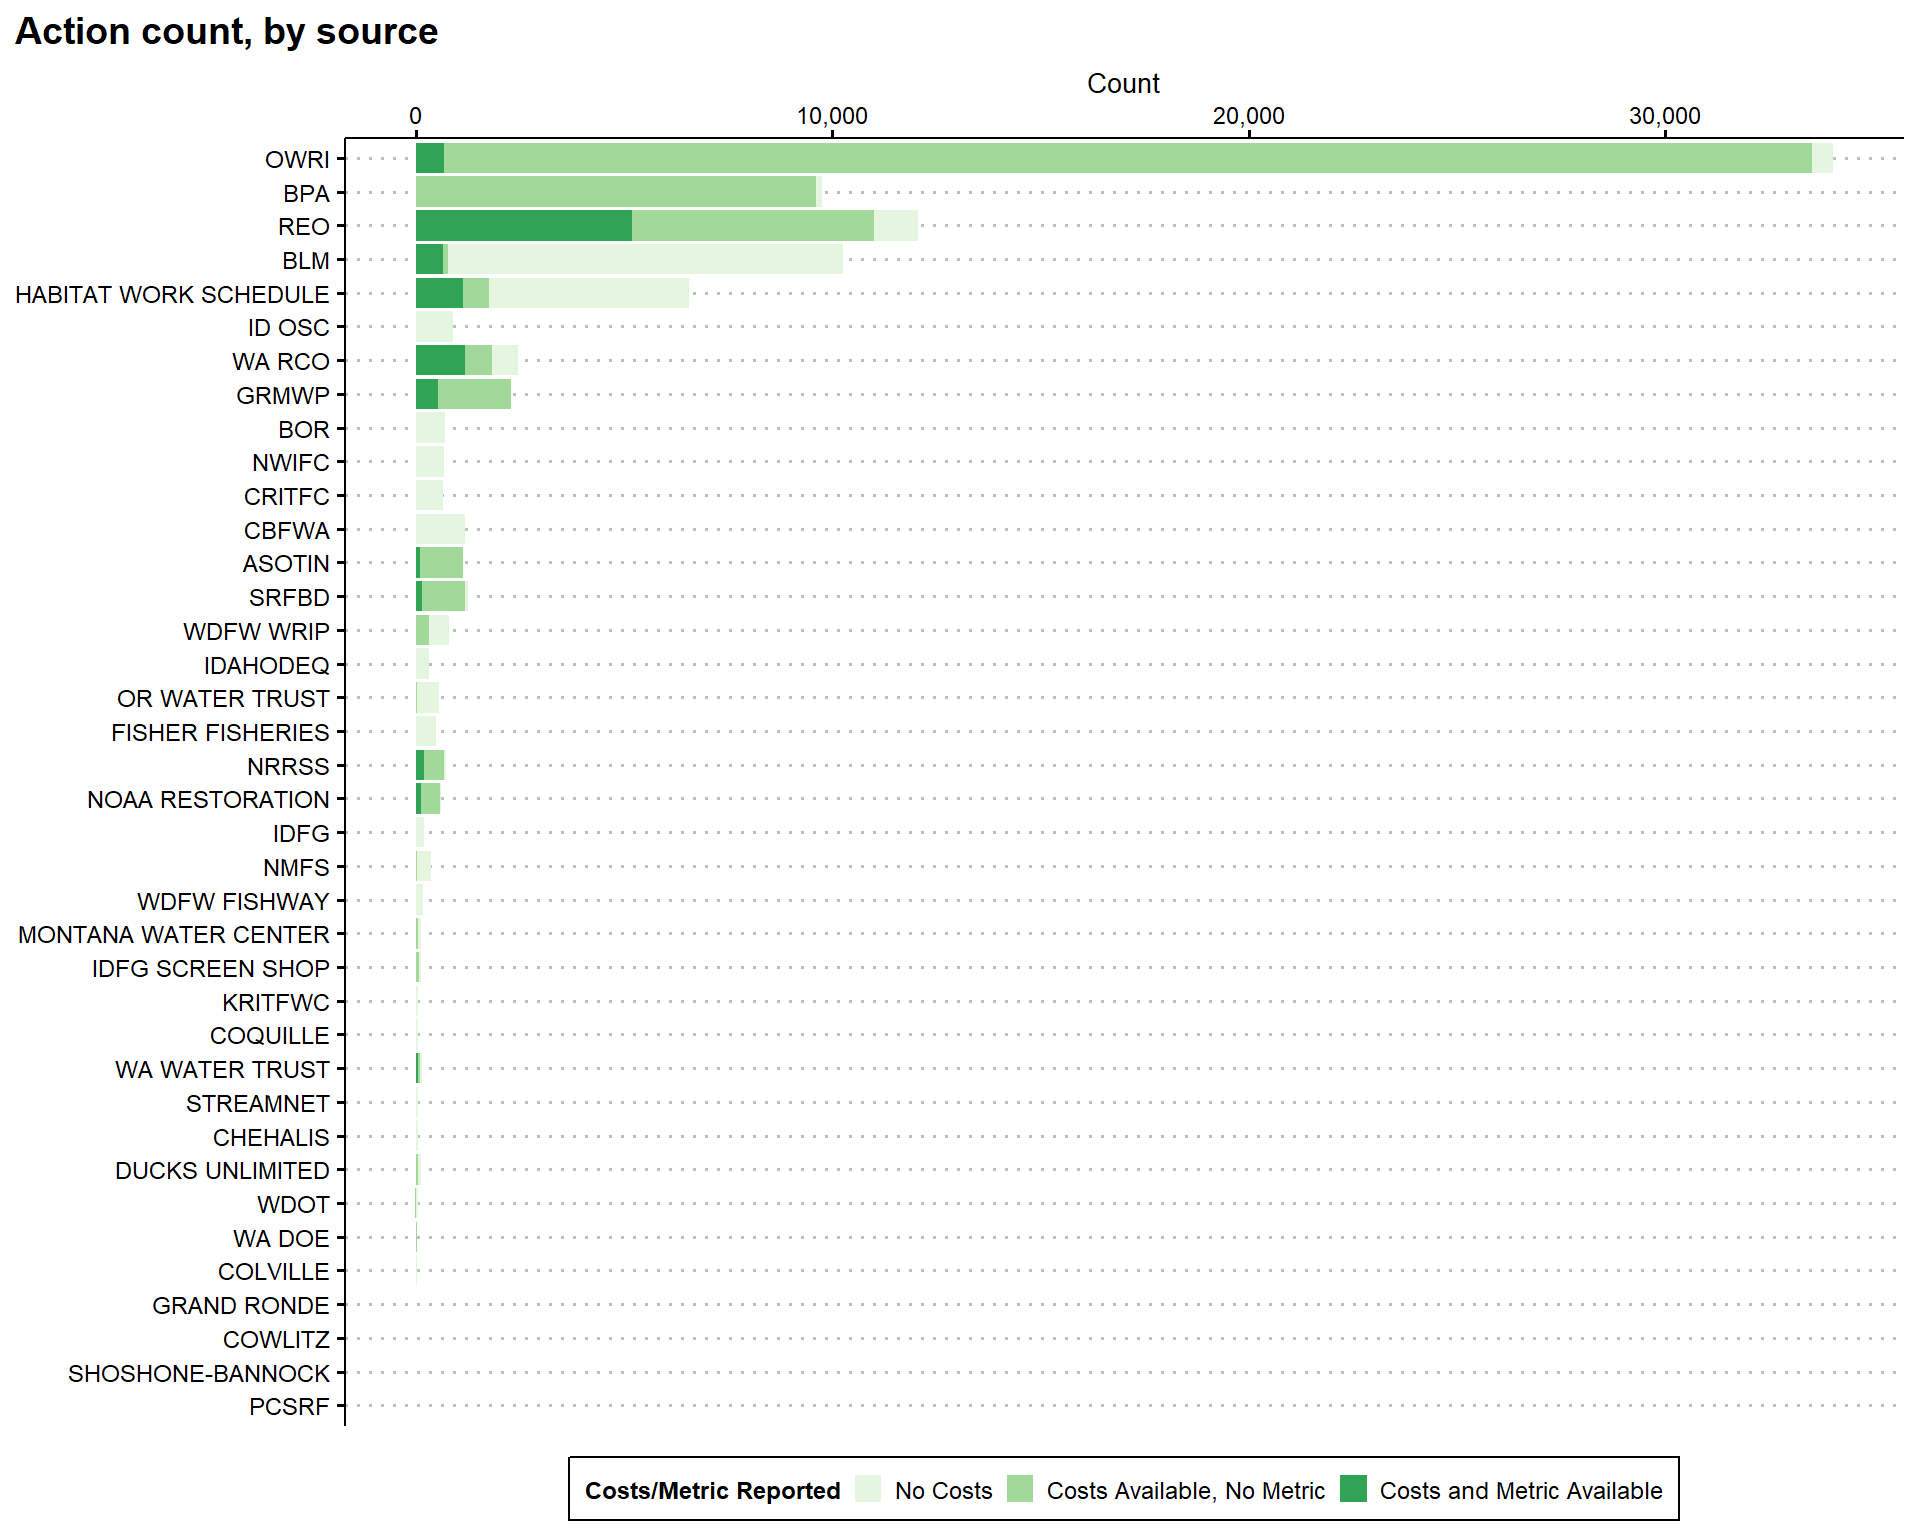
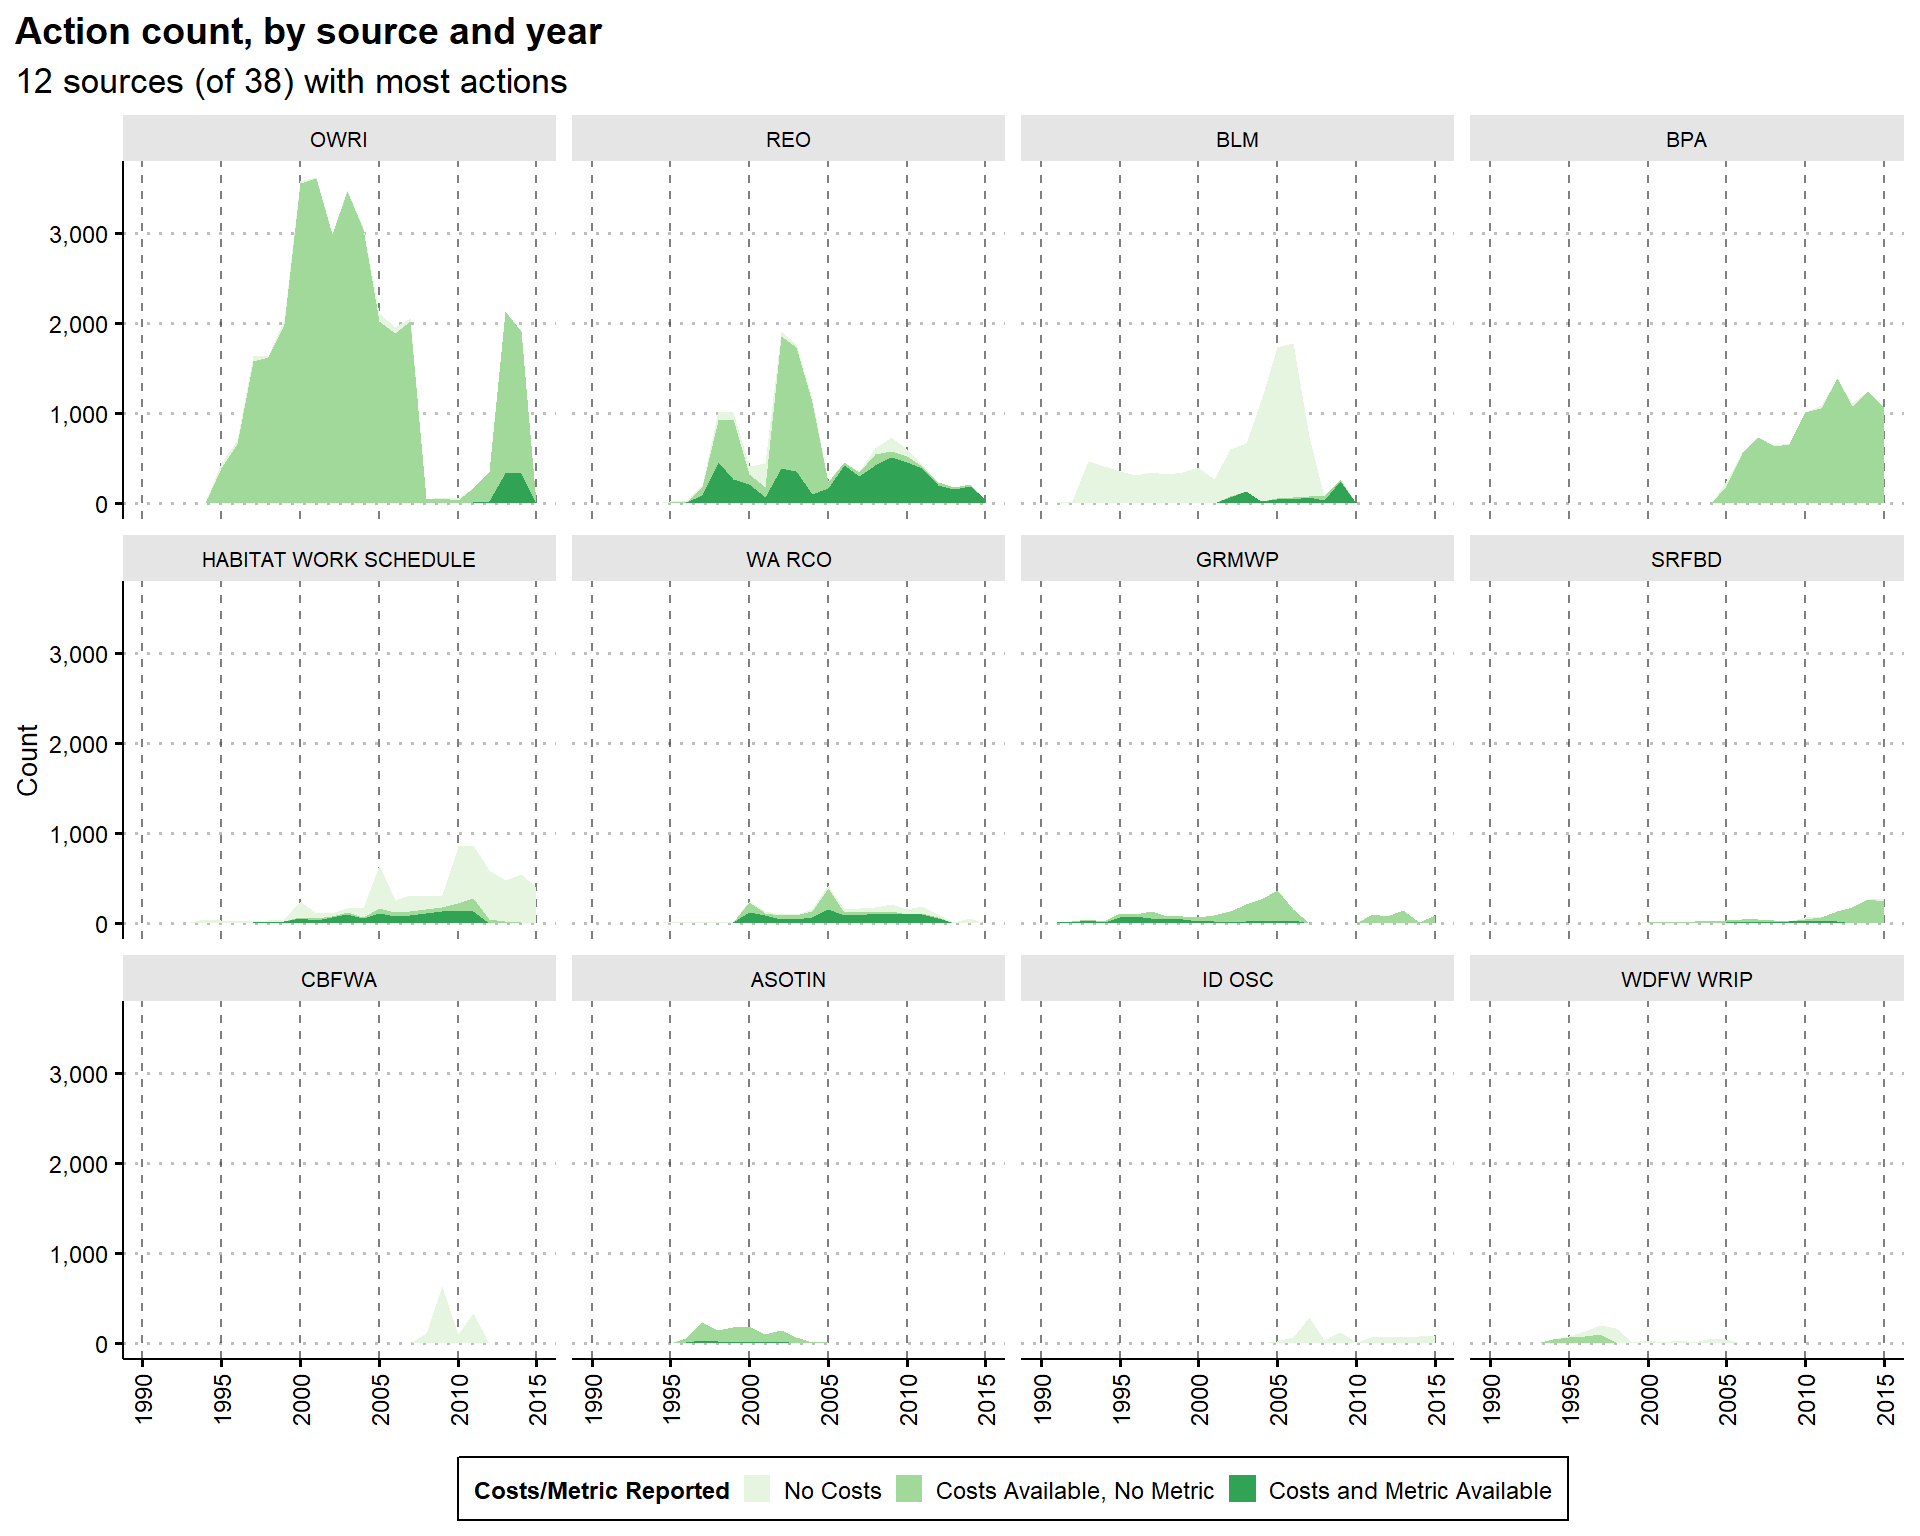
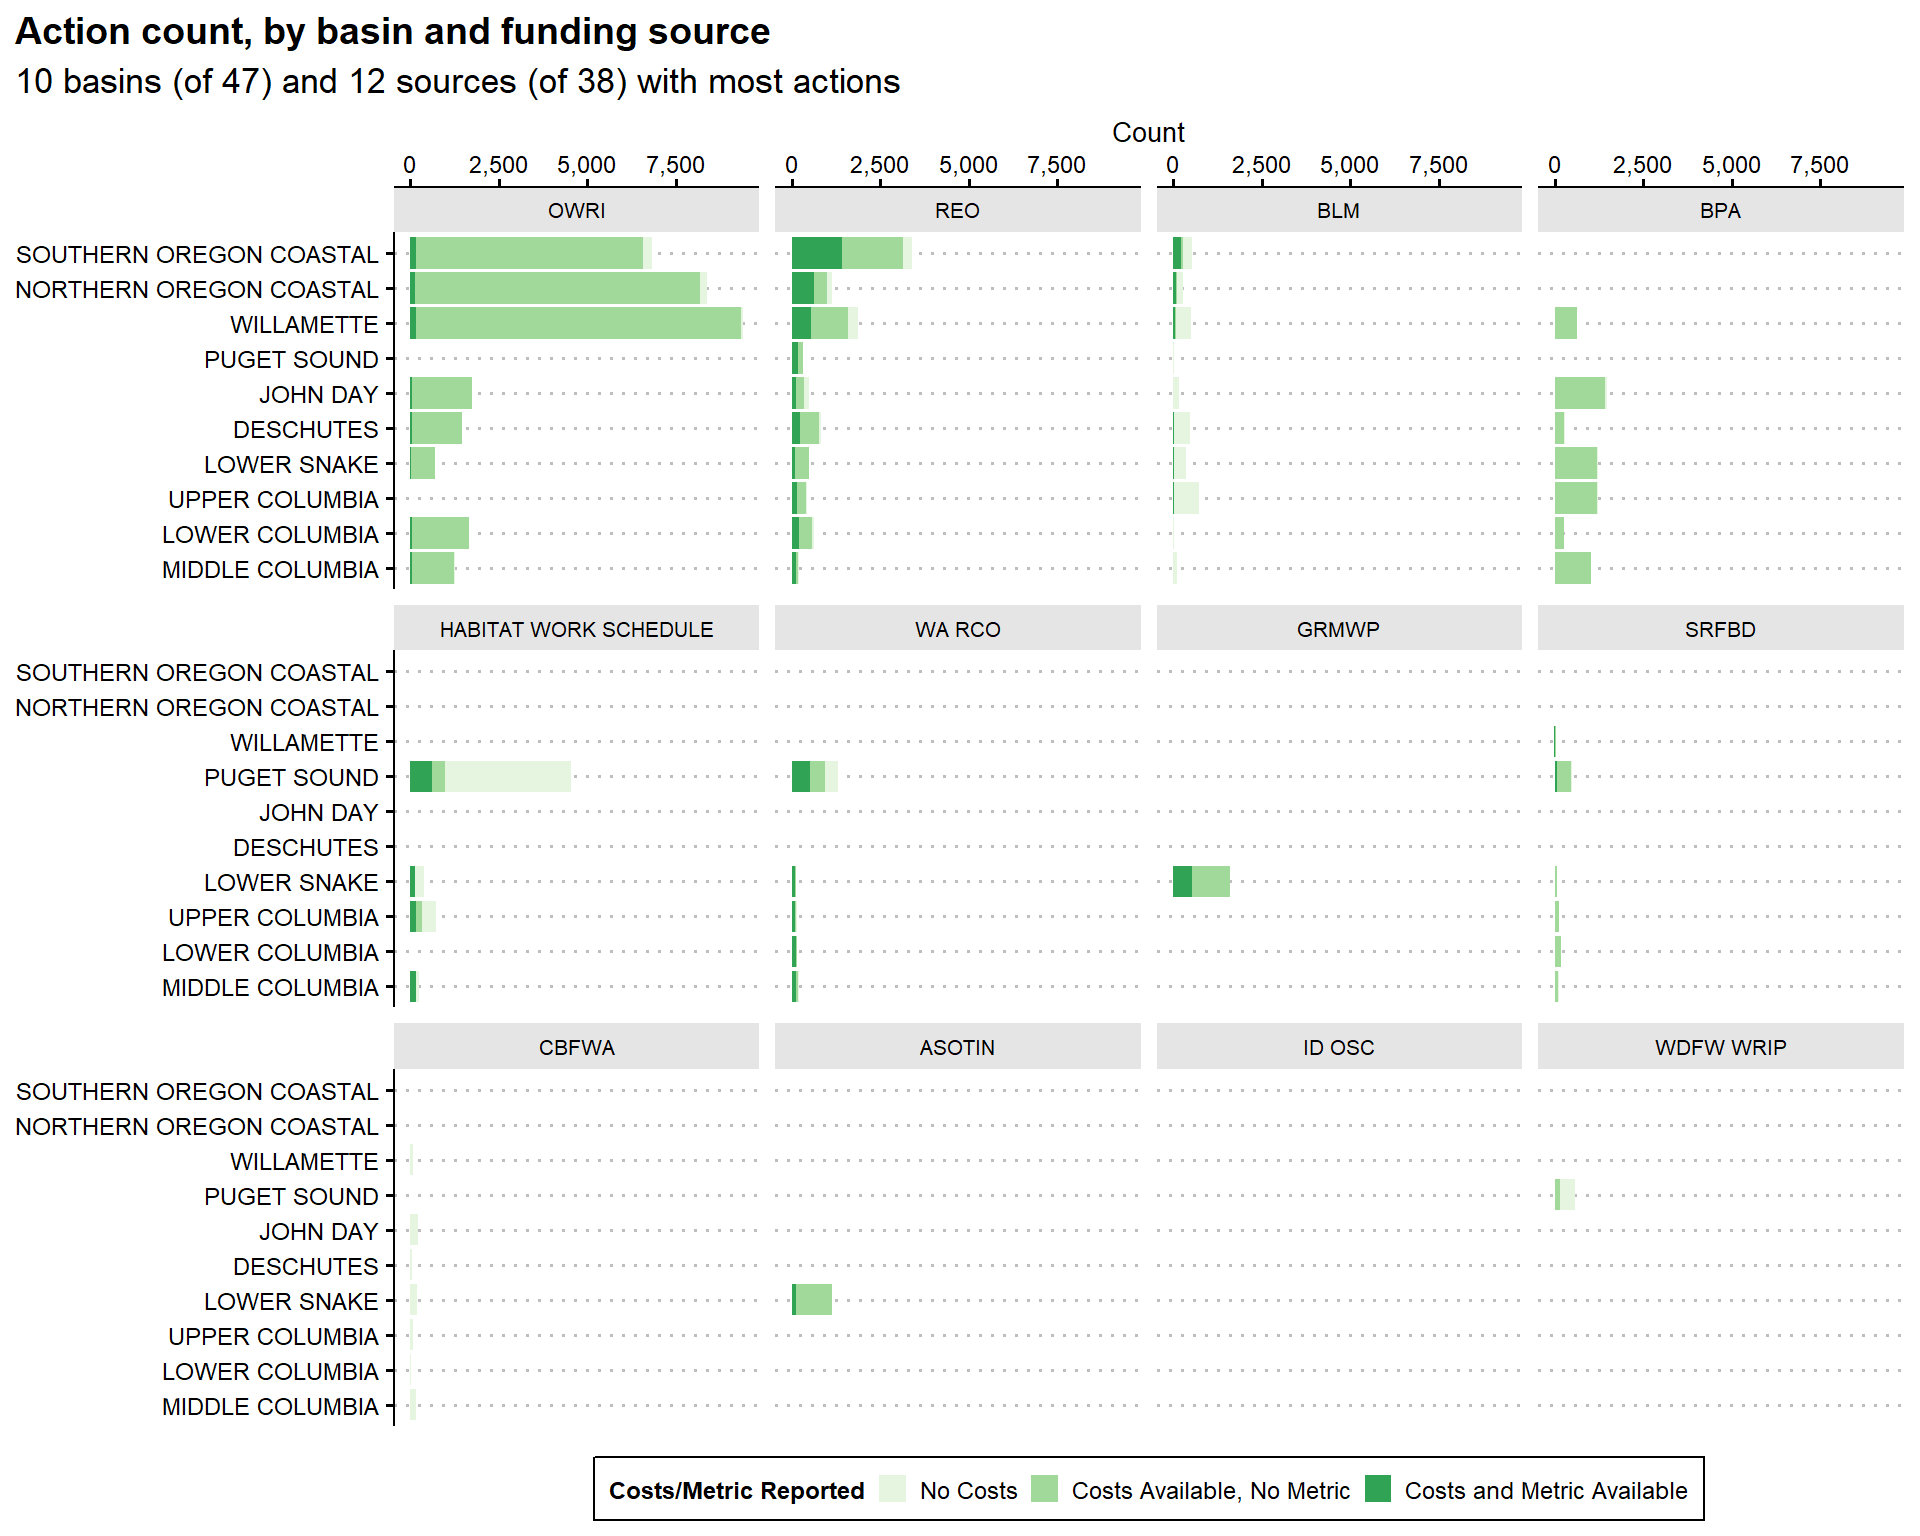
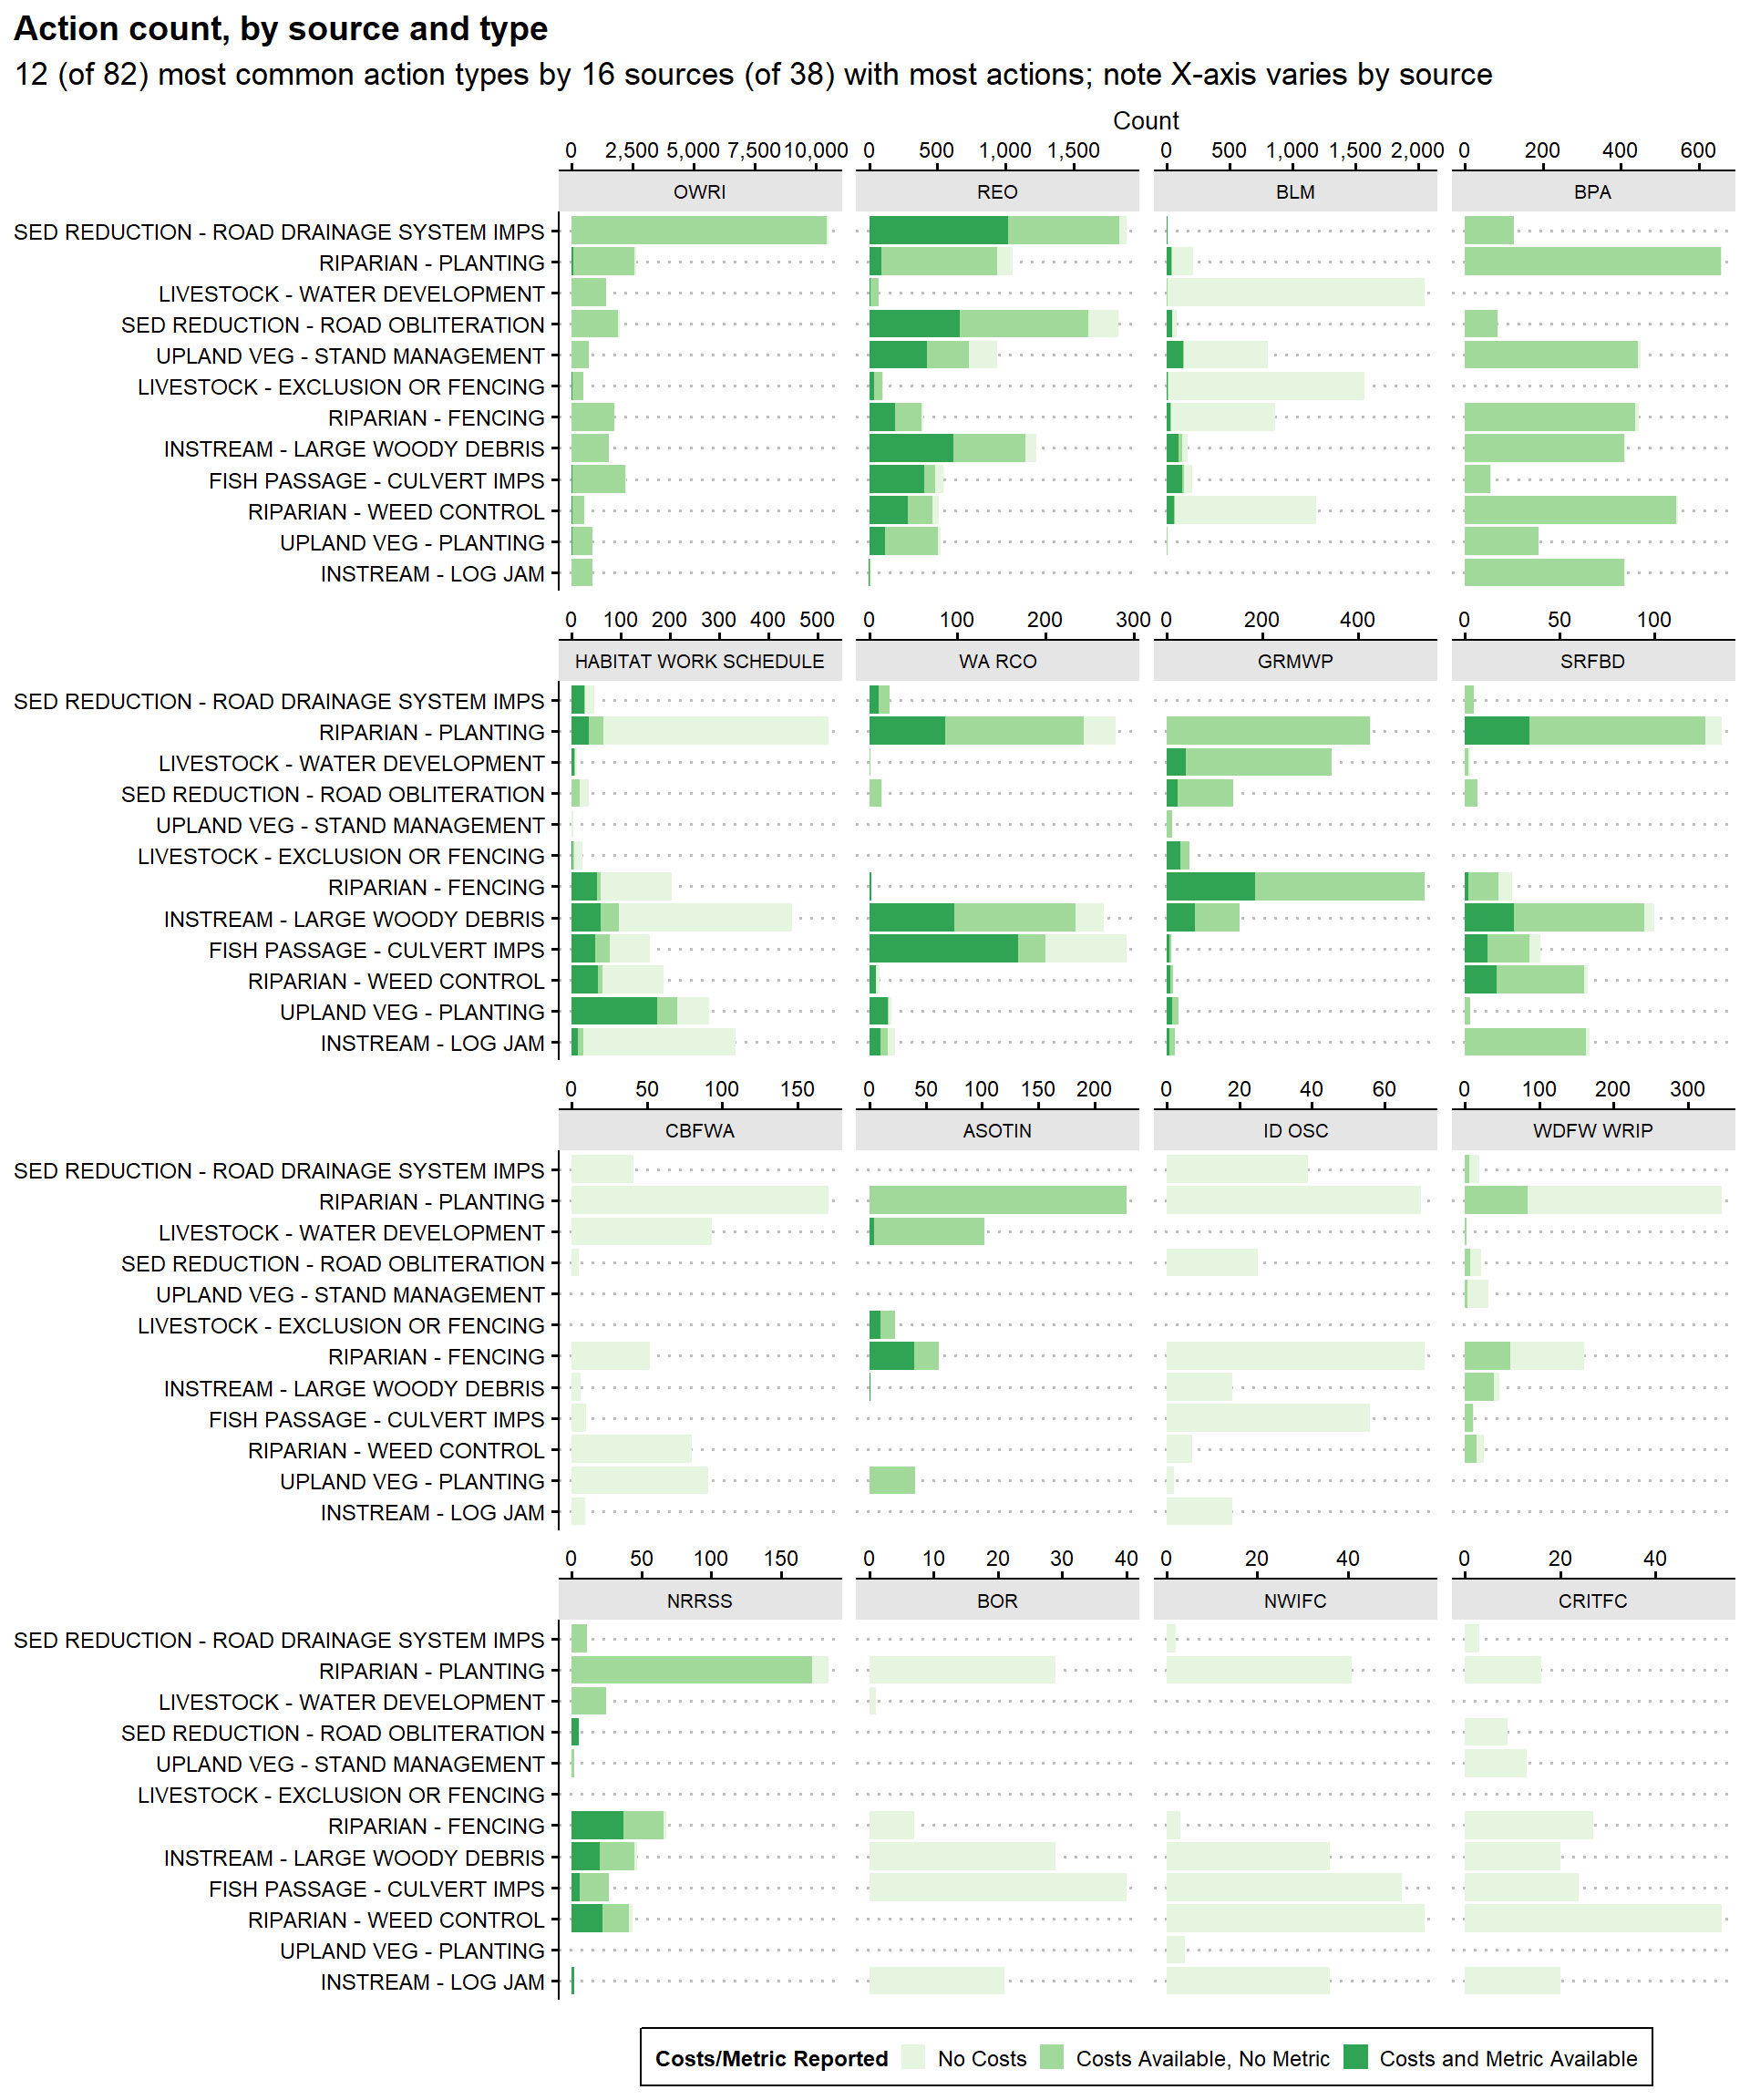
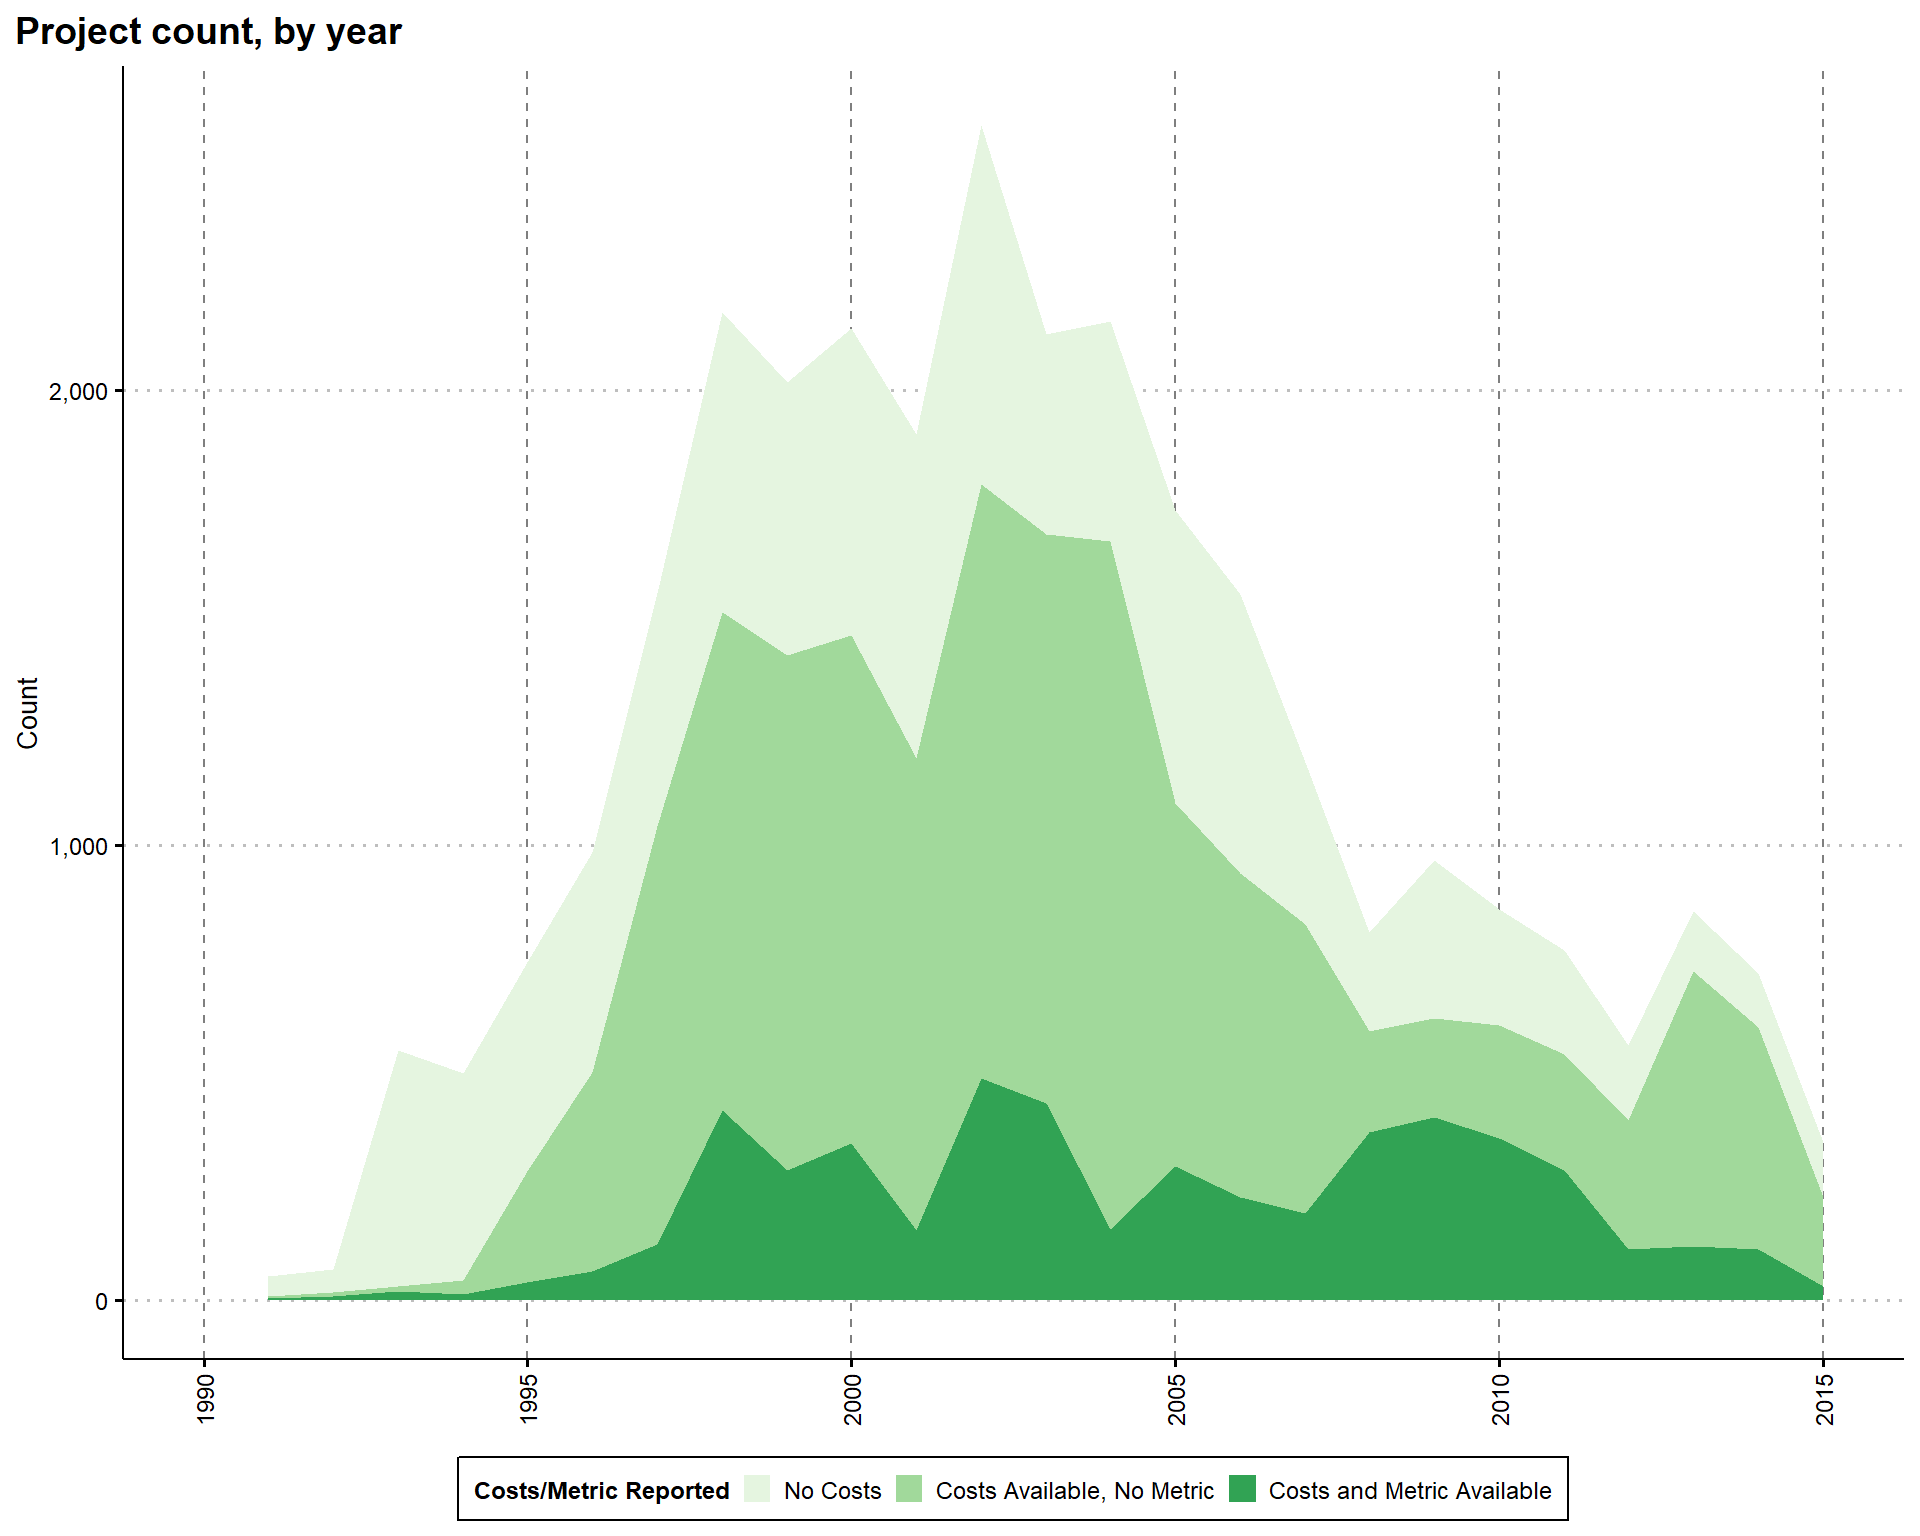
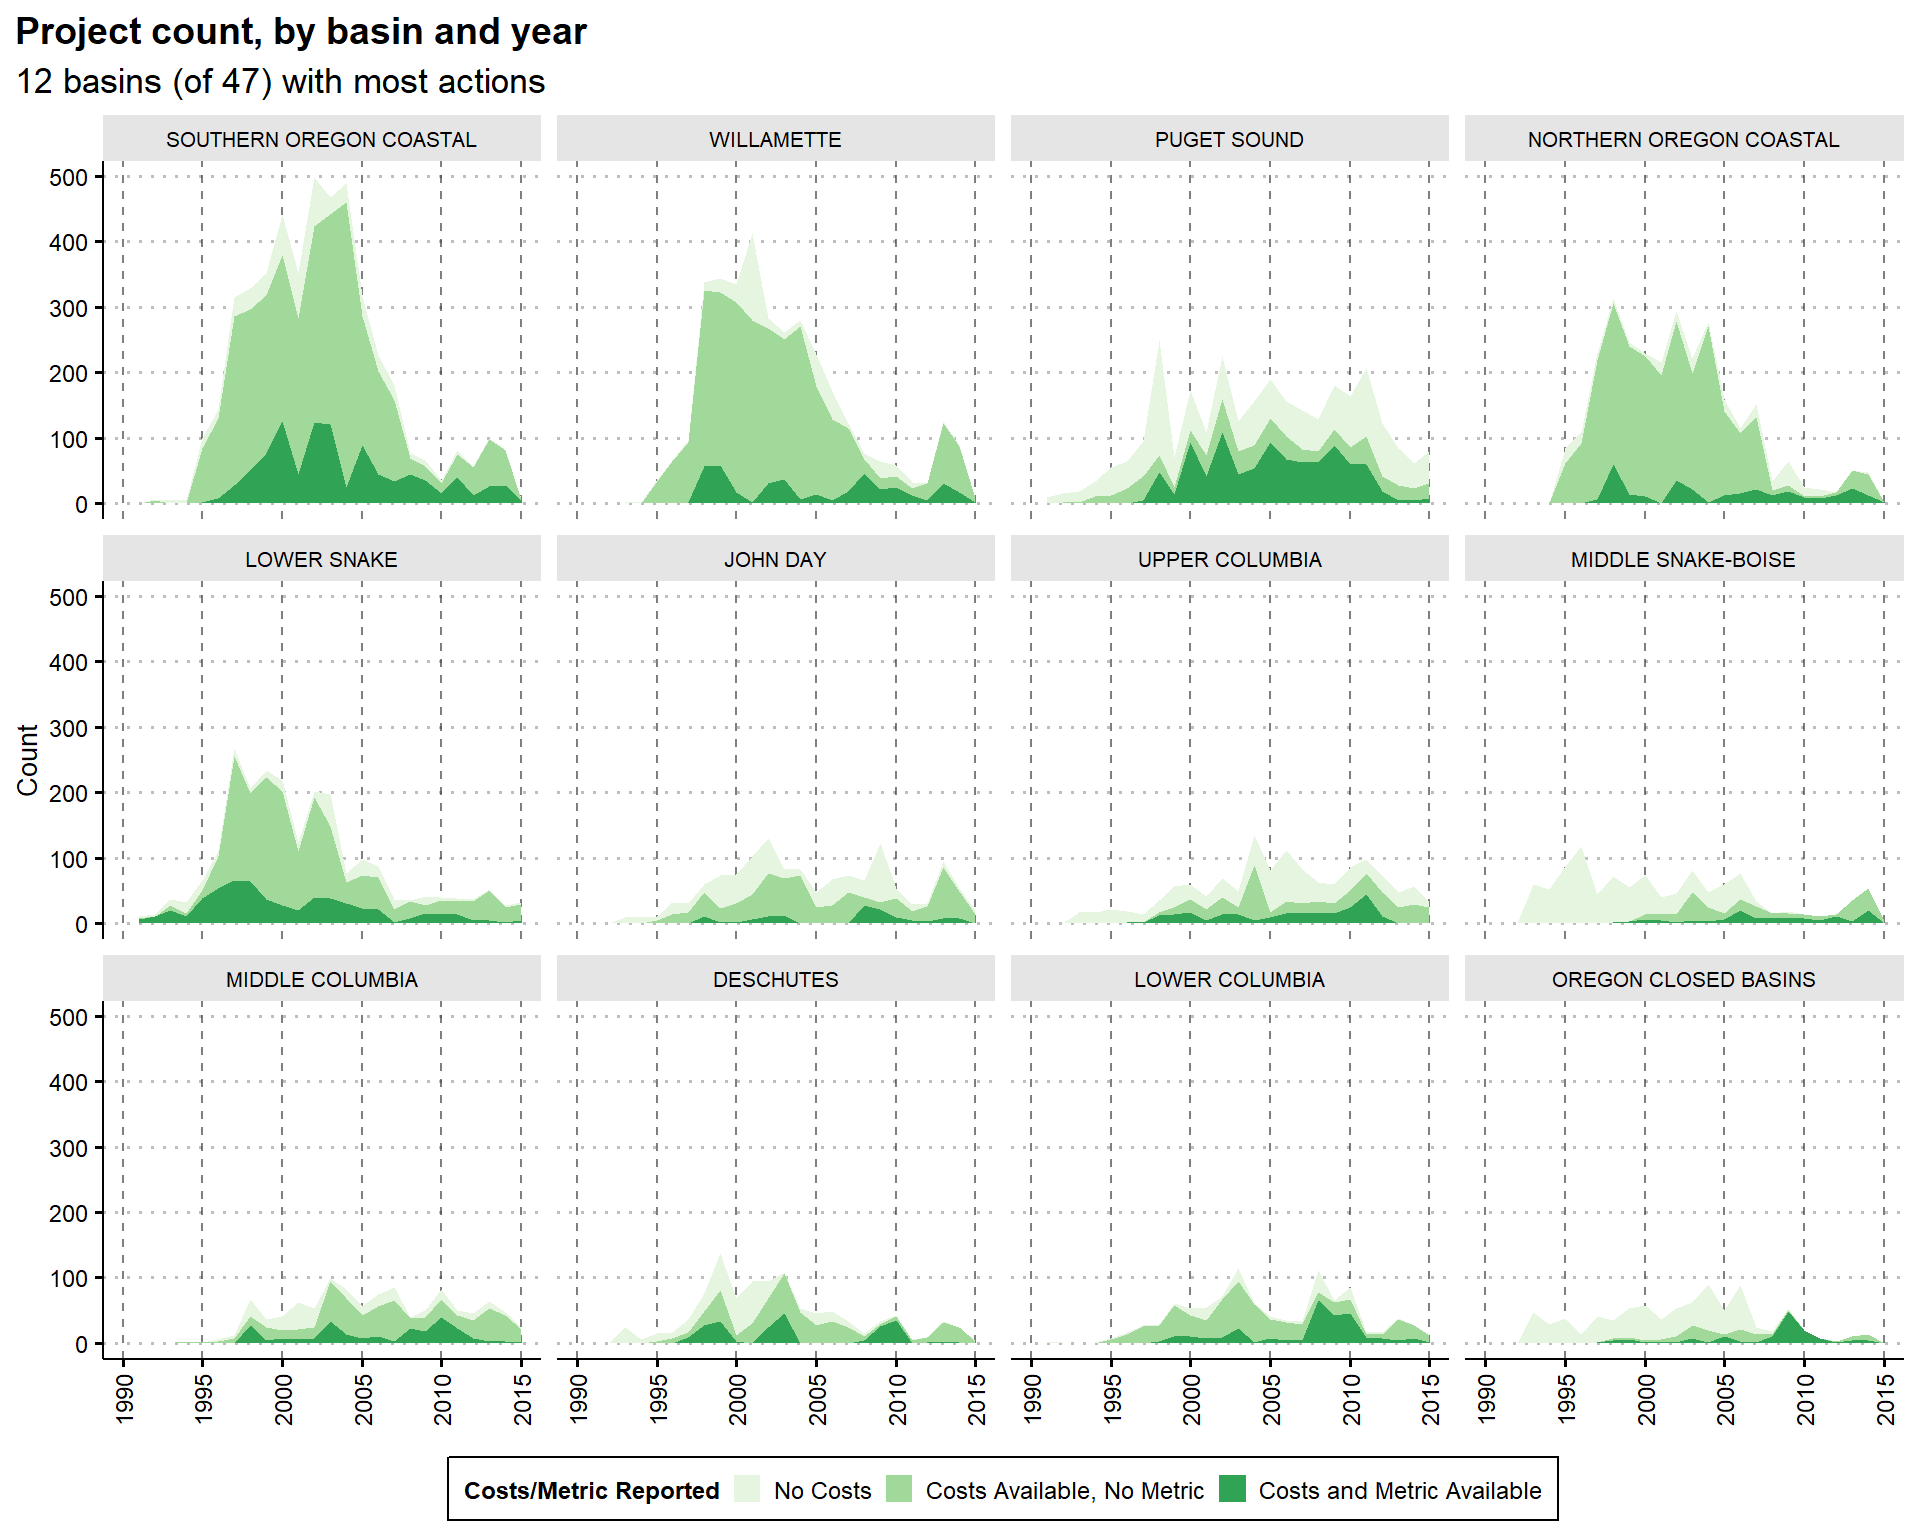
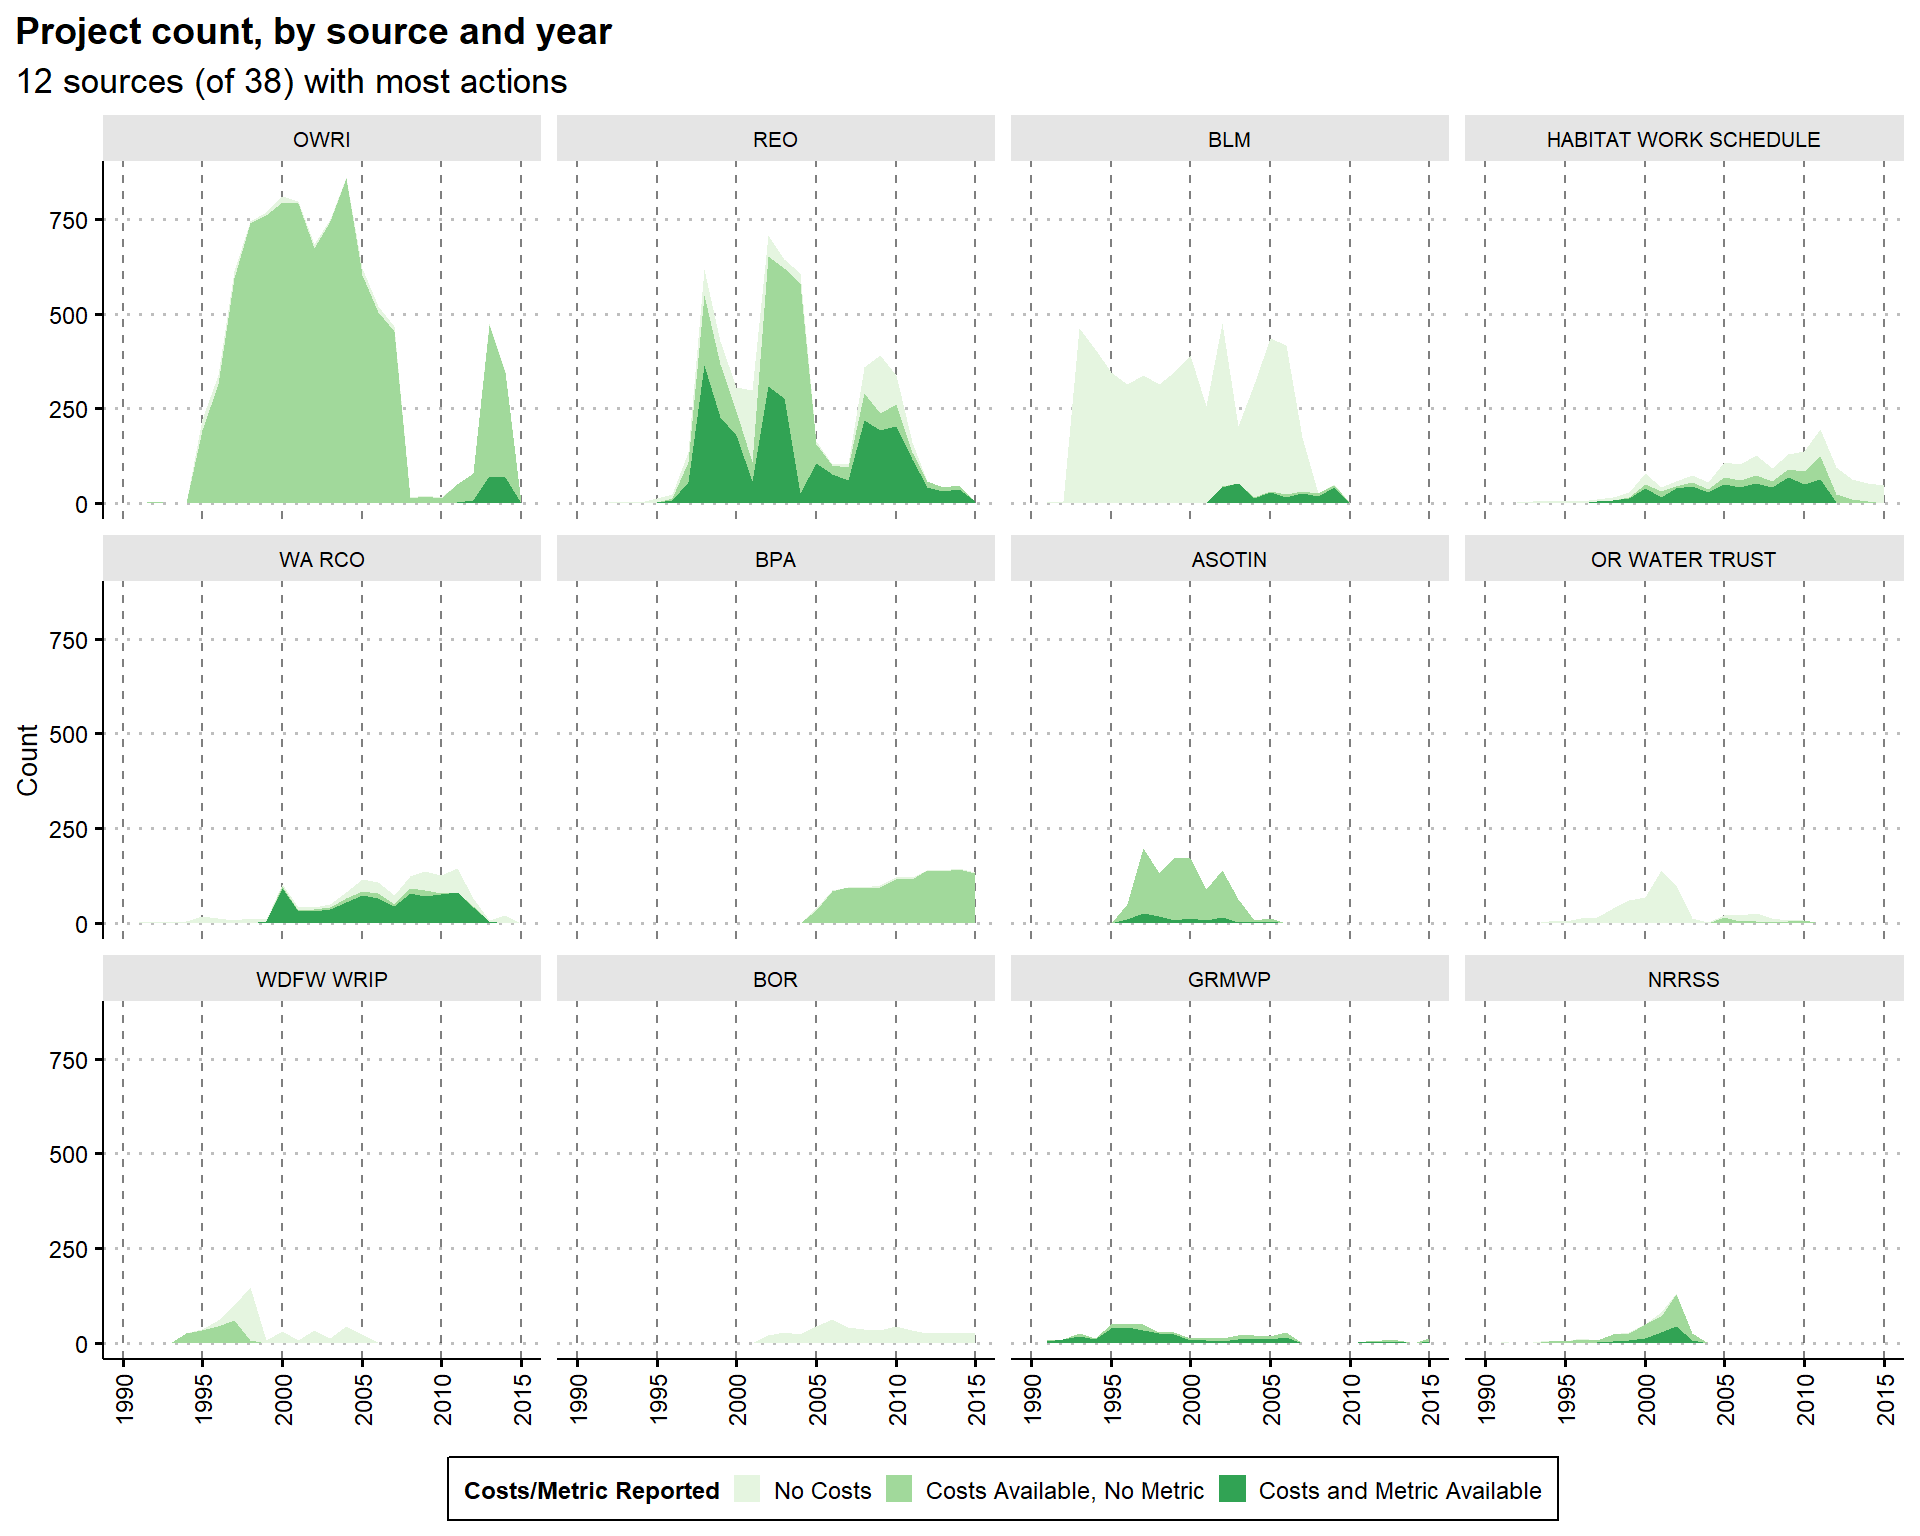
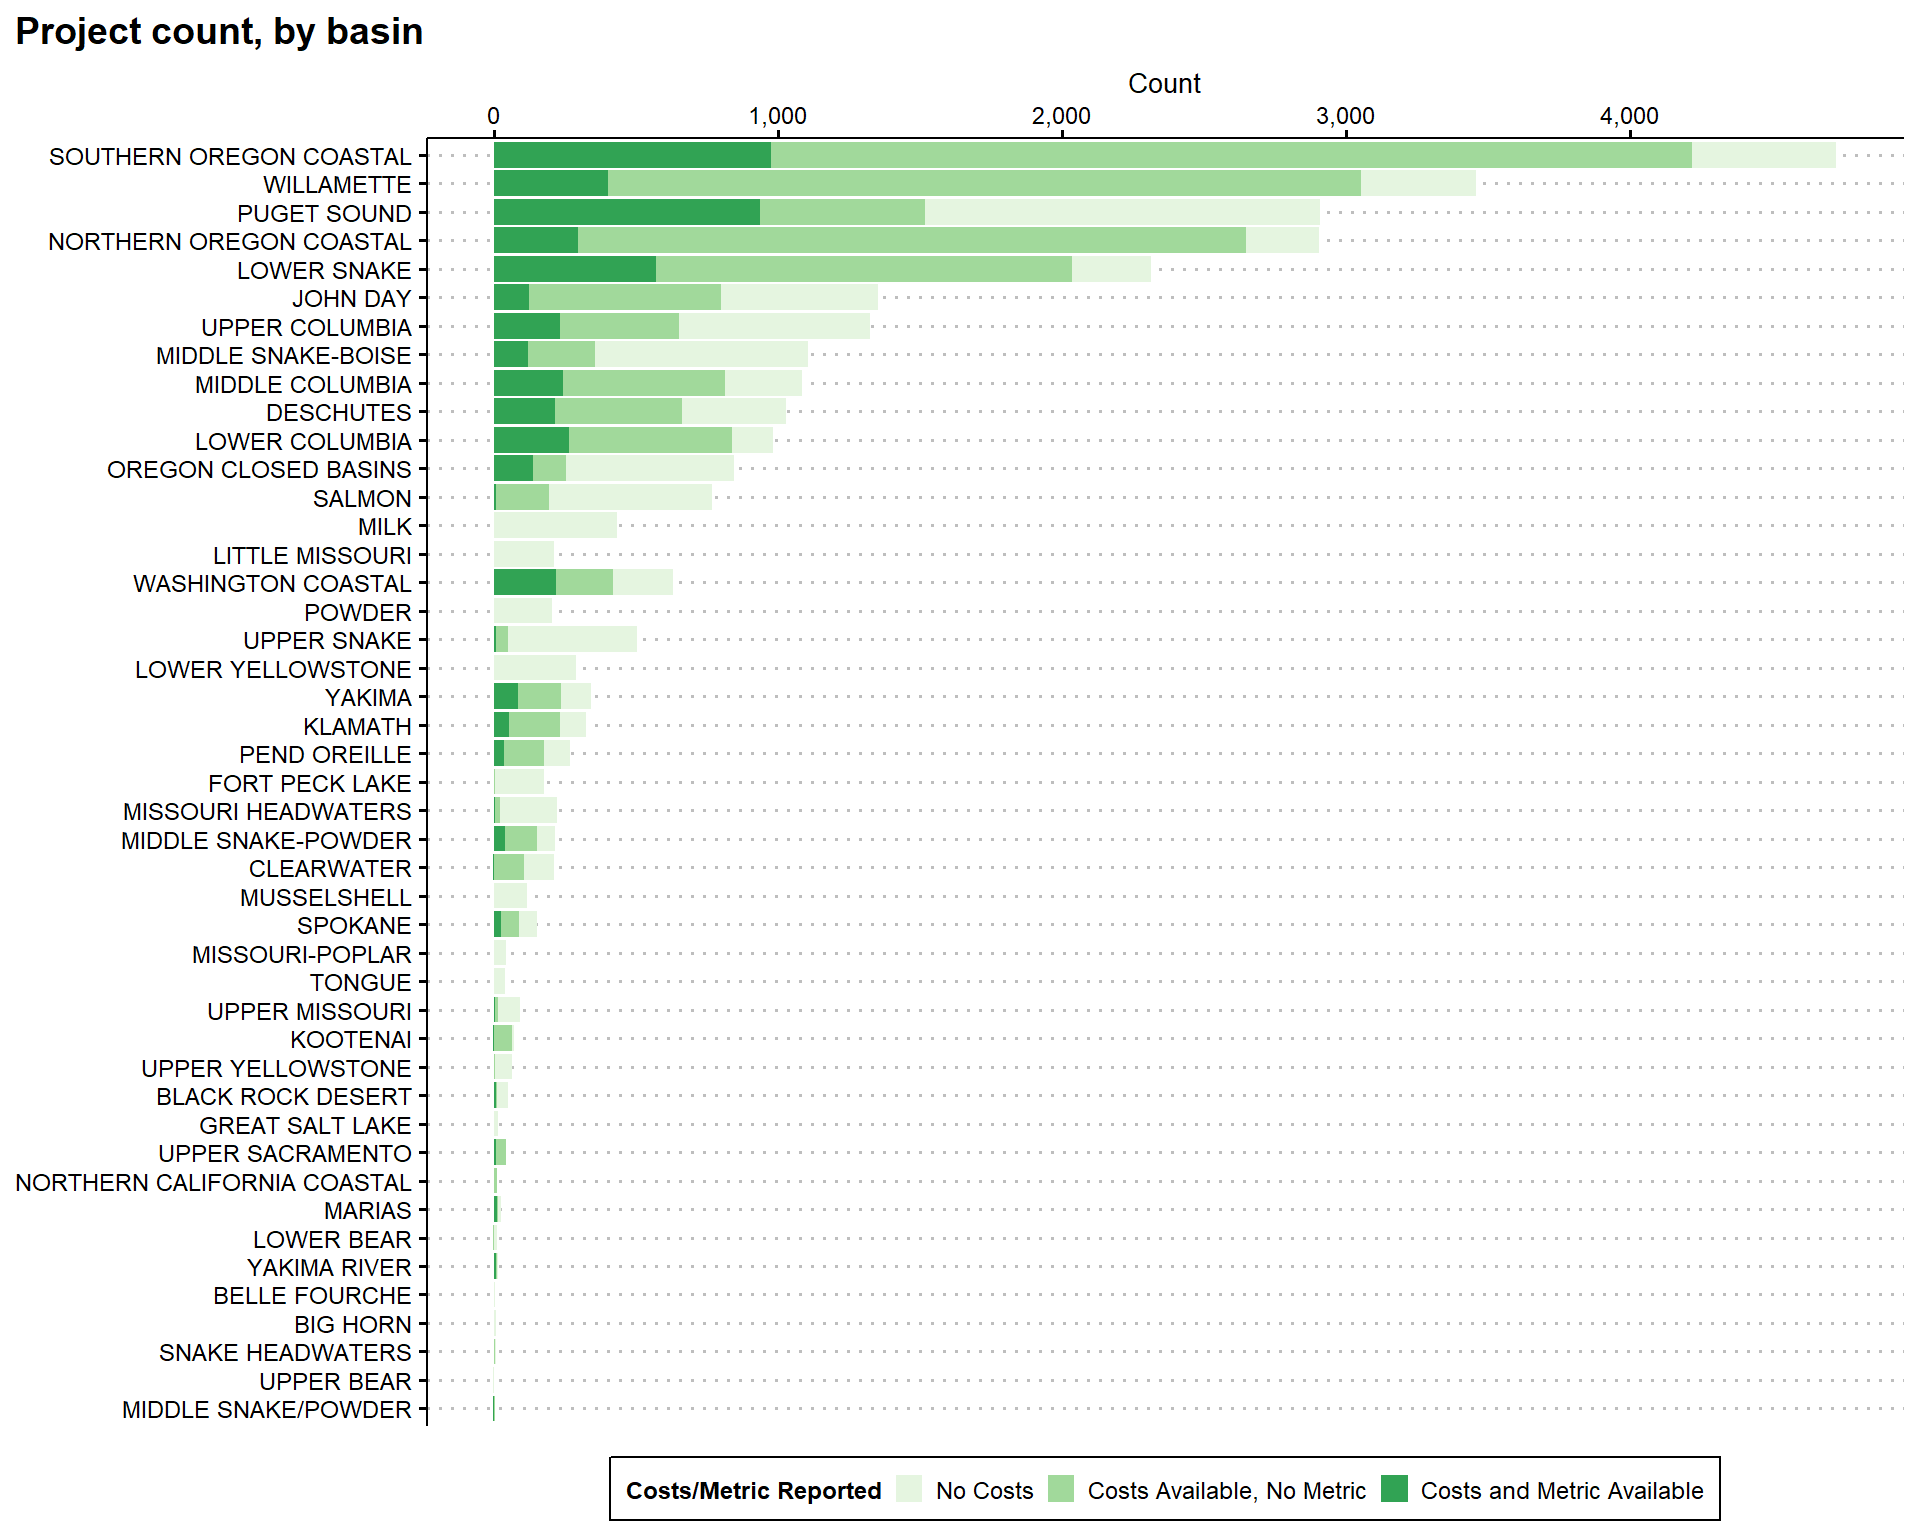
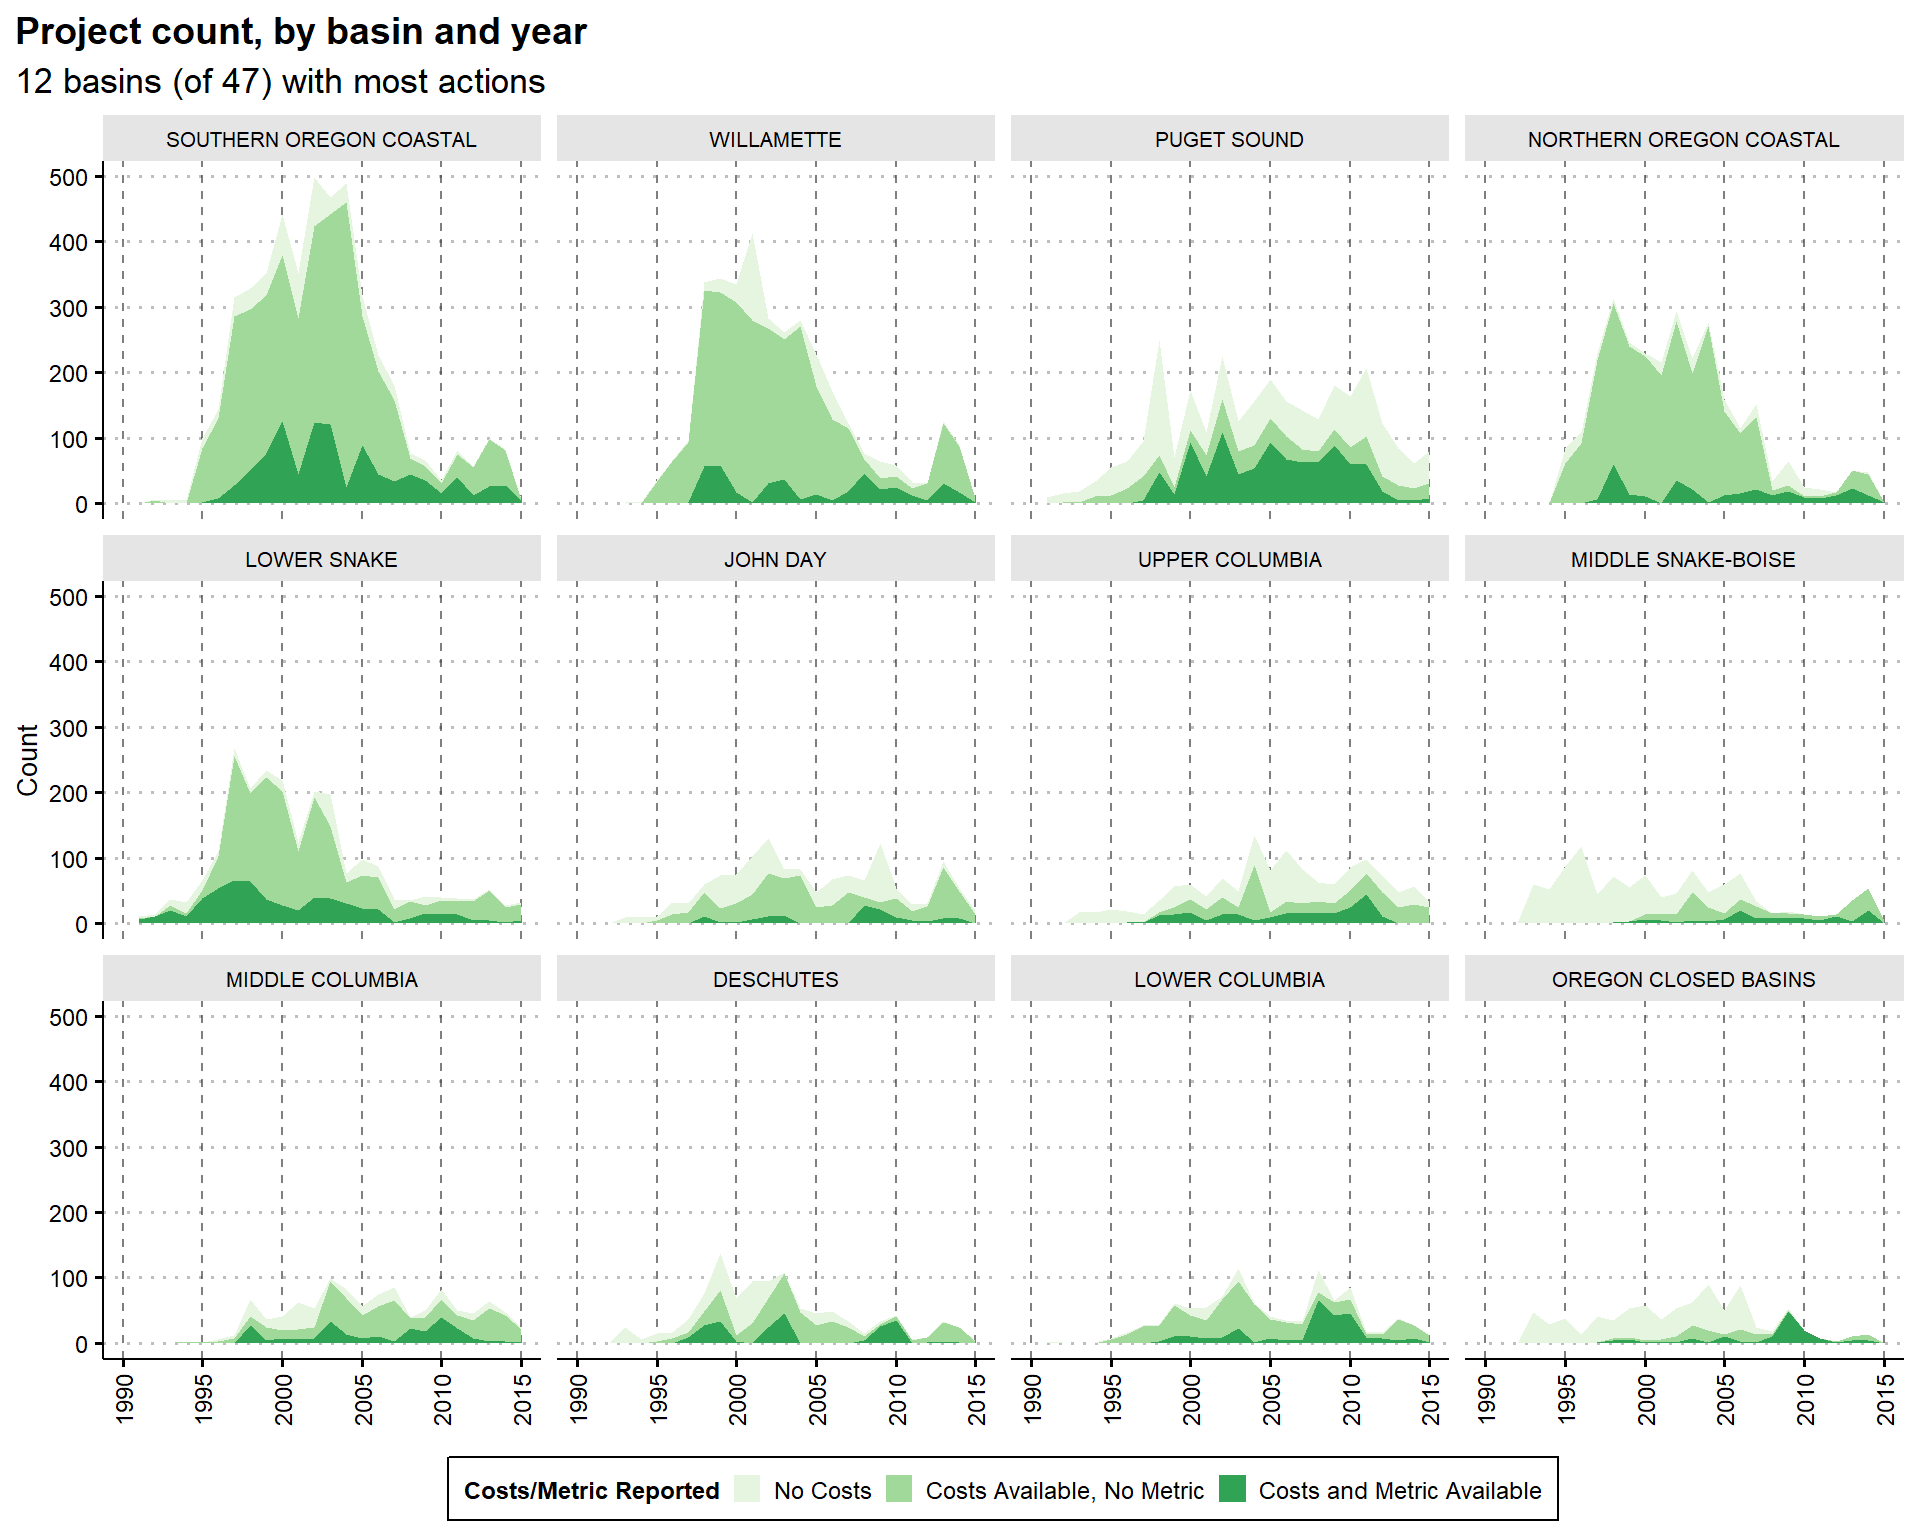
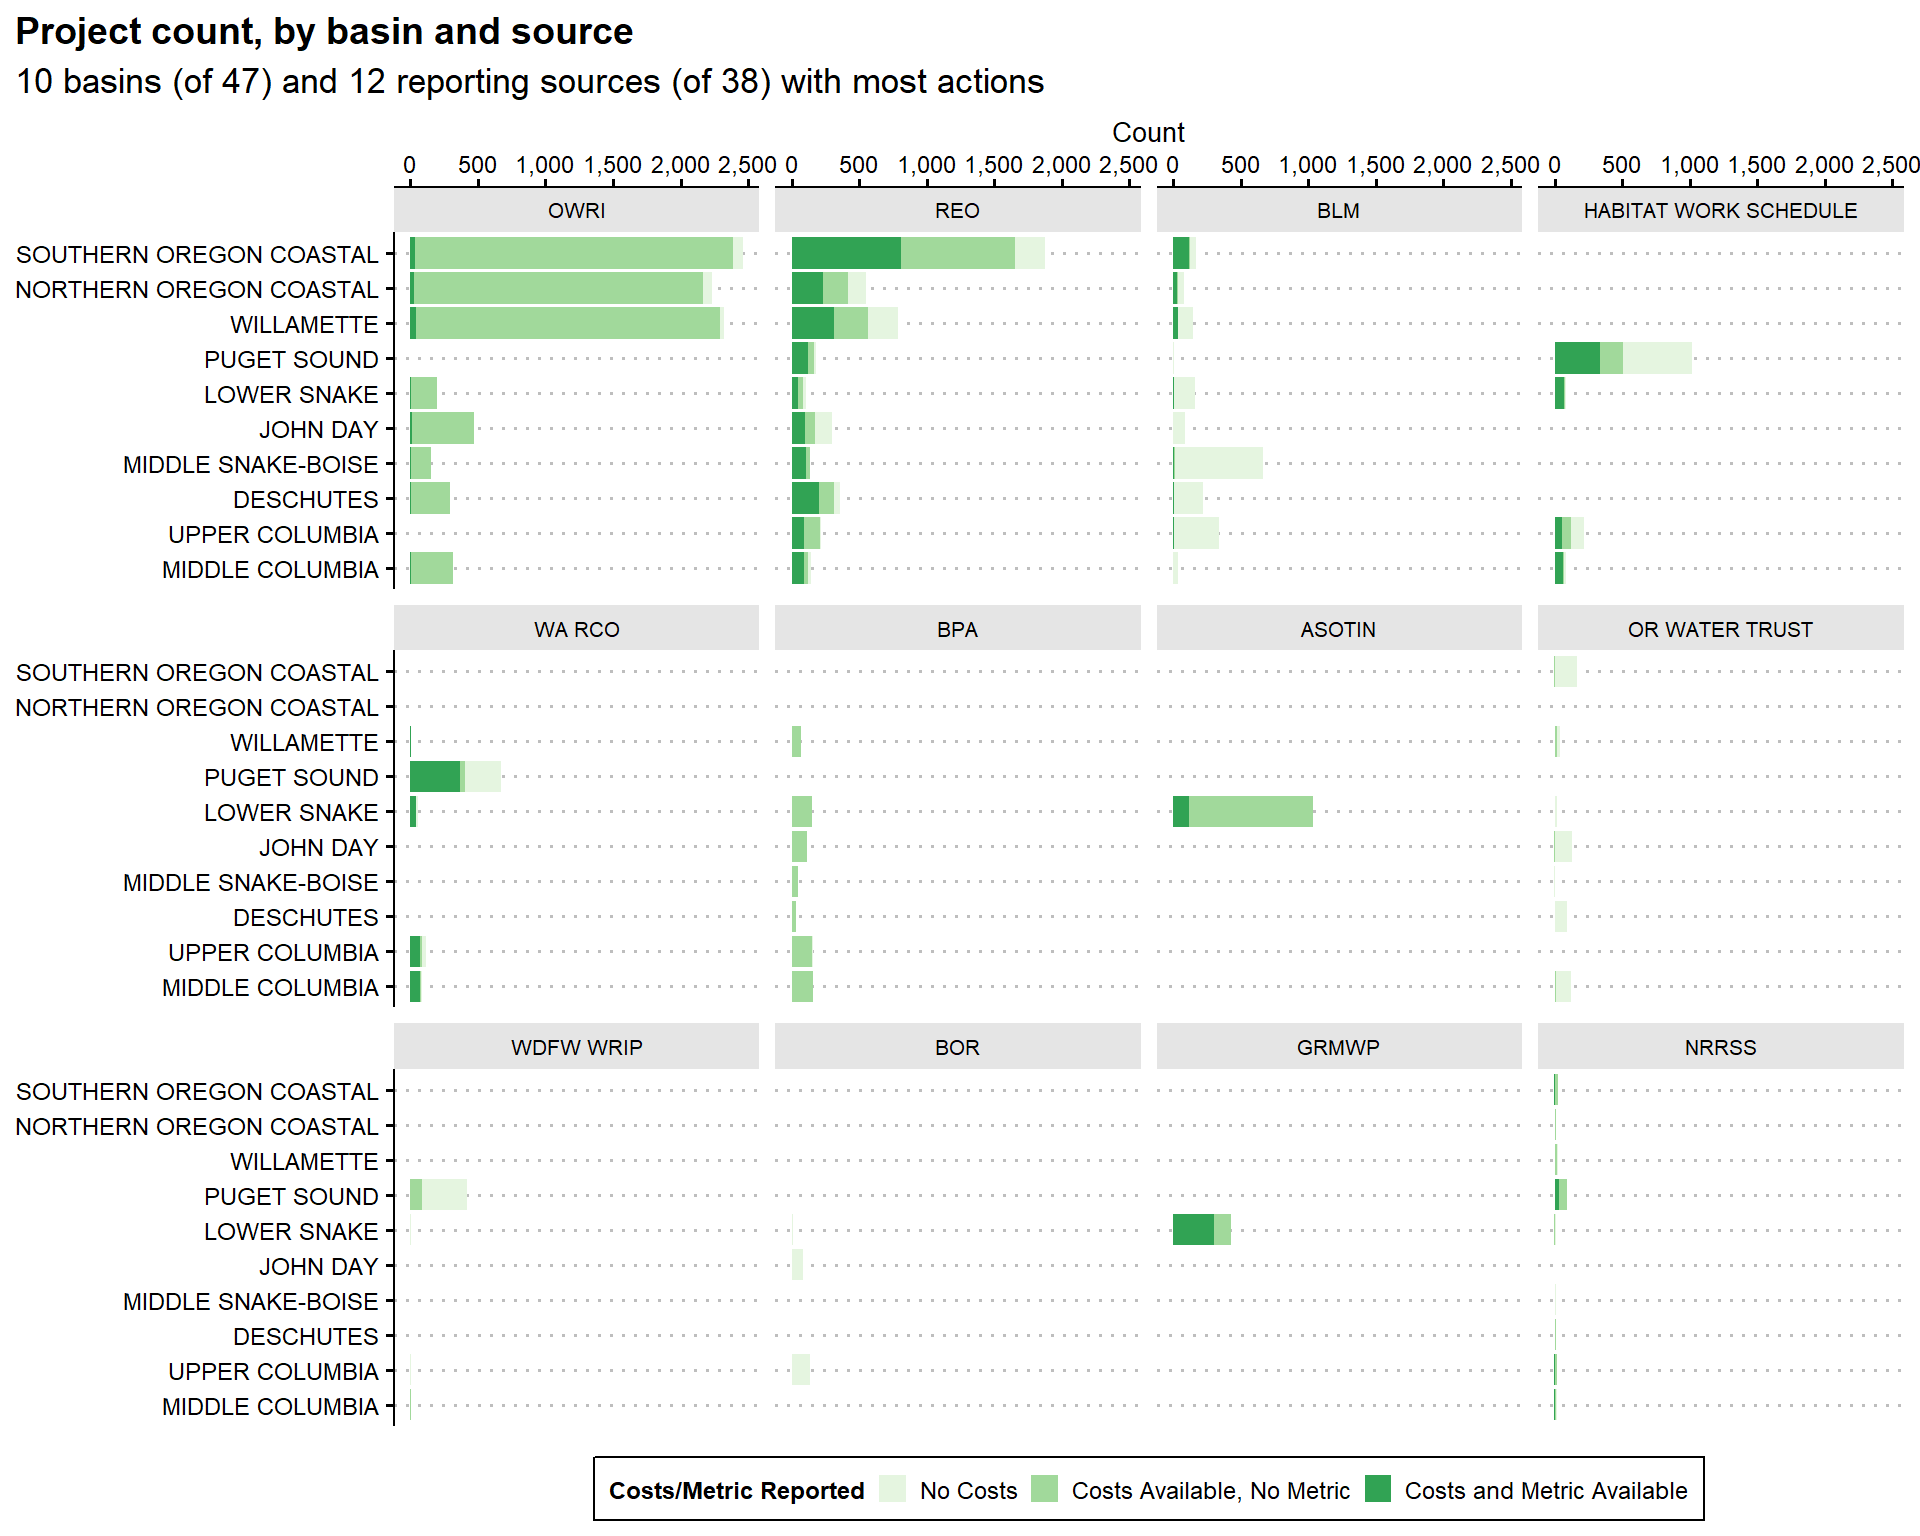
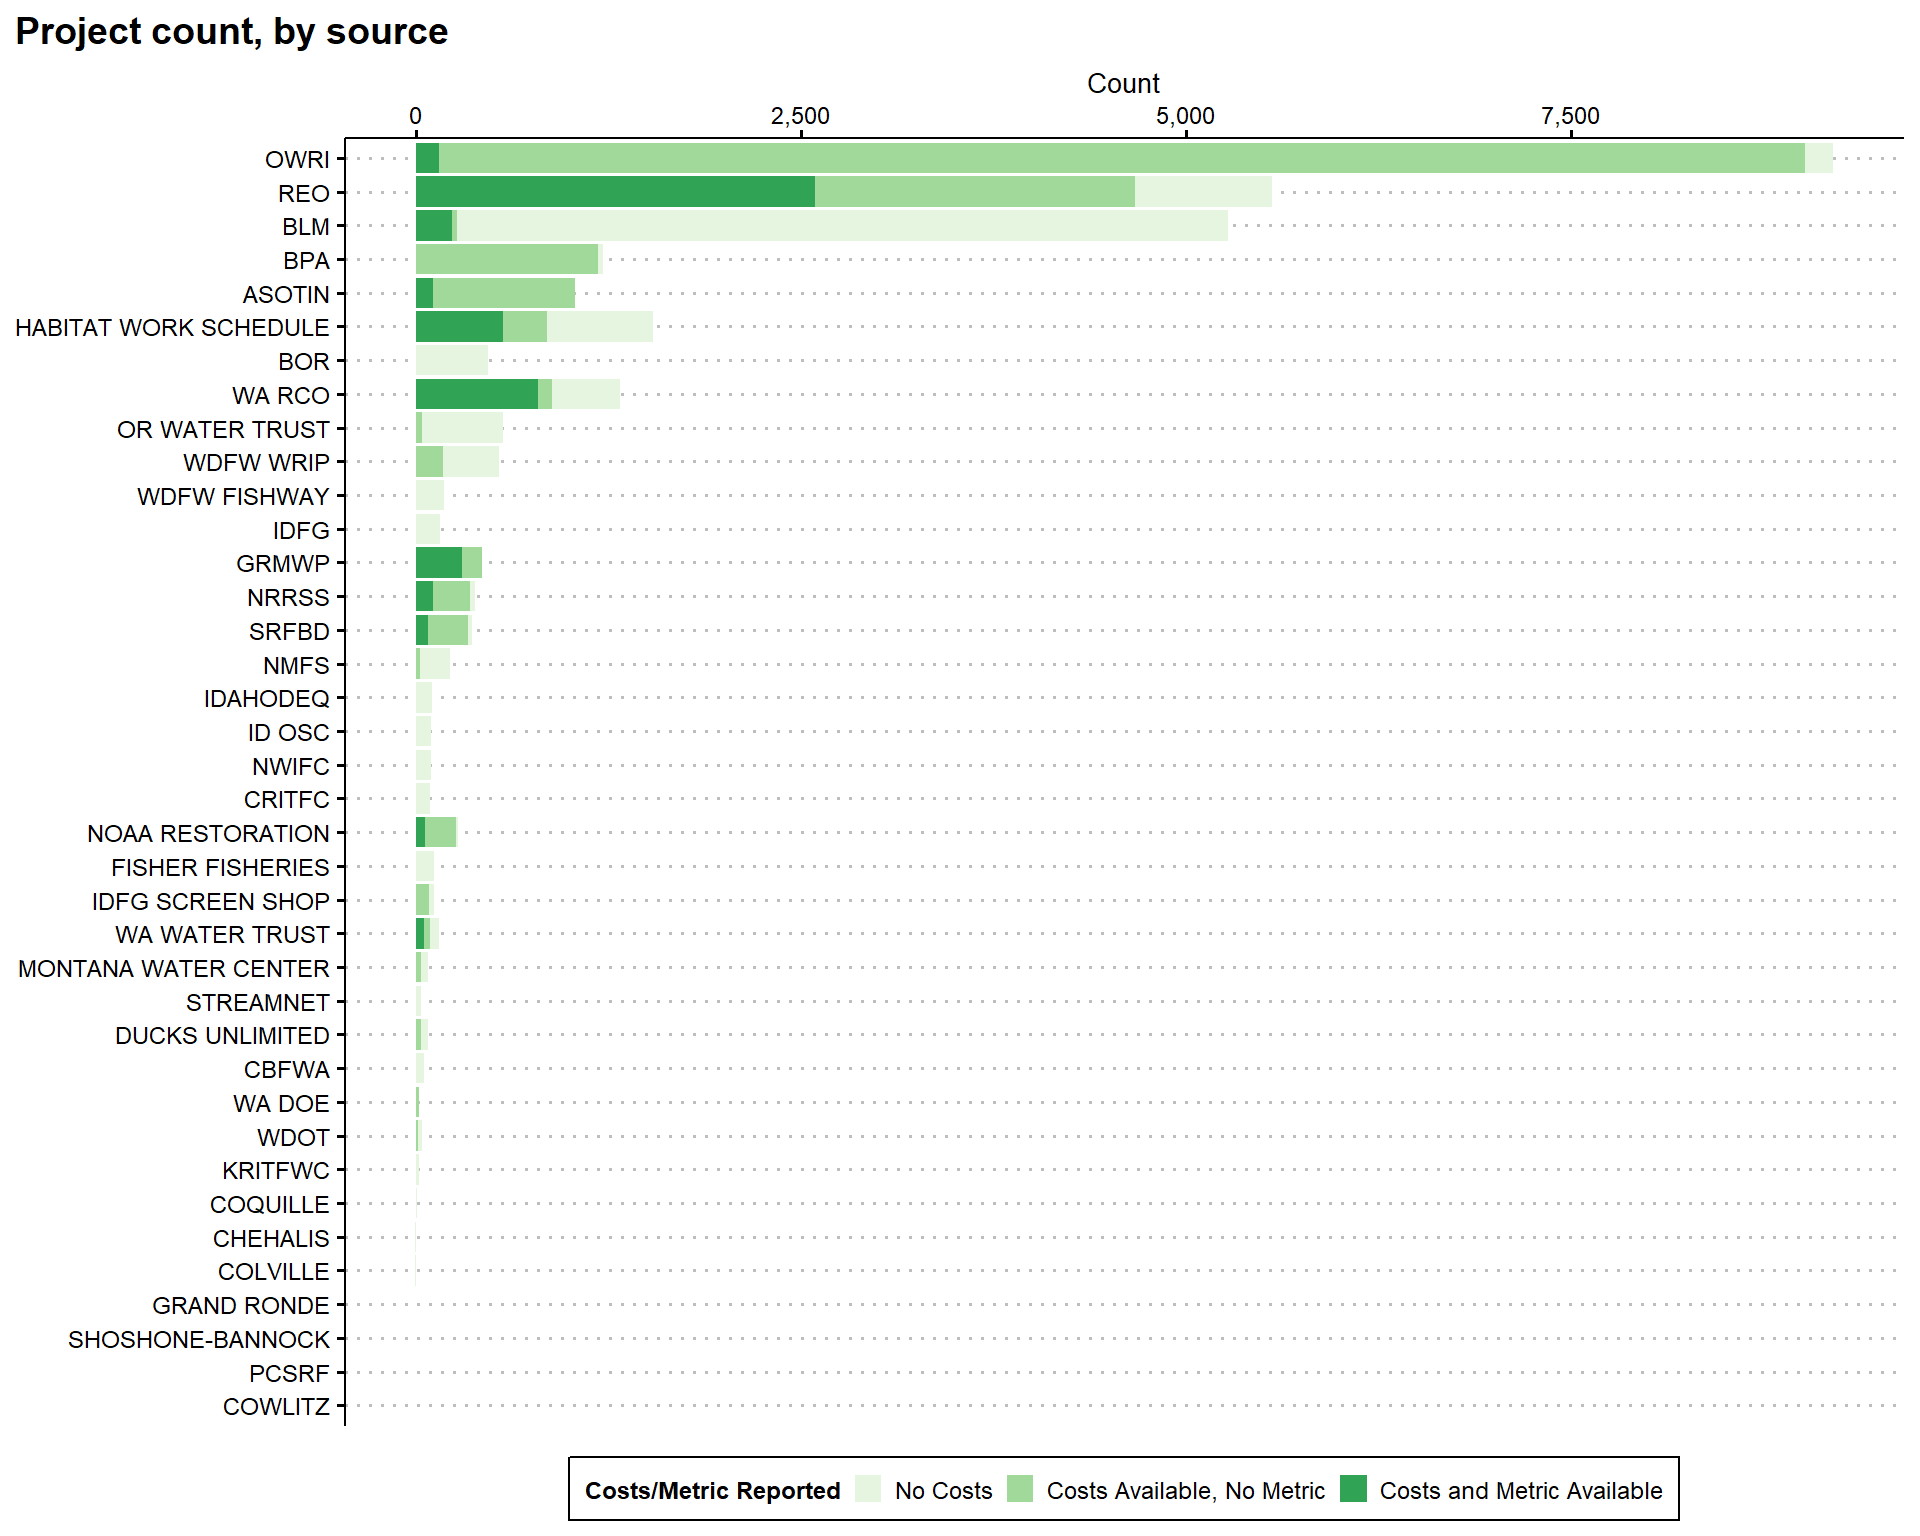
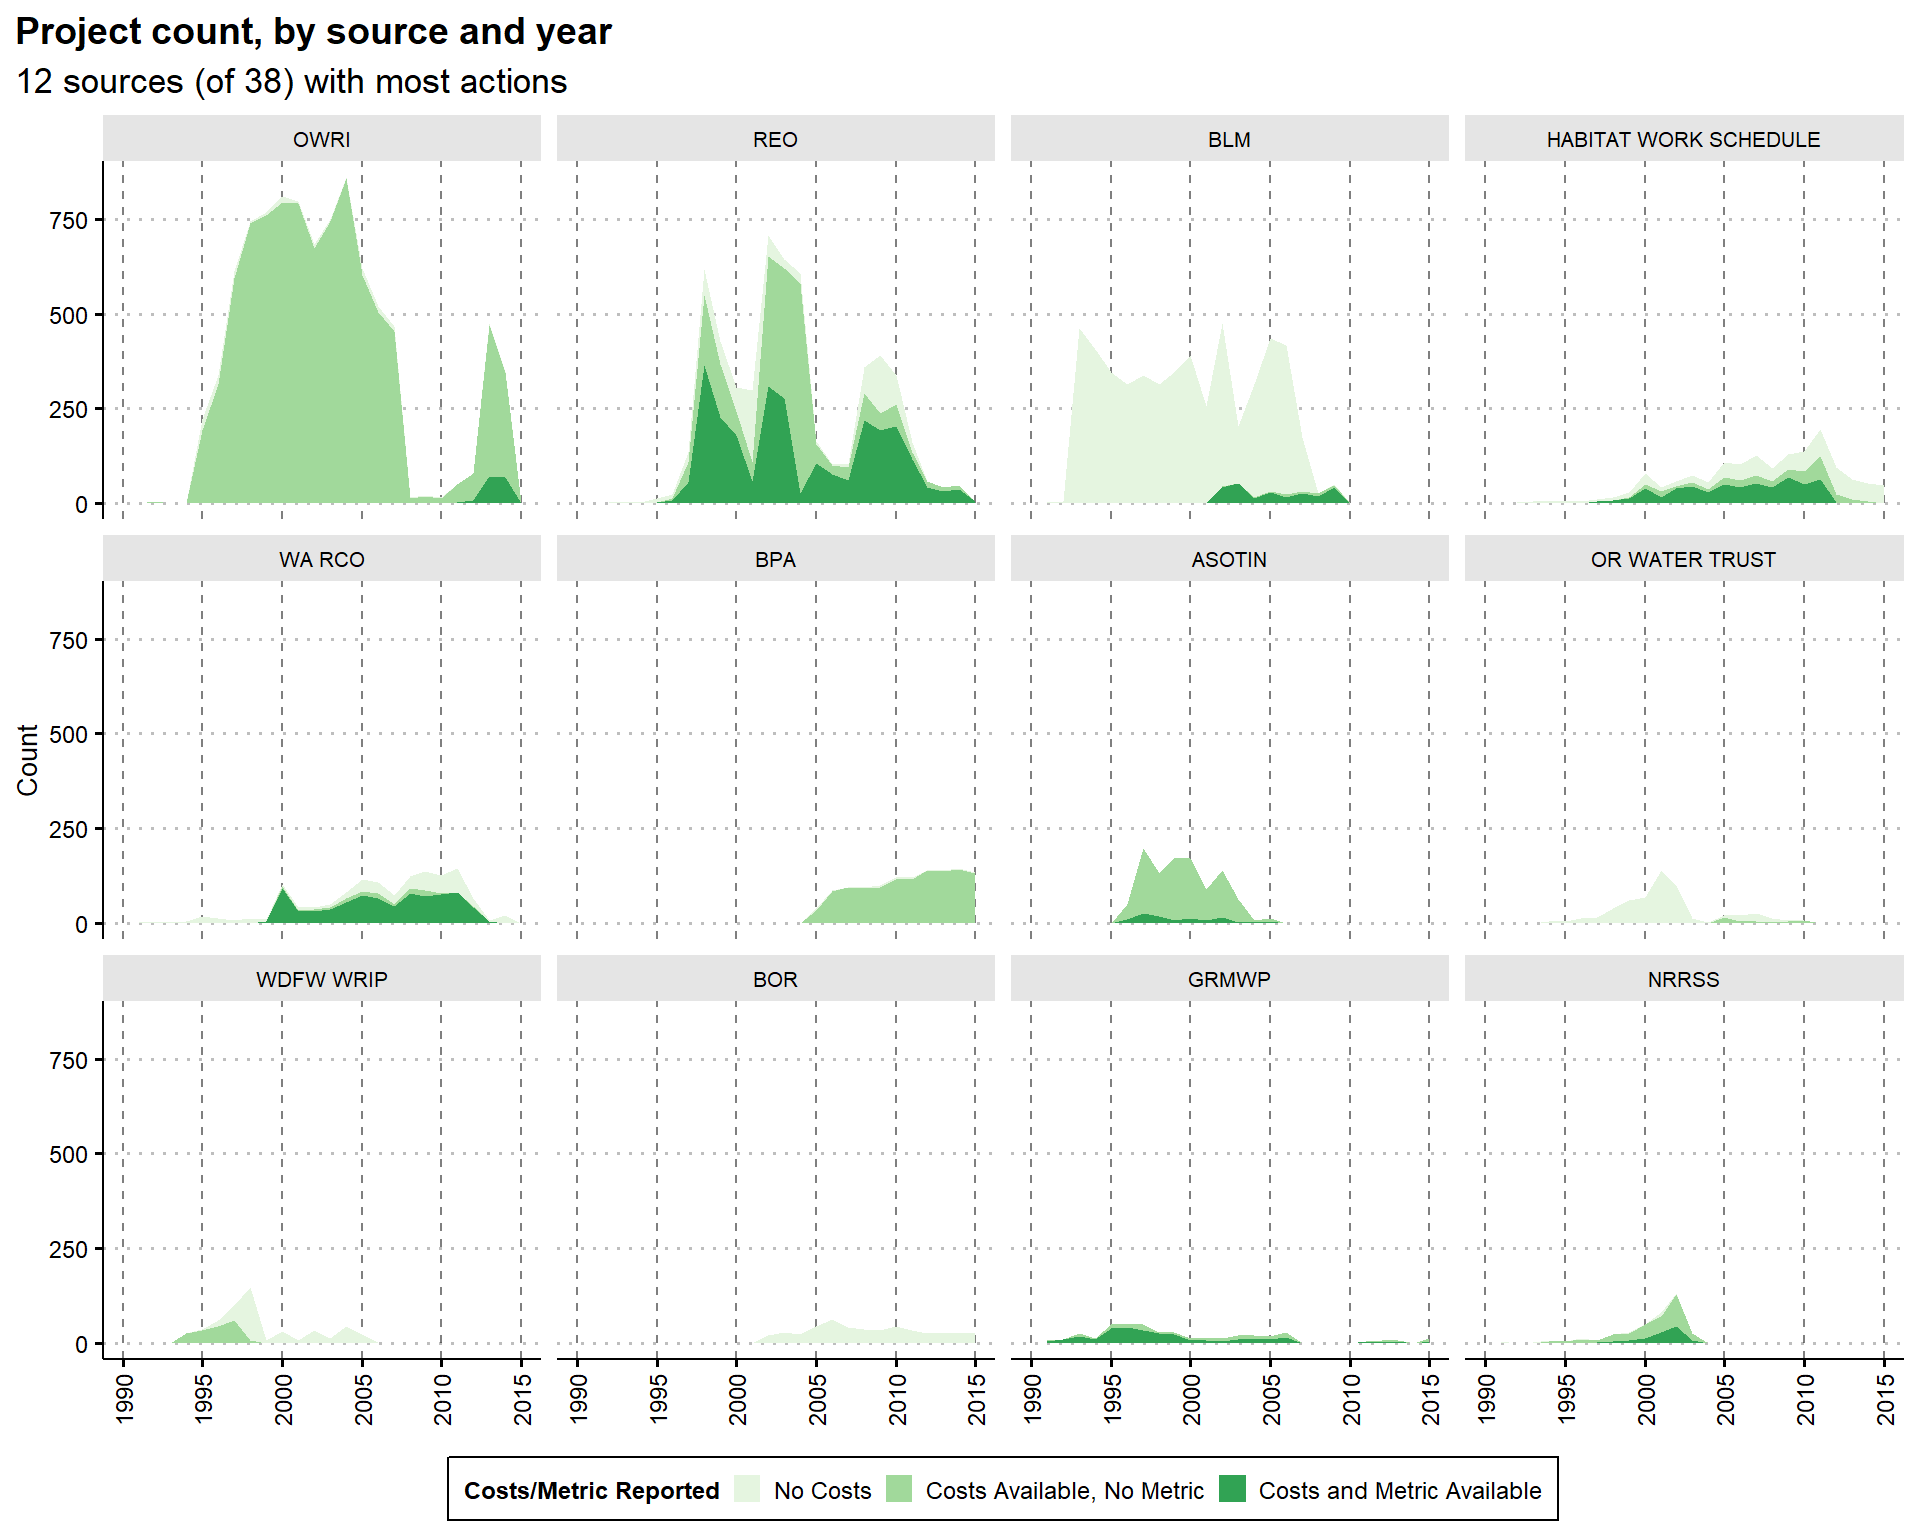
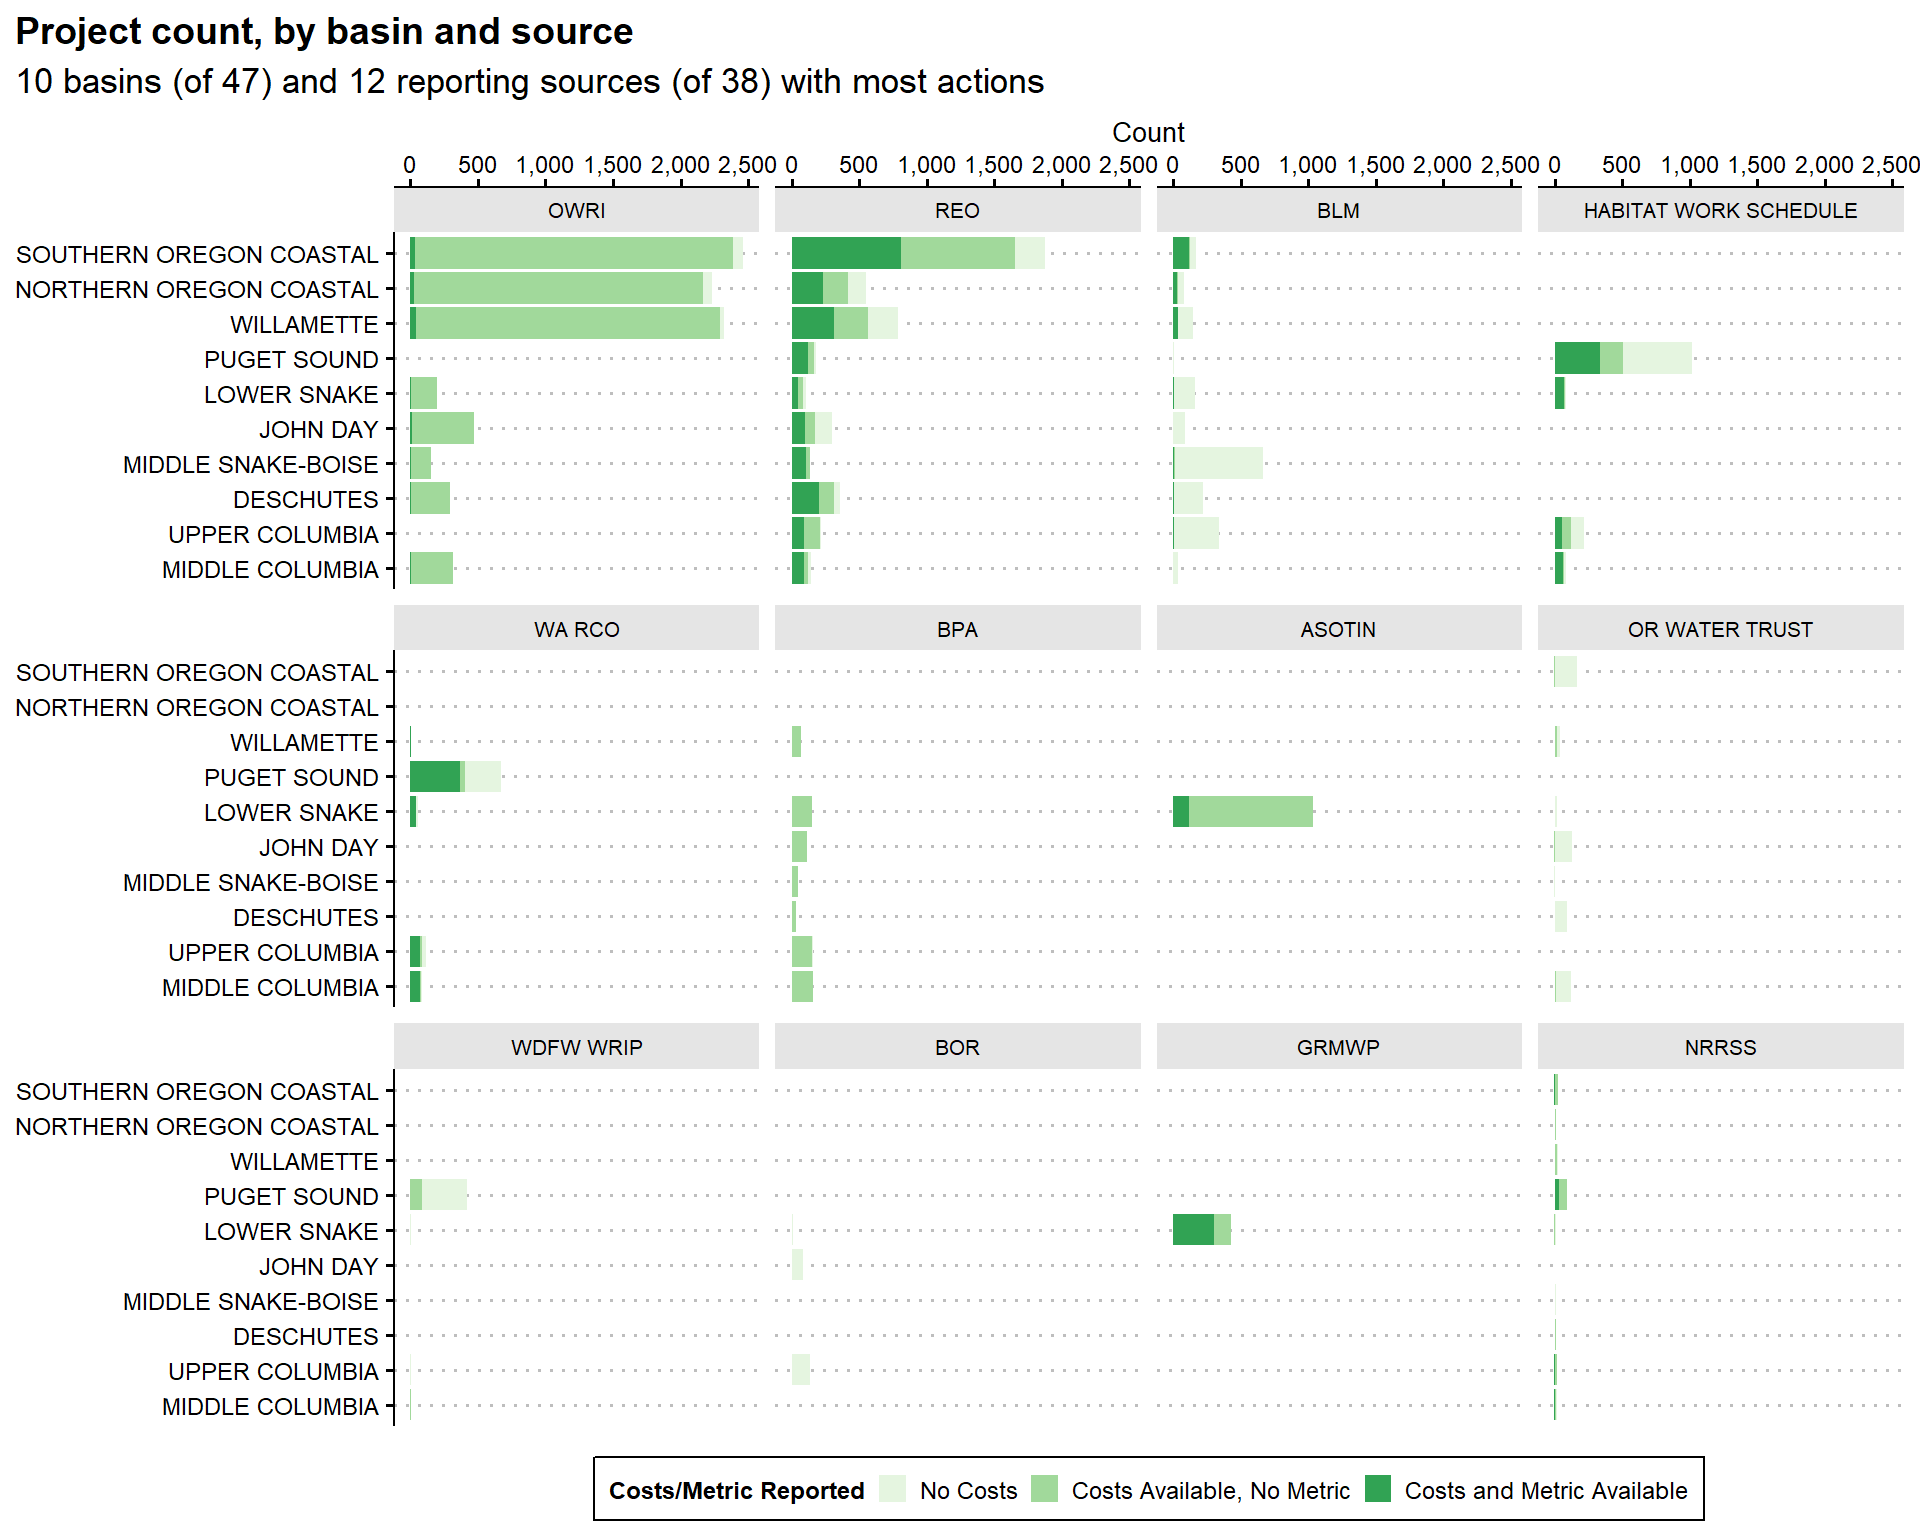
In this section, I visualize the number of actions in the PNSHP data set by (a) action type, (b) year, (c) basin, and (d) source (and cross-tabulations). Counts of projects are also presented by (a) year, (b) basin, and (c) source (and cross-tabulations). These figures illustrate trends in project and action quantity over time and differences in actions taken across space, while also highlighting potential differences in reporting across different sources and regions.
I also include a breakdown of project cost and metric availability to demonstrate where there might be opportunities to reliably model costs and highlight potential data gaps. In order to calculate figures like “cost per acre treated” or “cost per stream mile”, both cost and metric will be needed.
Count Figures
Counts of Actions
By Year
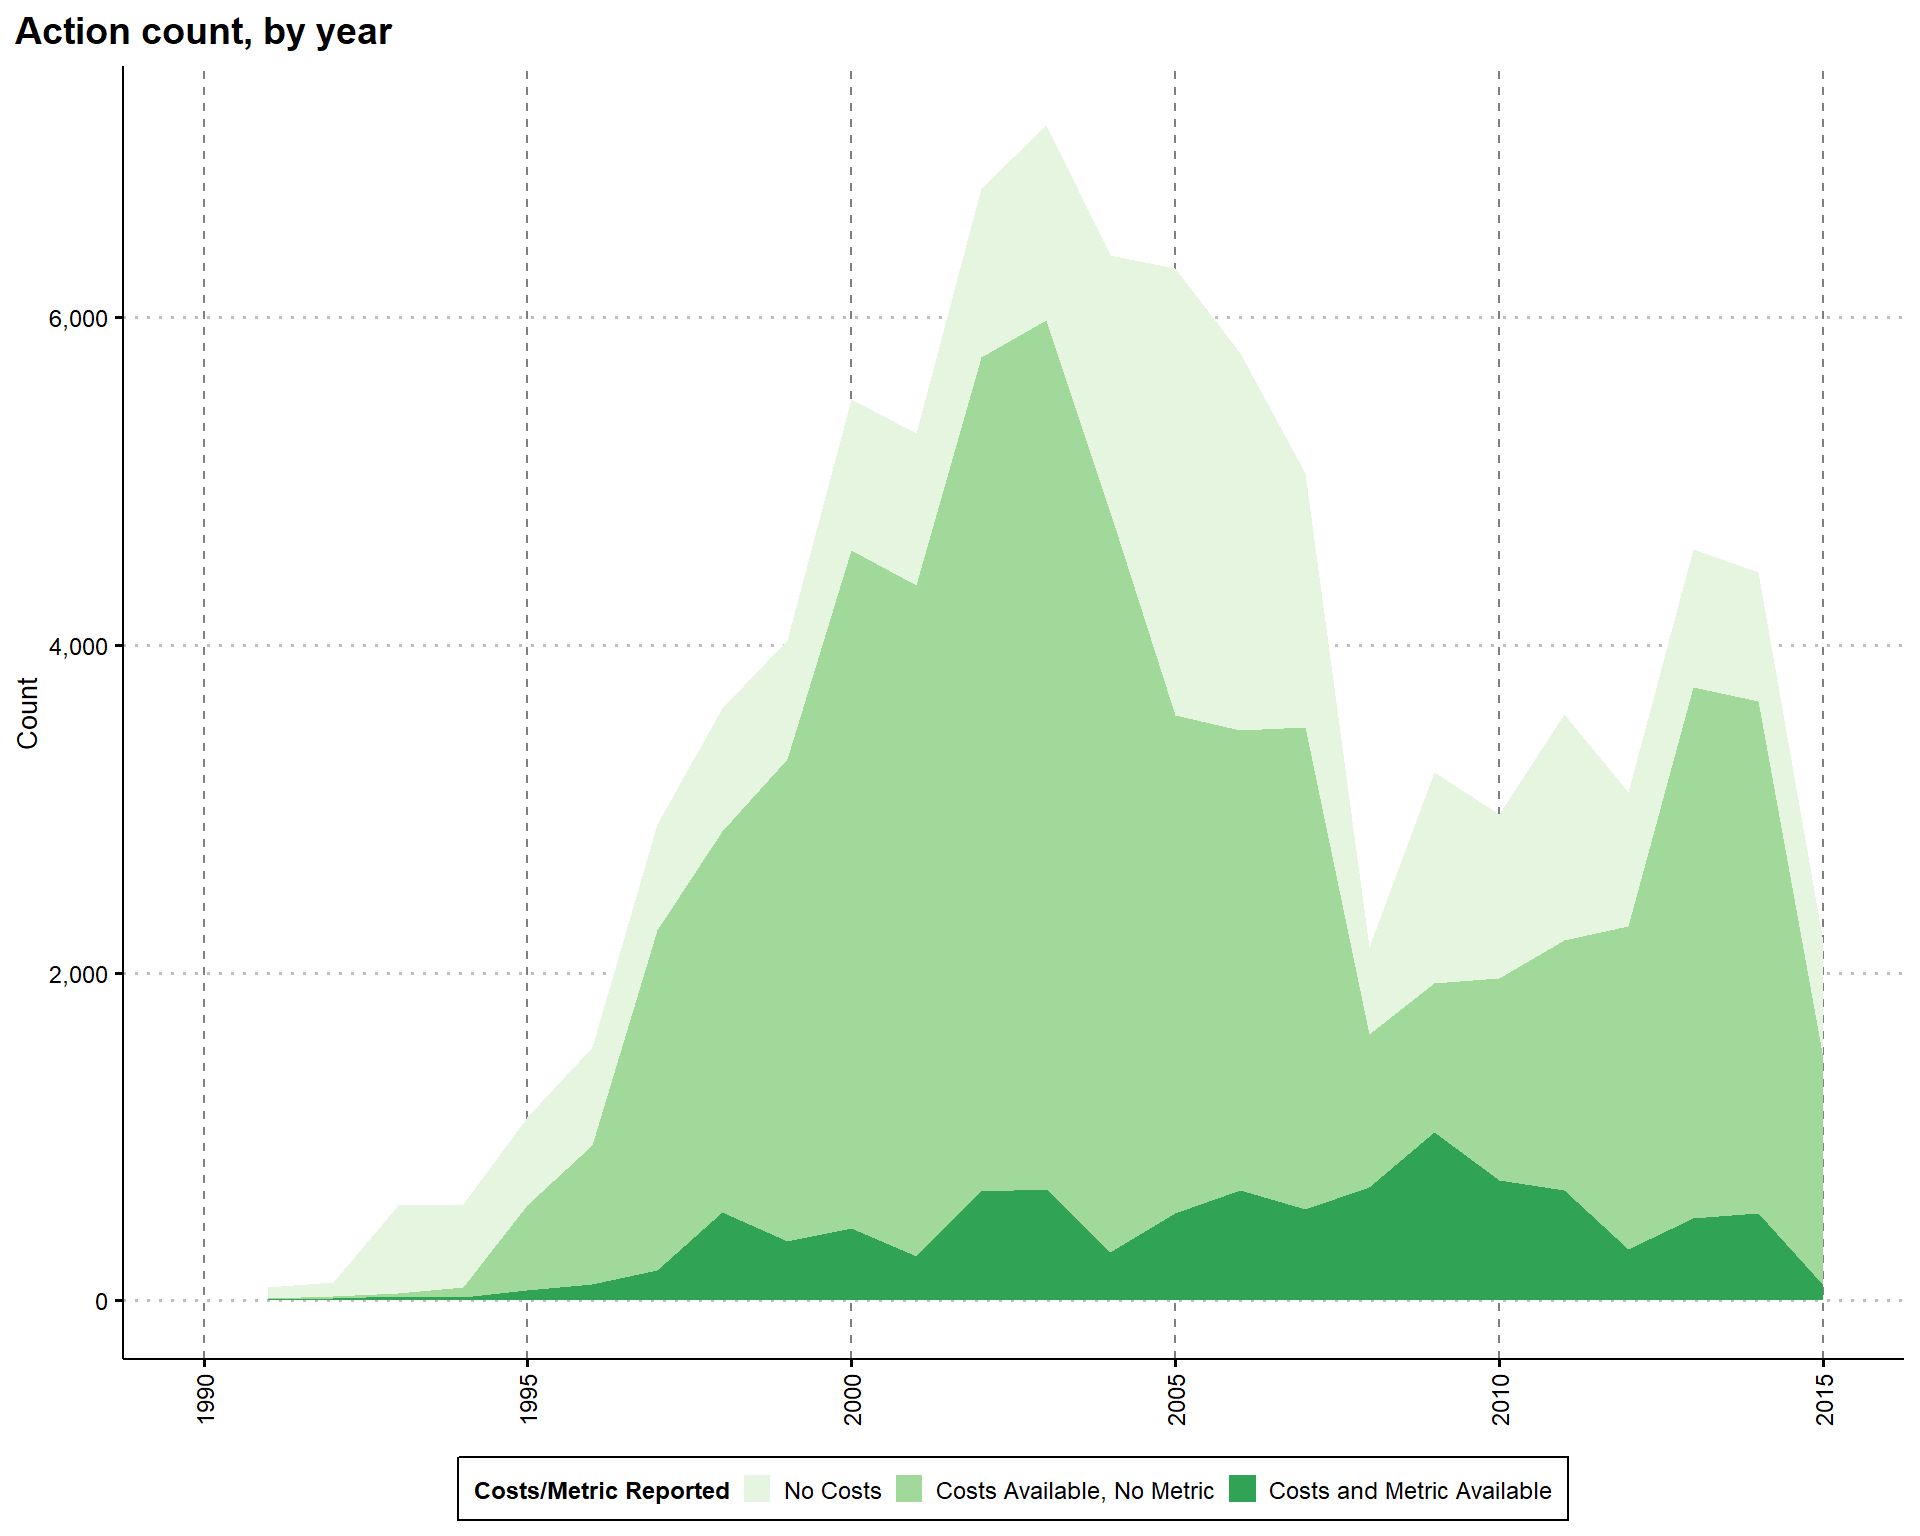
Observation: Both the number of projects and the number of actions peak in the early ’00s. The number of actions and projects collapses during the recession, likely due to a lack of funding. The number of projects per year does not recover to pre-recession levels, while the number of actions does see a bump in the early ’10s, indicating an increase in the number of actions reported per project.
By Action Type
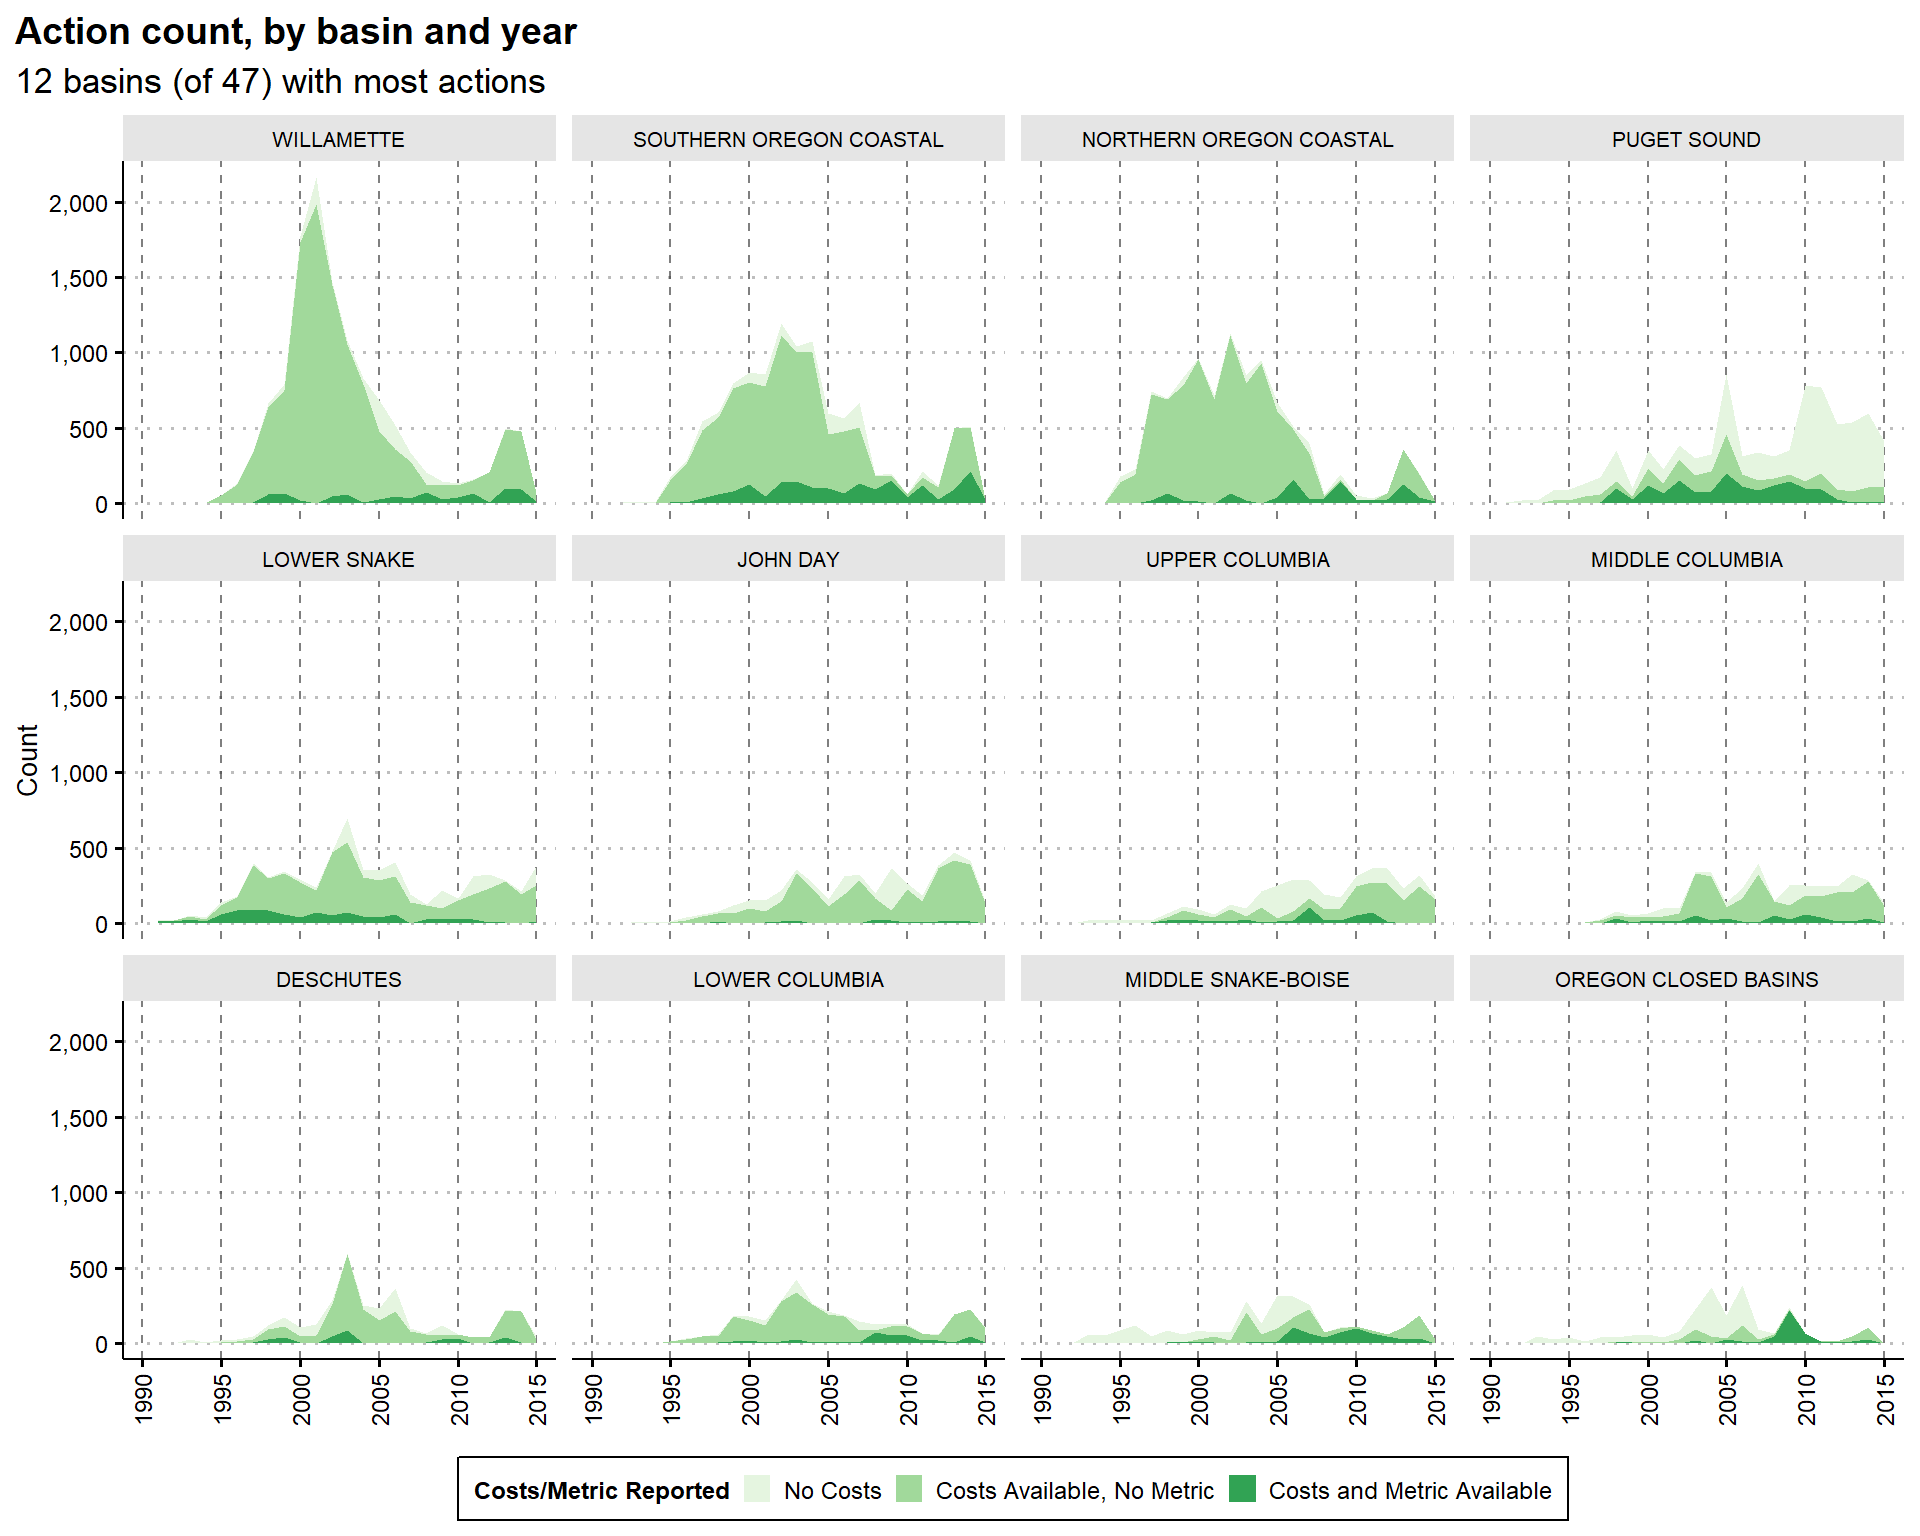
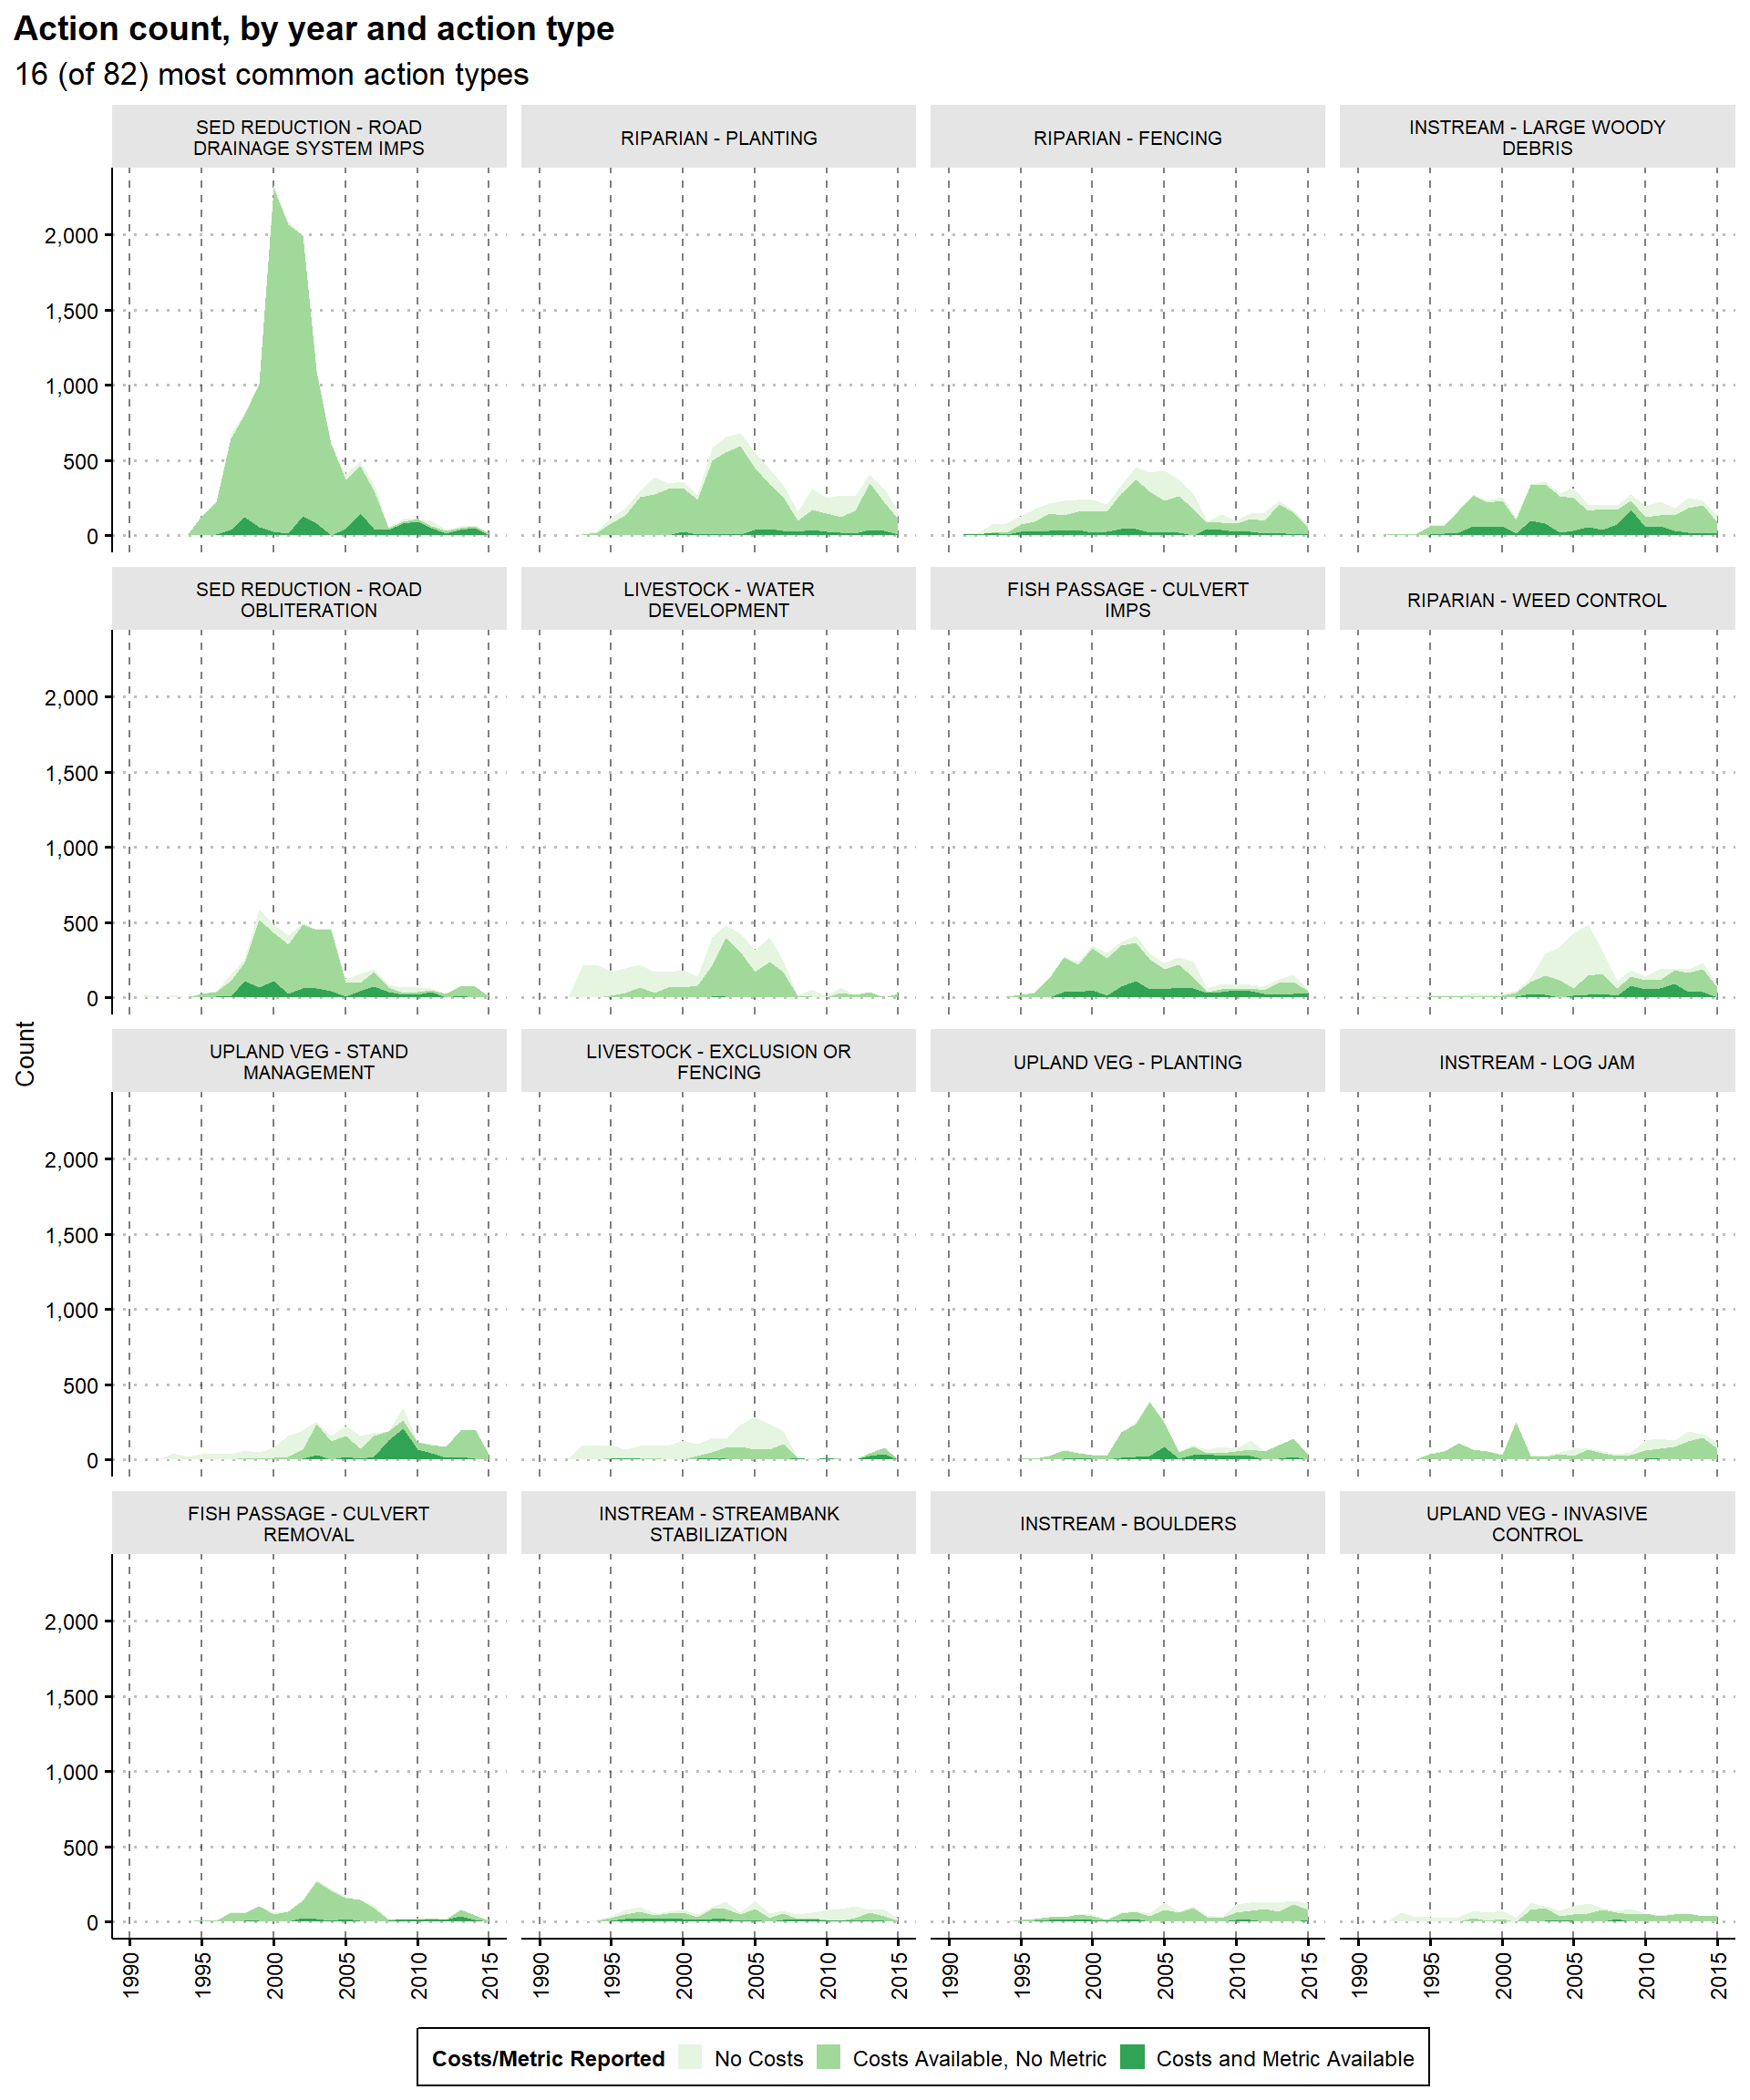
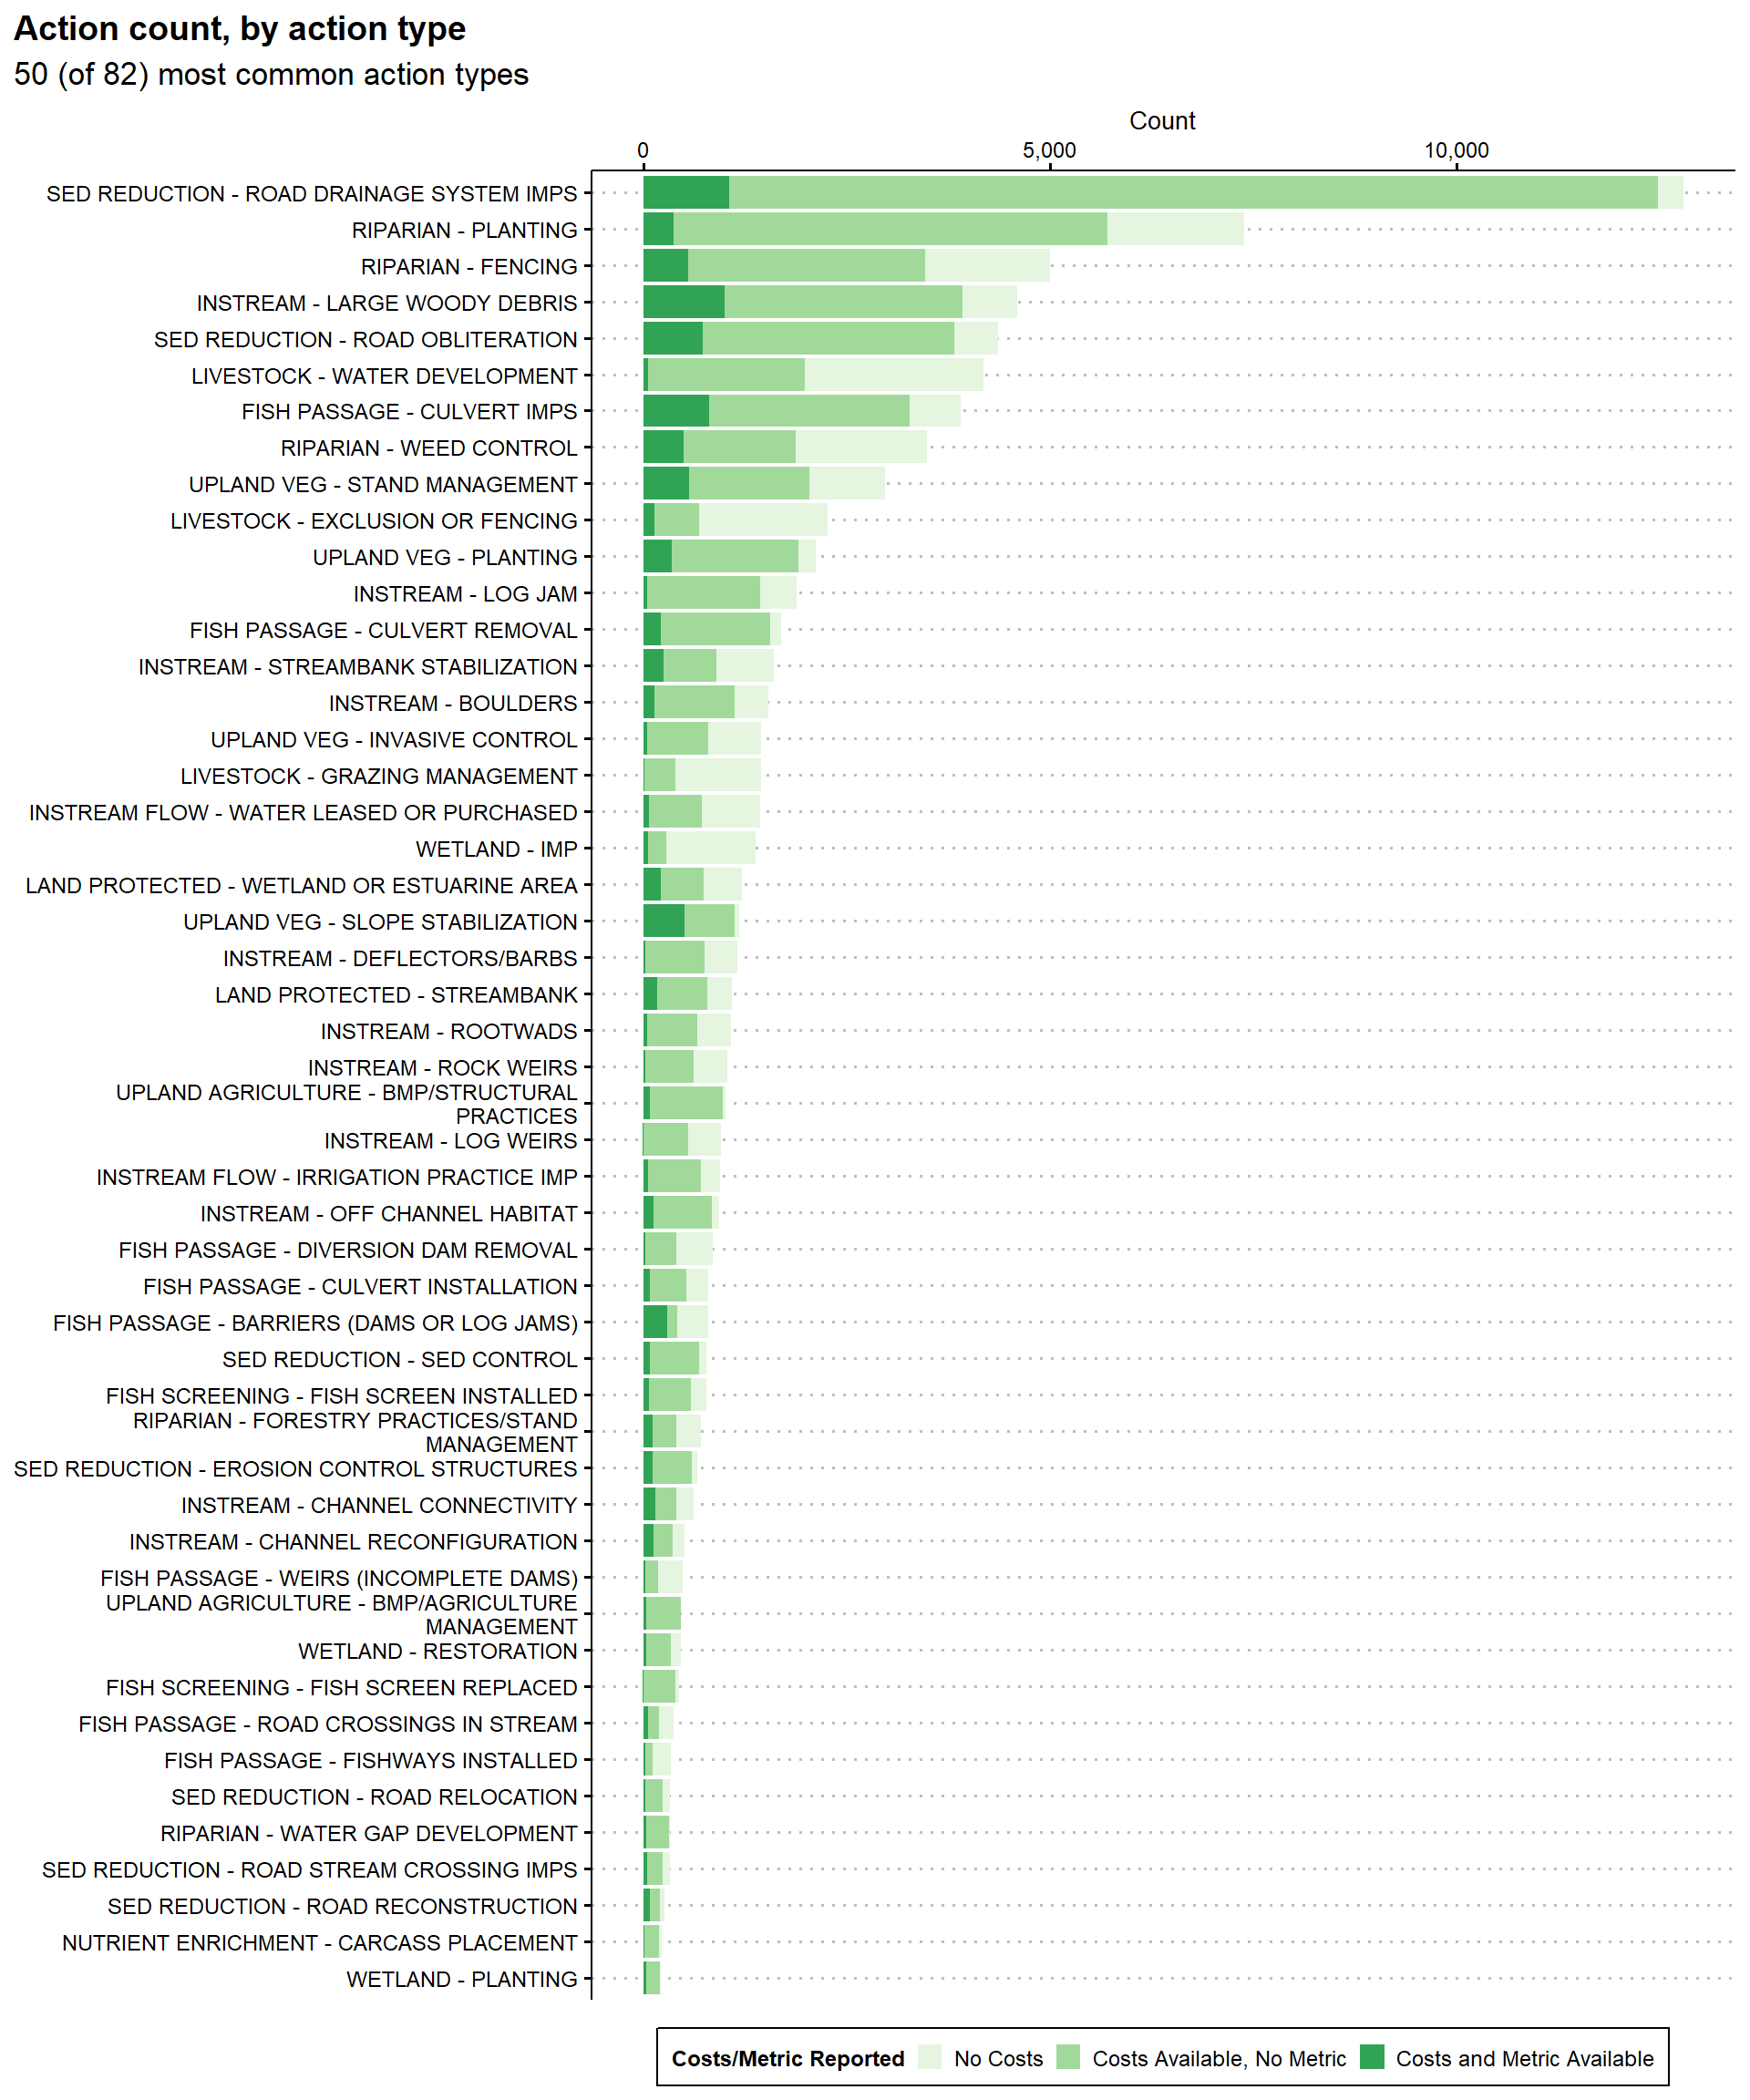
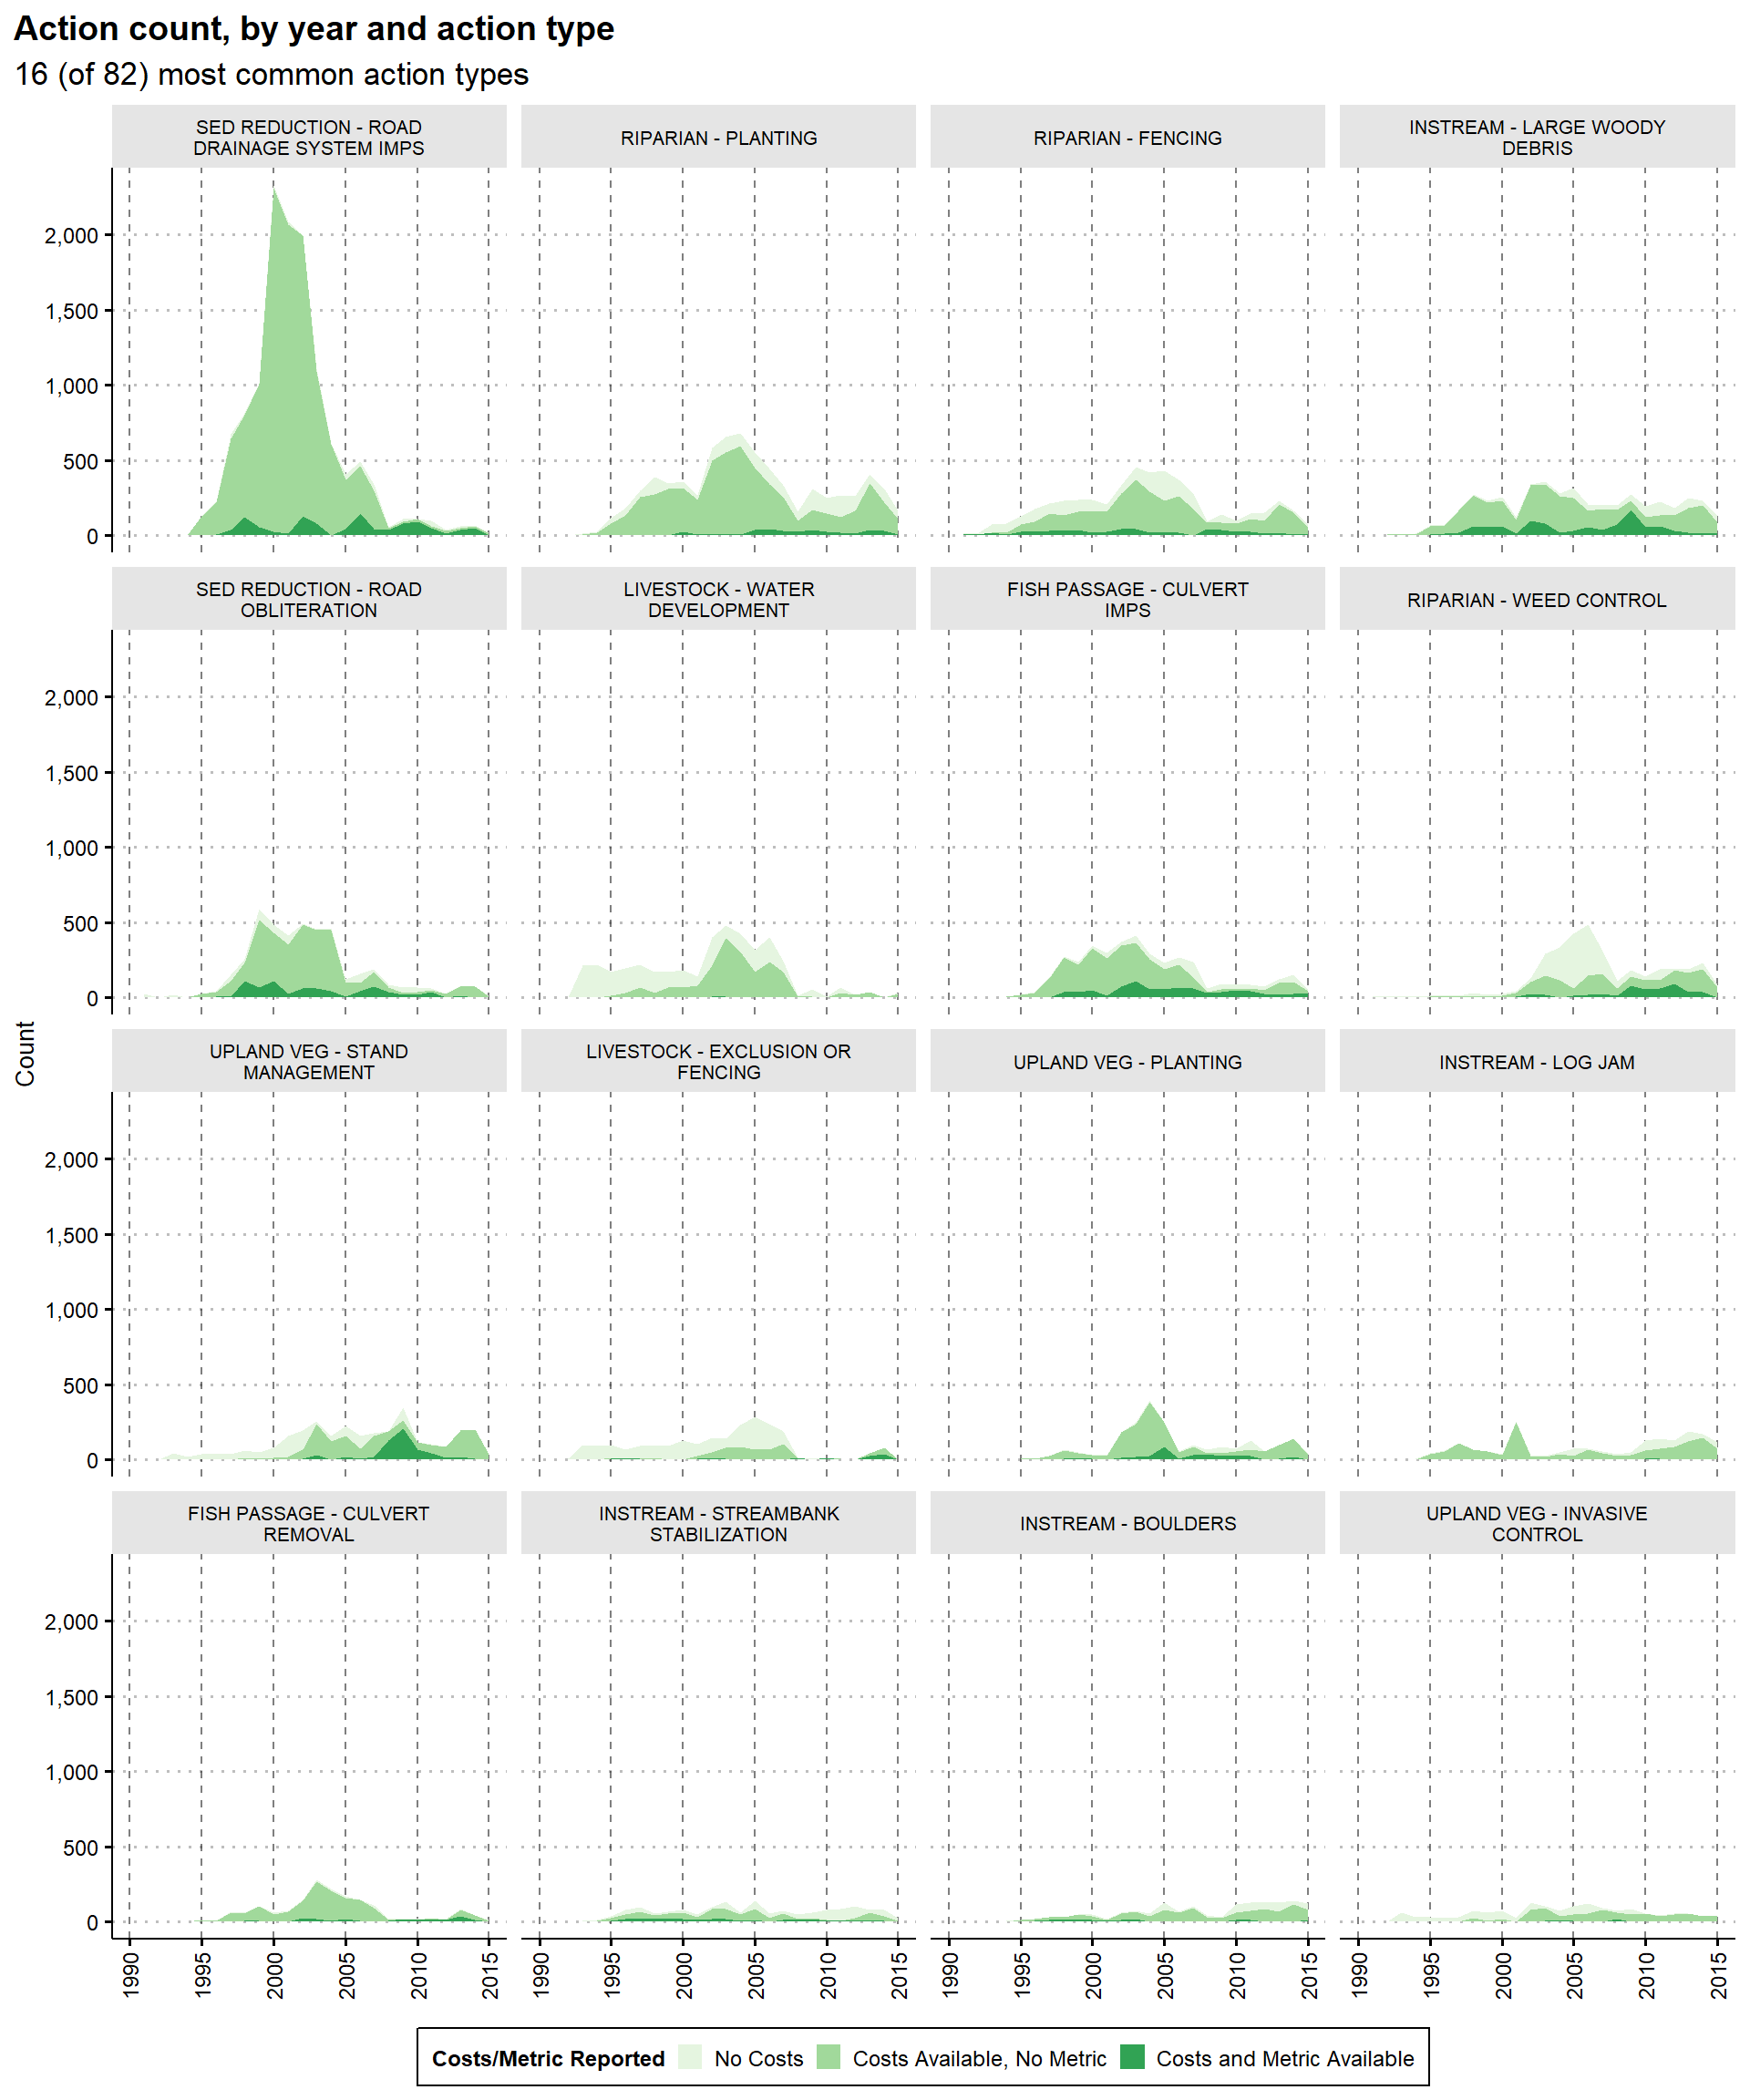
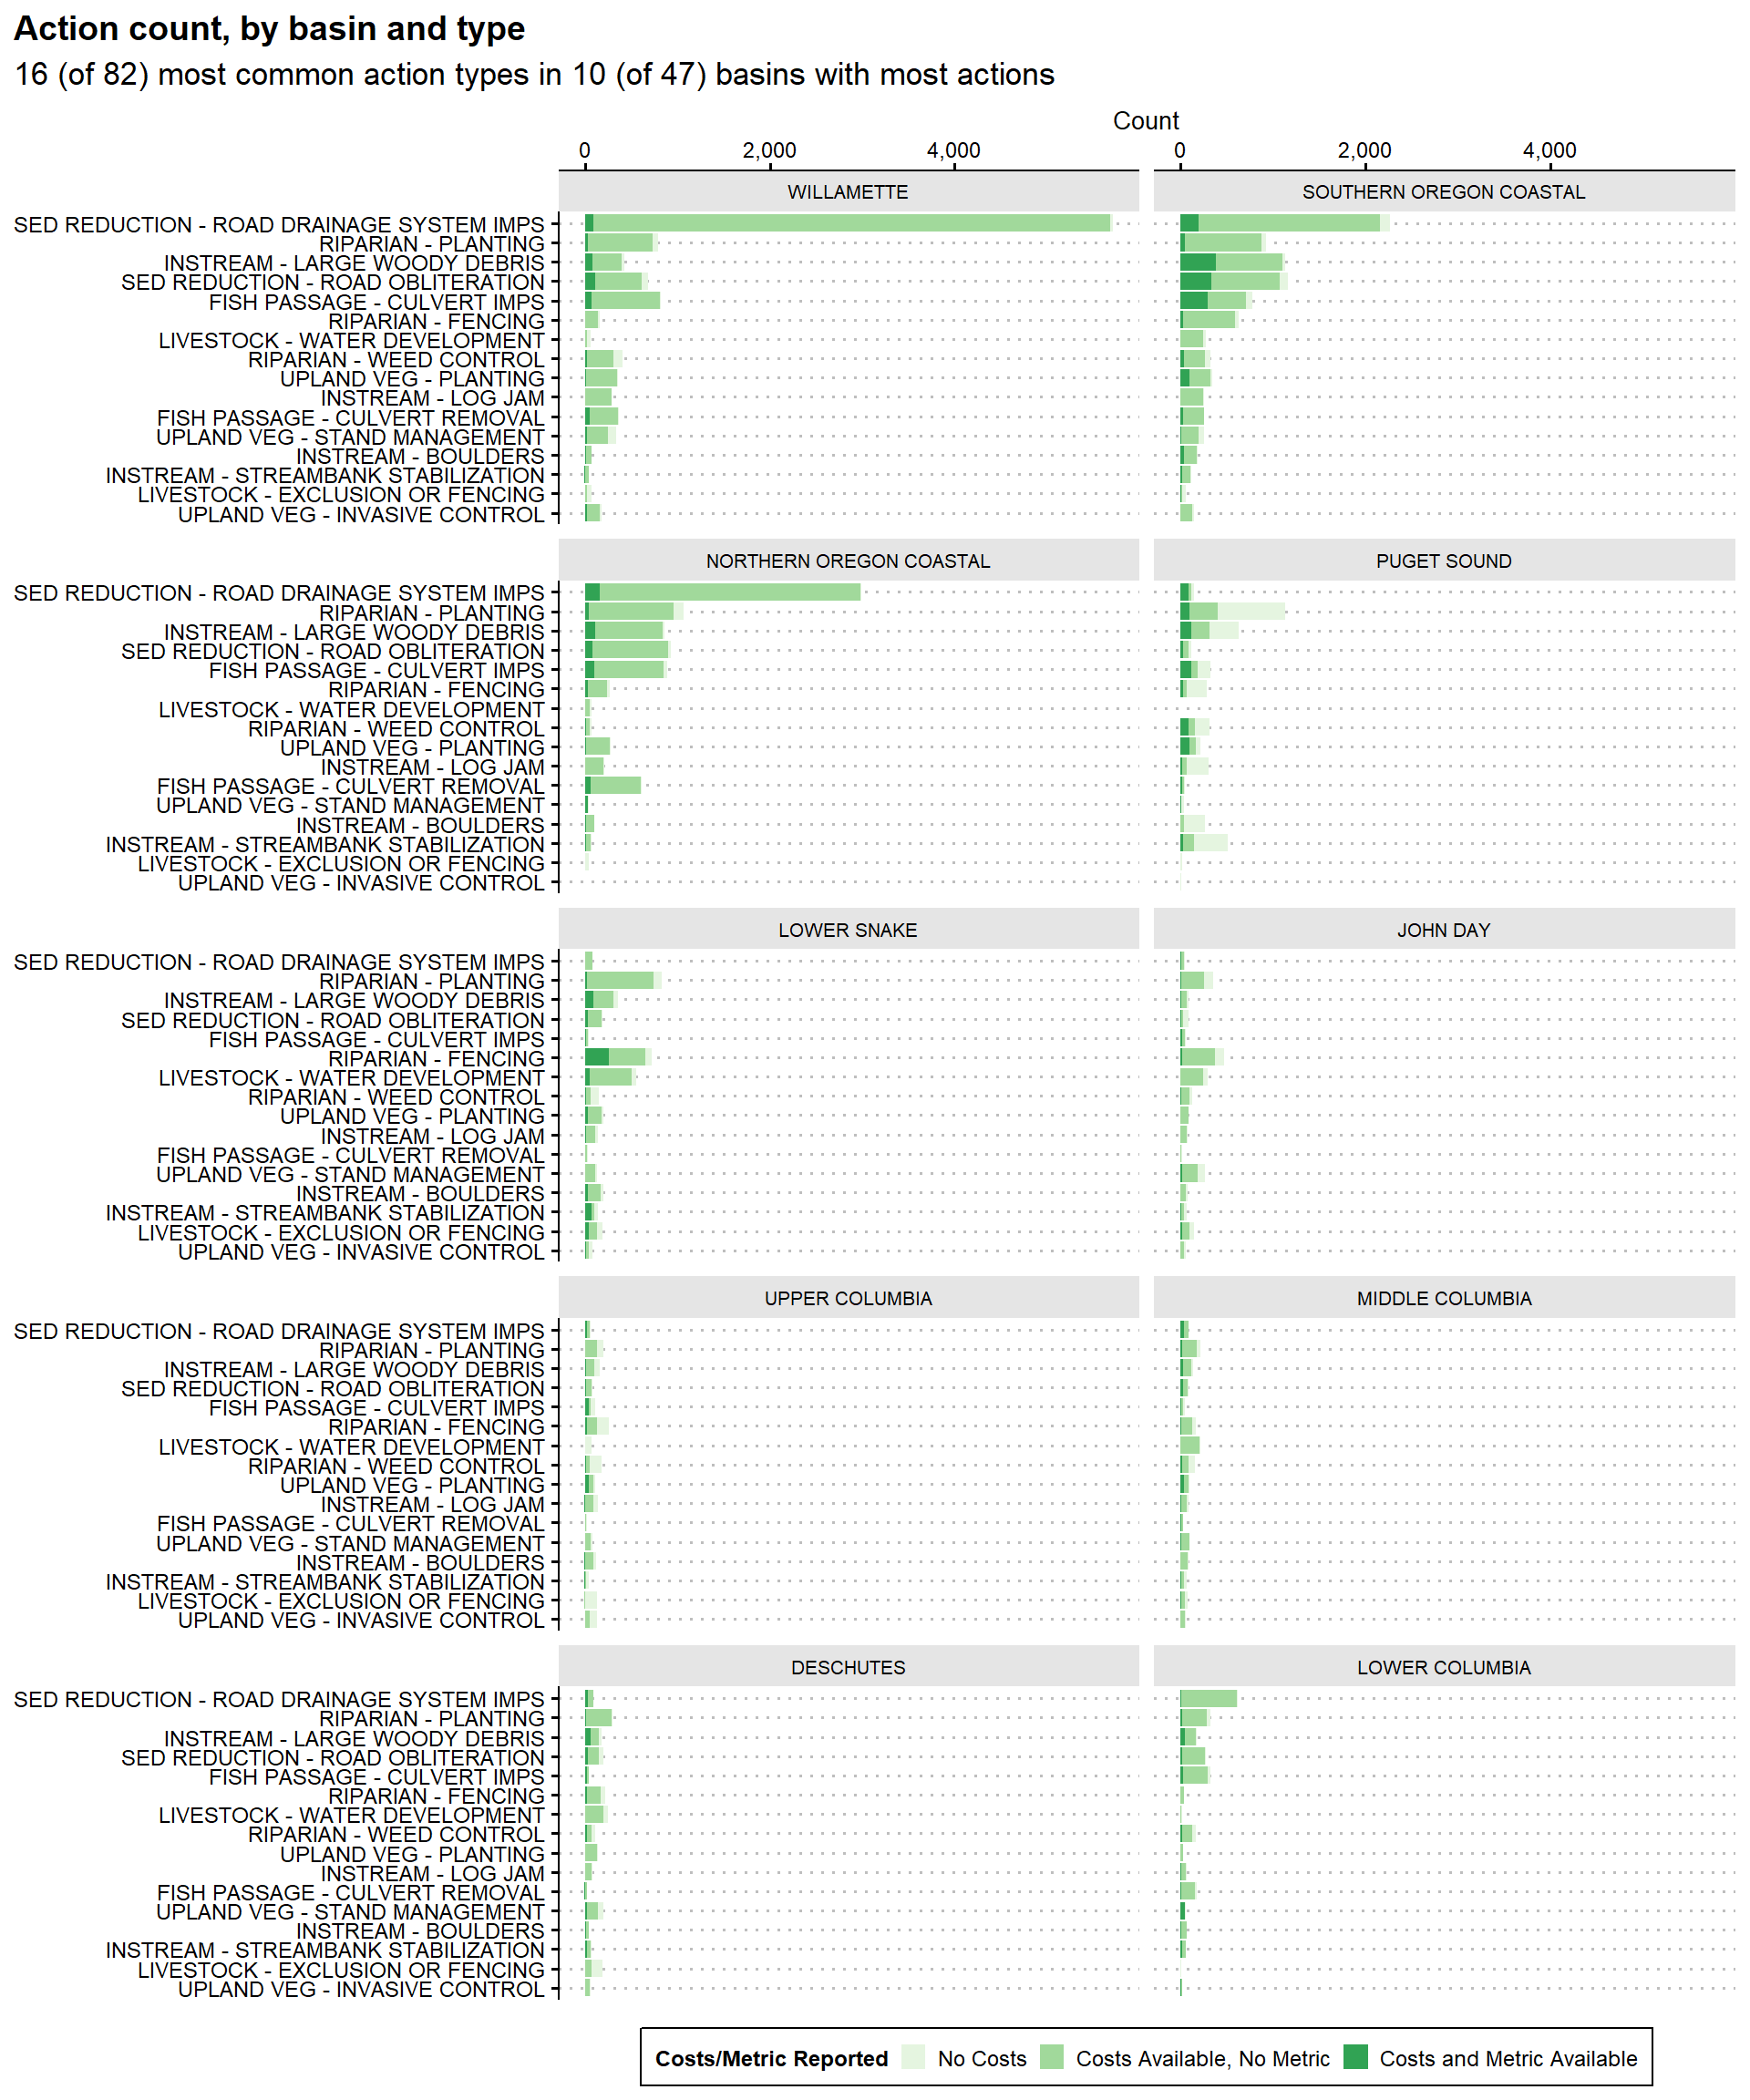
Observation: Road drainage system improvements are by far the most common actions. Most of these actions occurred between 1995 and 2005 in Western Oregon (Willamette, Southern Oregon Coastal, and Northern Oregon Coastal basins), and are reported through the Oregon Watershed Restoration Inventory (OWRI). Road obliterations follow a similar pattern. These actions are the fifth mos common, are also concentrated in Western Oregon during the same period, and are mostly reported through OWRI.
Observation: Culvert-related projects (upgrades and removals) are quite common and consistently reported over time and space. The reporting of culvert projects does not follow the pattern of Oregon roadwork projects and is more widespread over several basins and reporting sources.
Observation: More direct habitat improvements like plantings, stream-flow alterations (e.g. large woody debris, boulders, log jams, etc.), and weeding are widely and consistently documented. These sorts of actions might be directly comparable in terms of costs.
By Basin
By Reporting Source
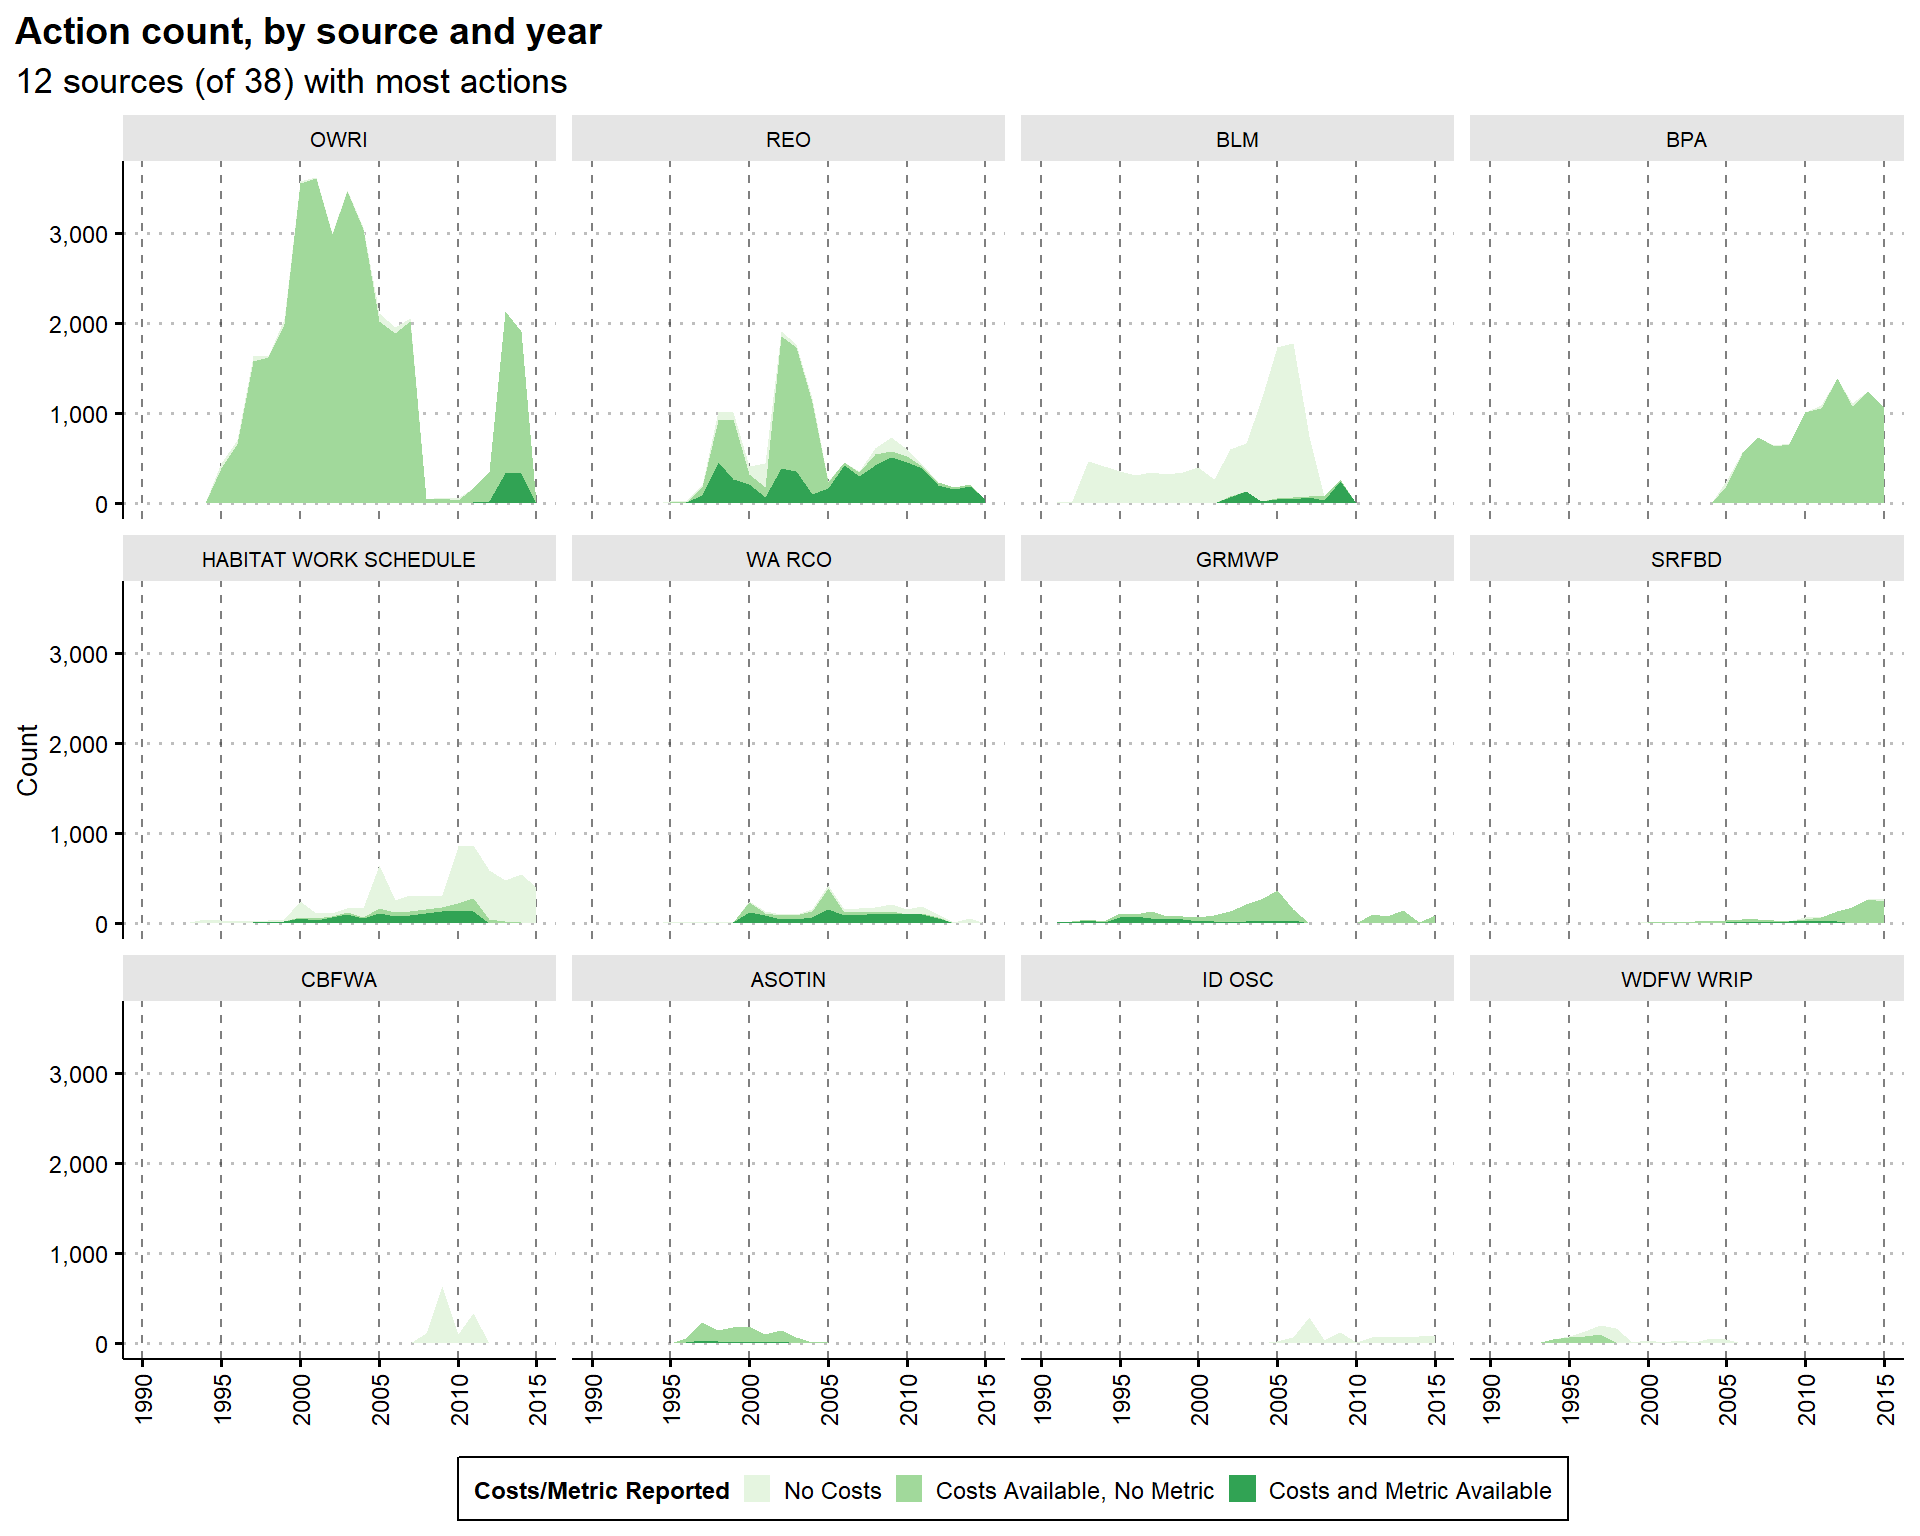
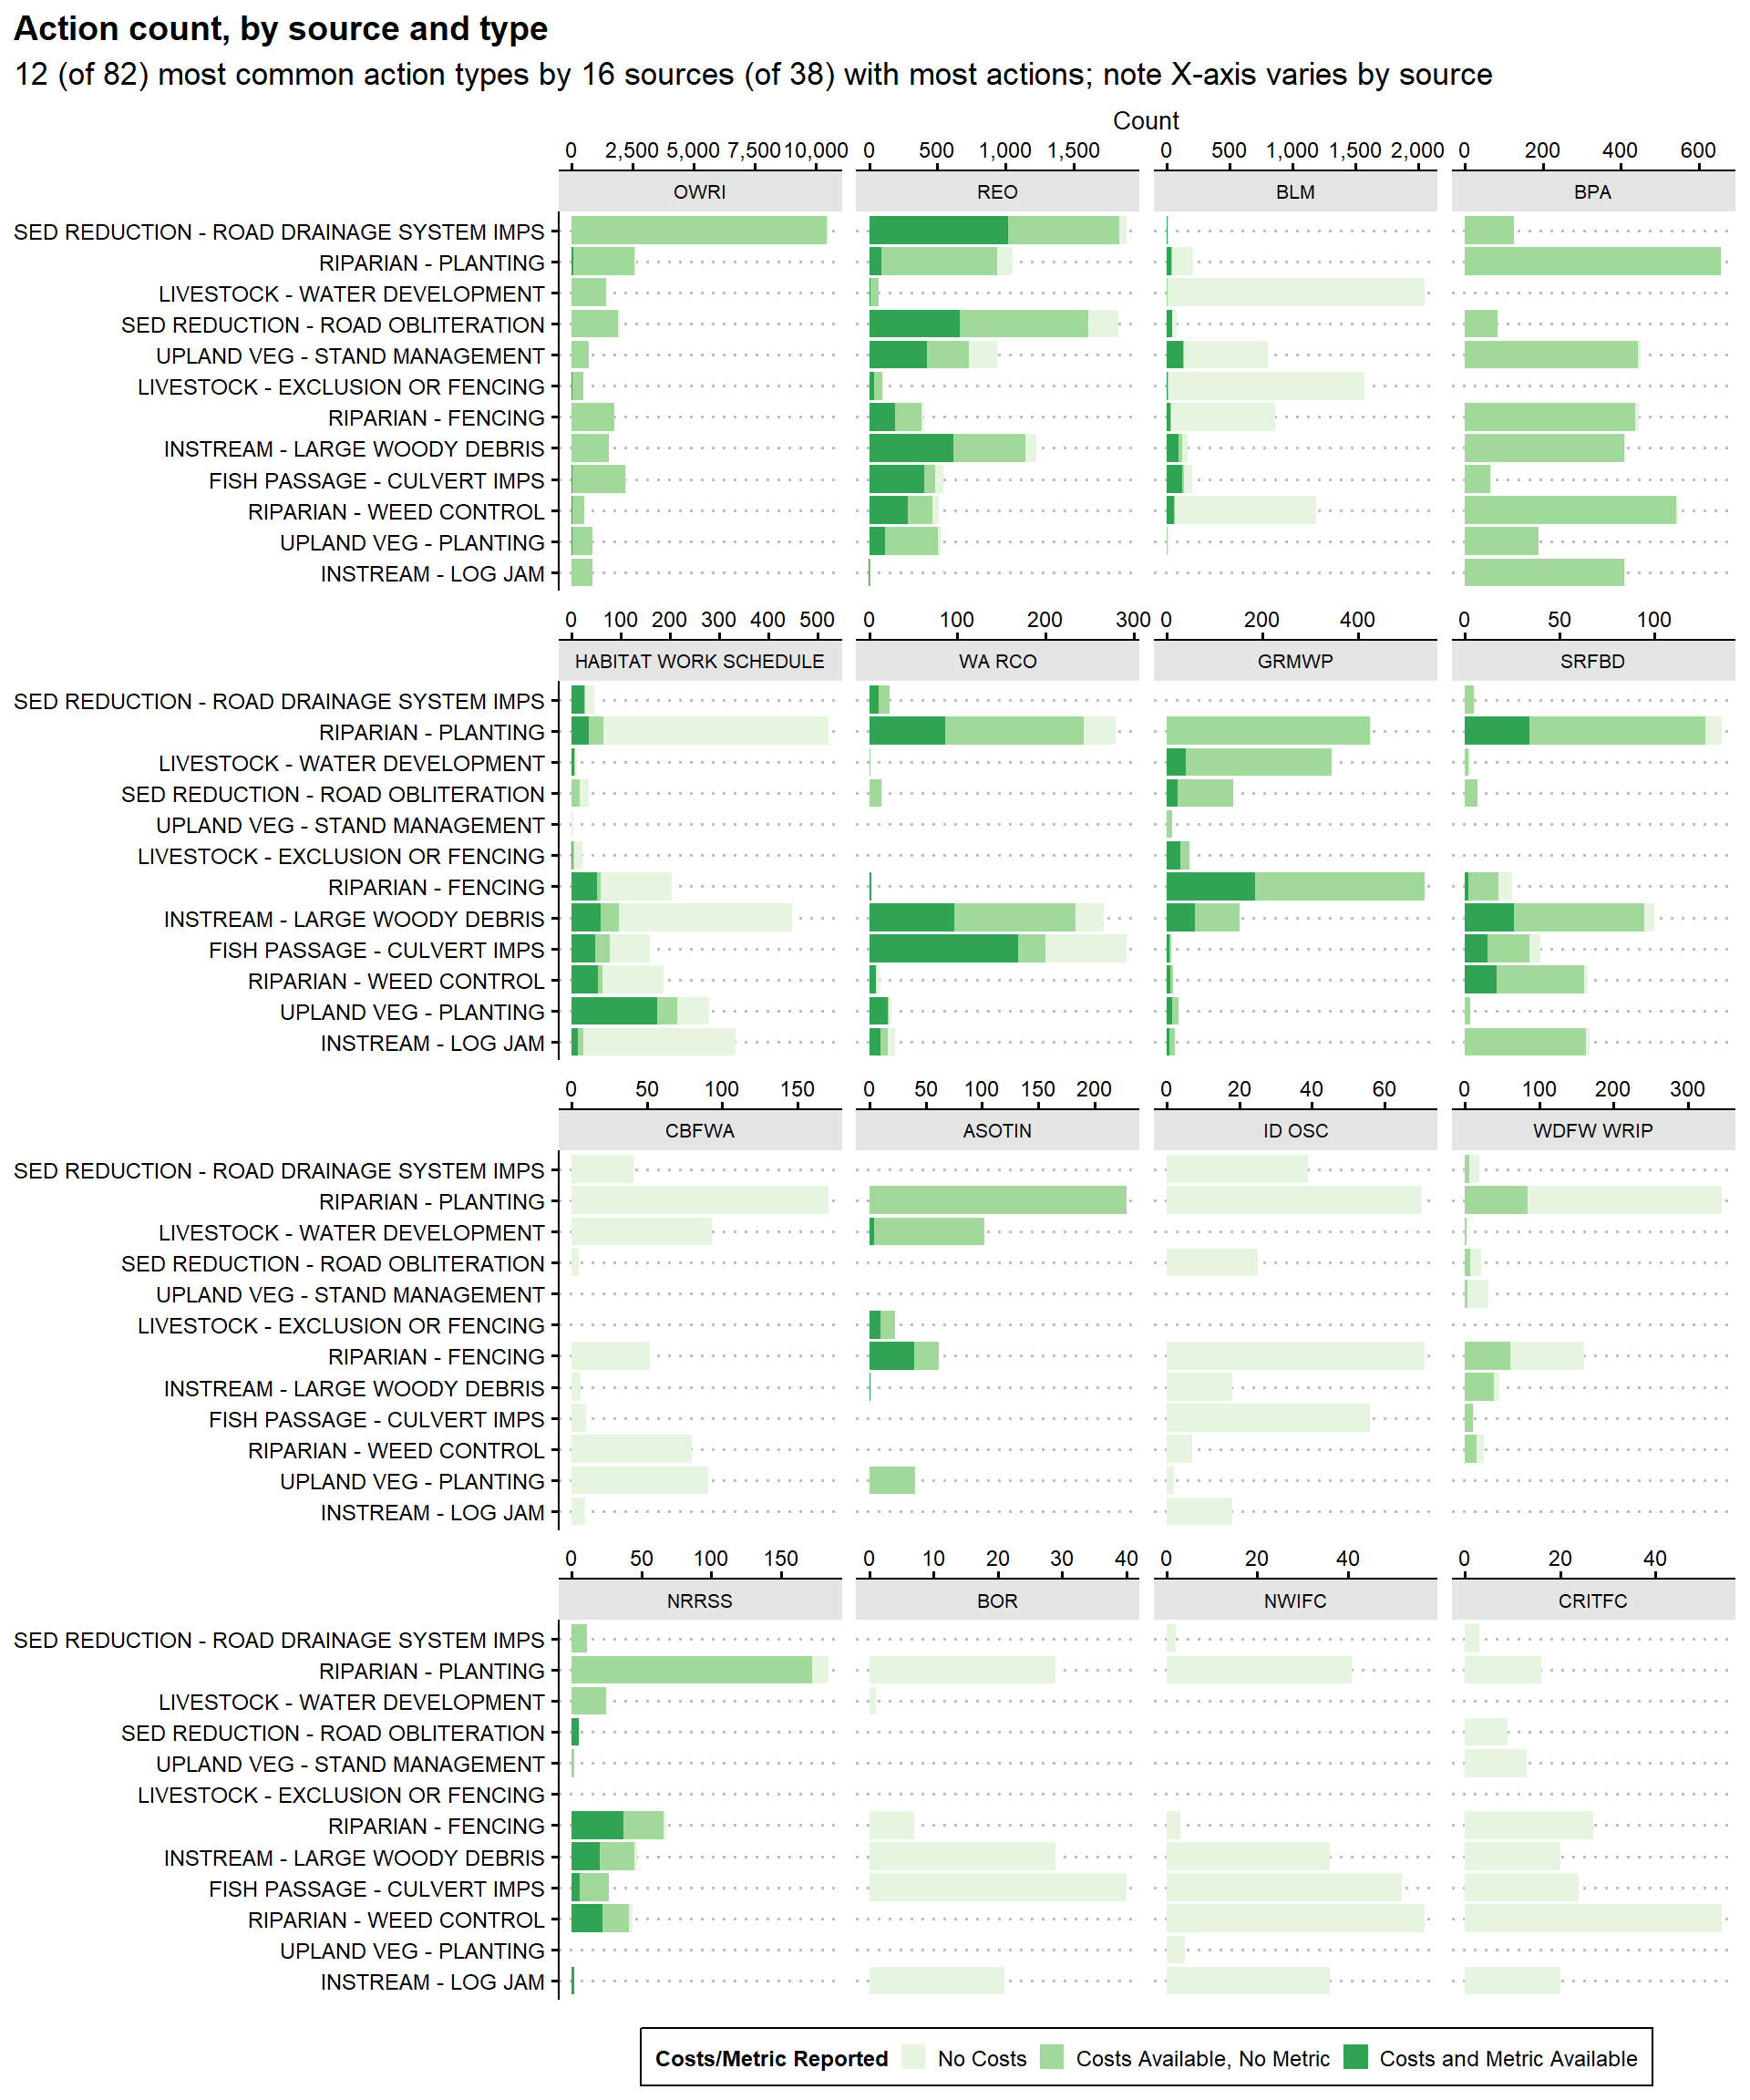
Observation: Livestock (including riparian fencing) and upland actions are common, but mainly reported by Bureau of Land Management (BLM). These actions are likely more targeted towards general watershed improvements rather than salmon habitat in particular.
Expenditures
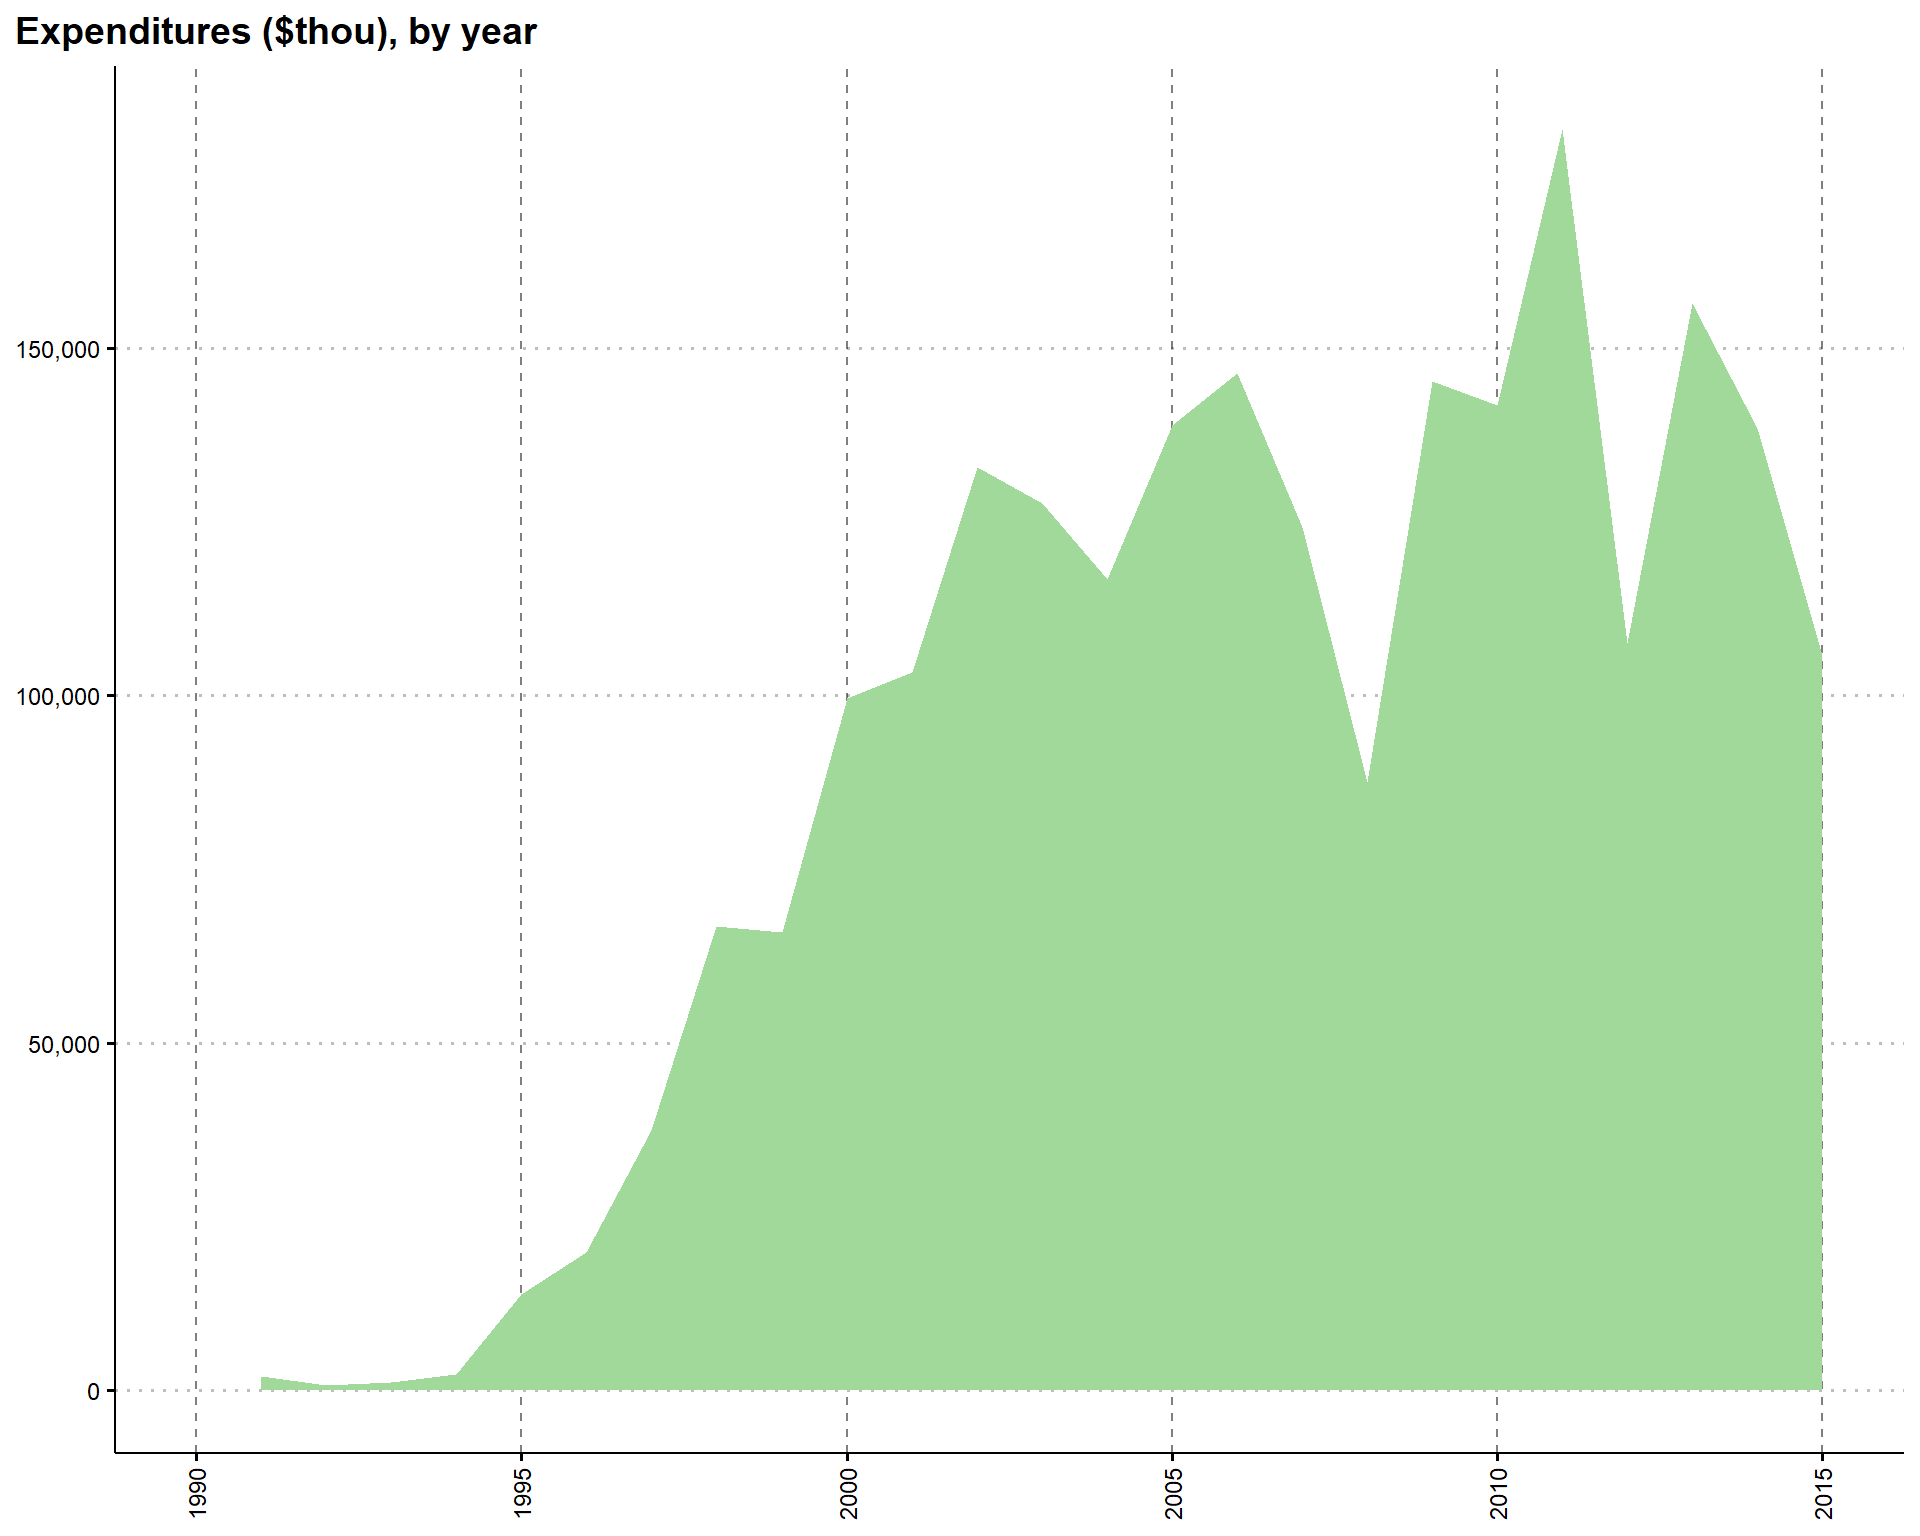
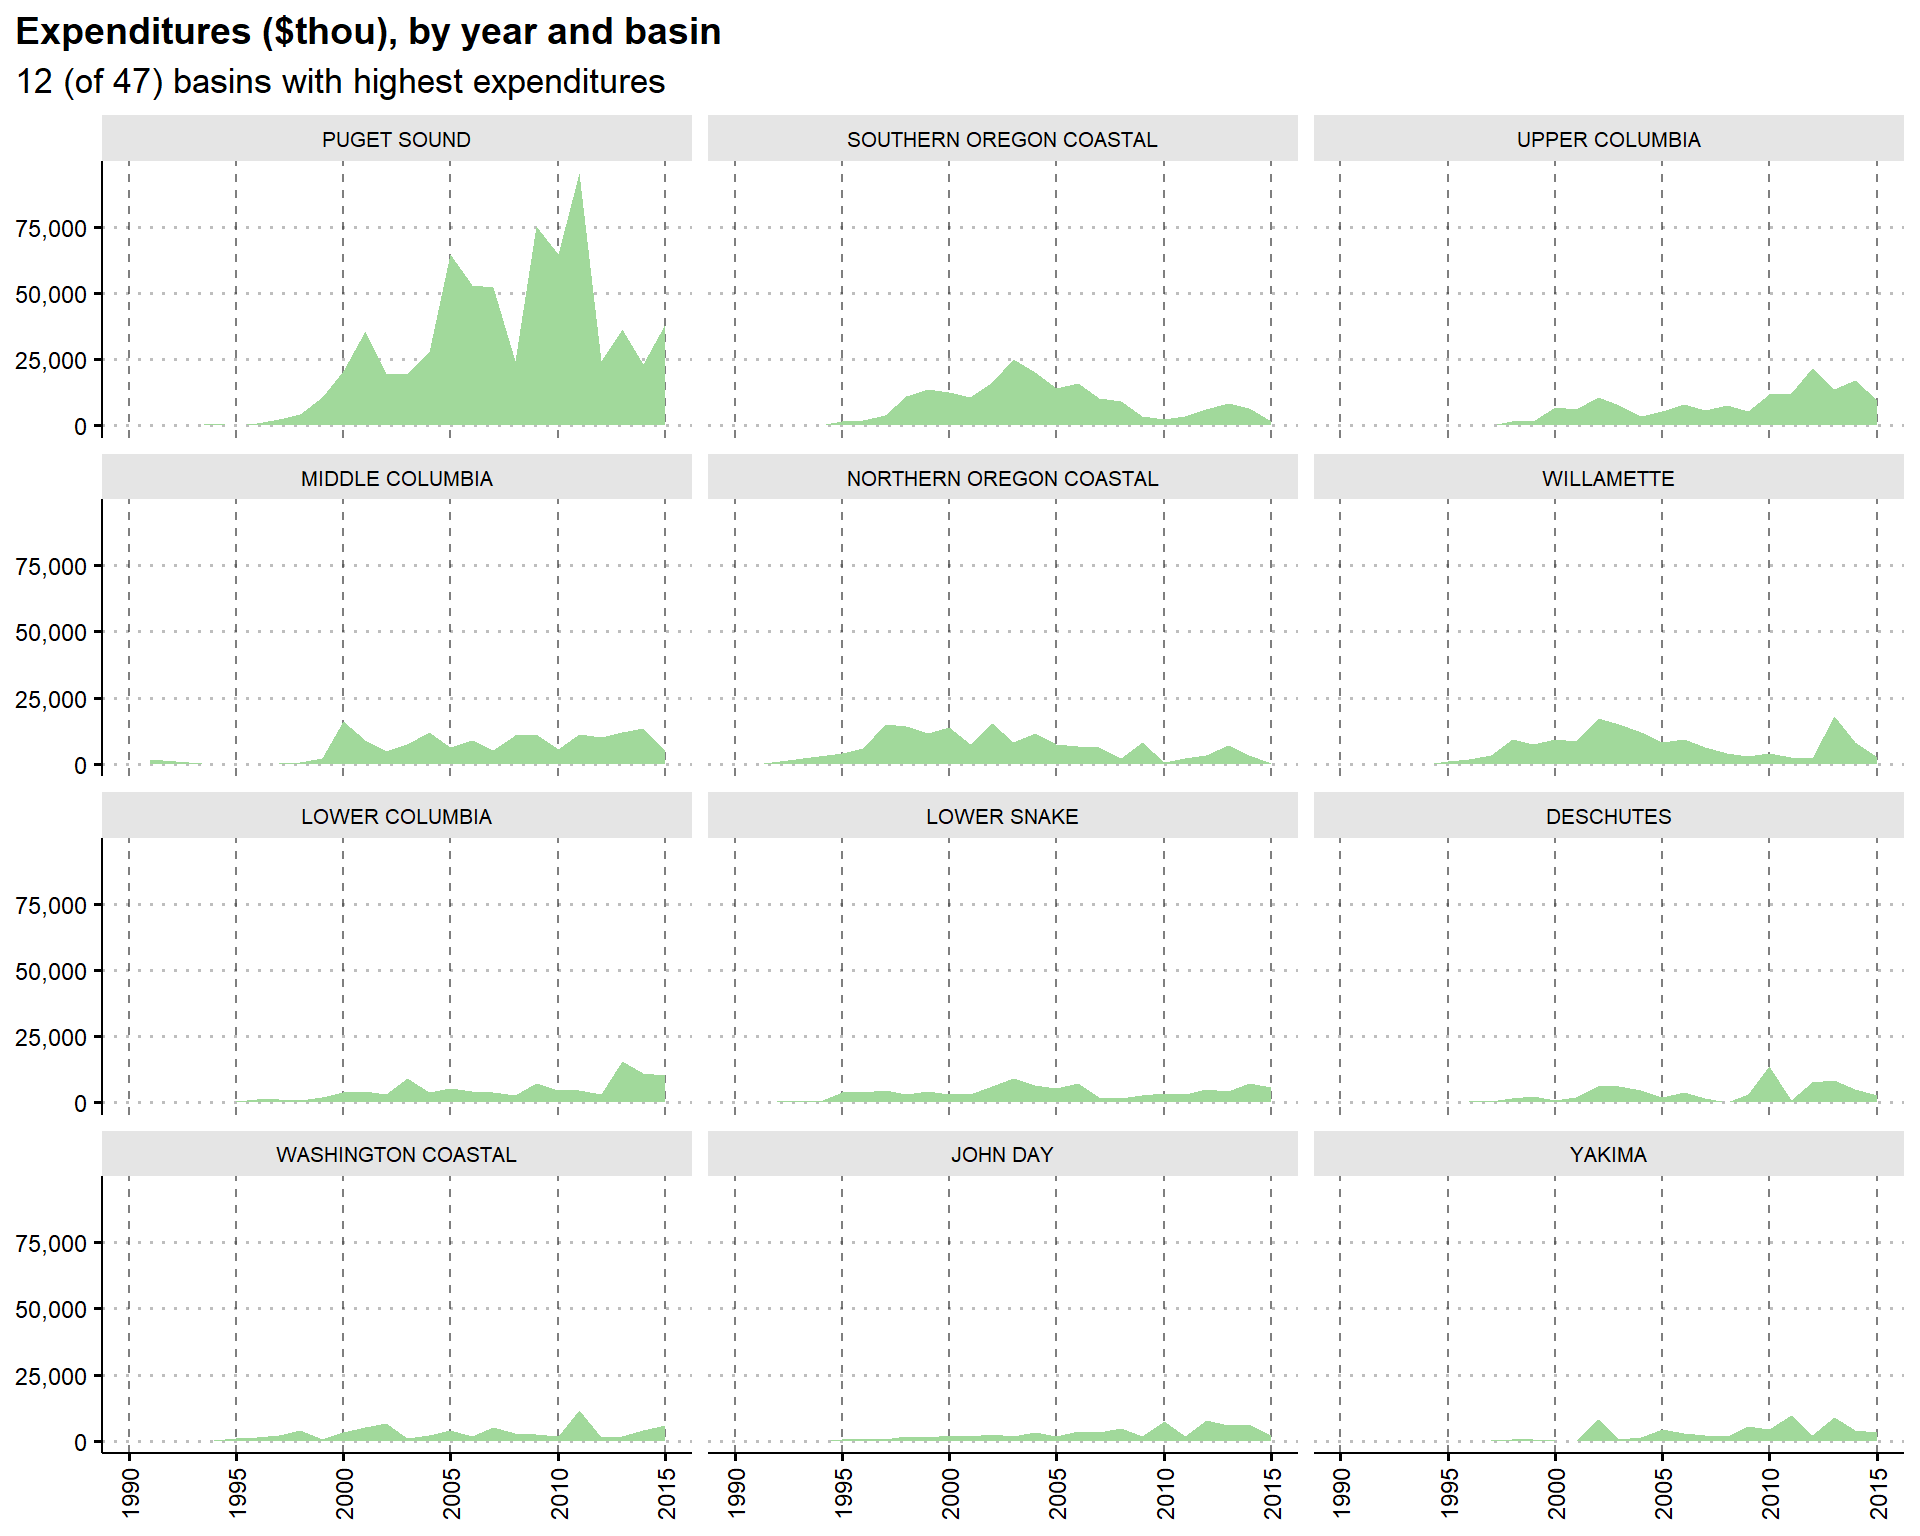
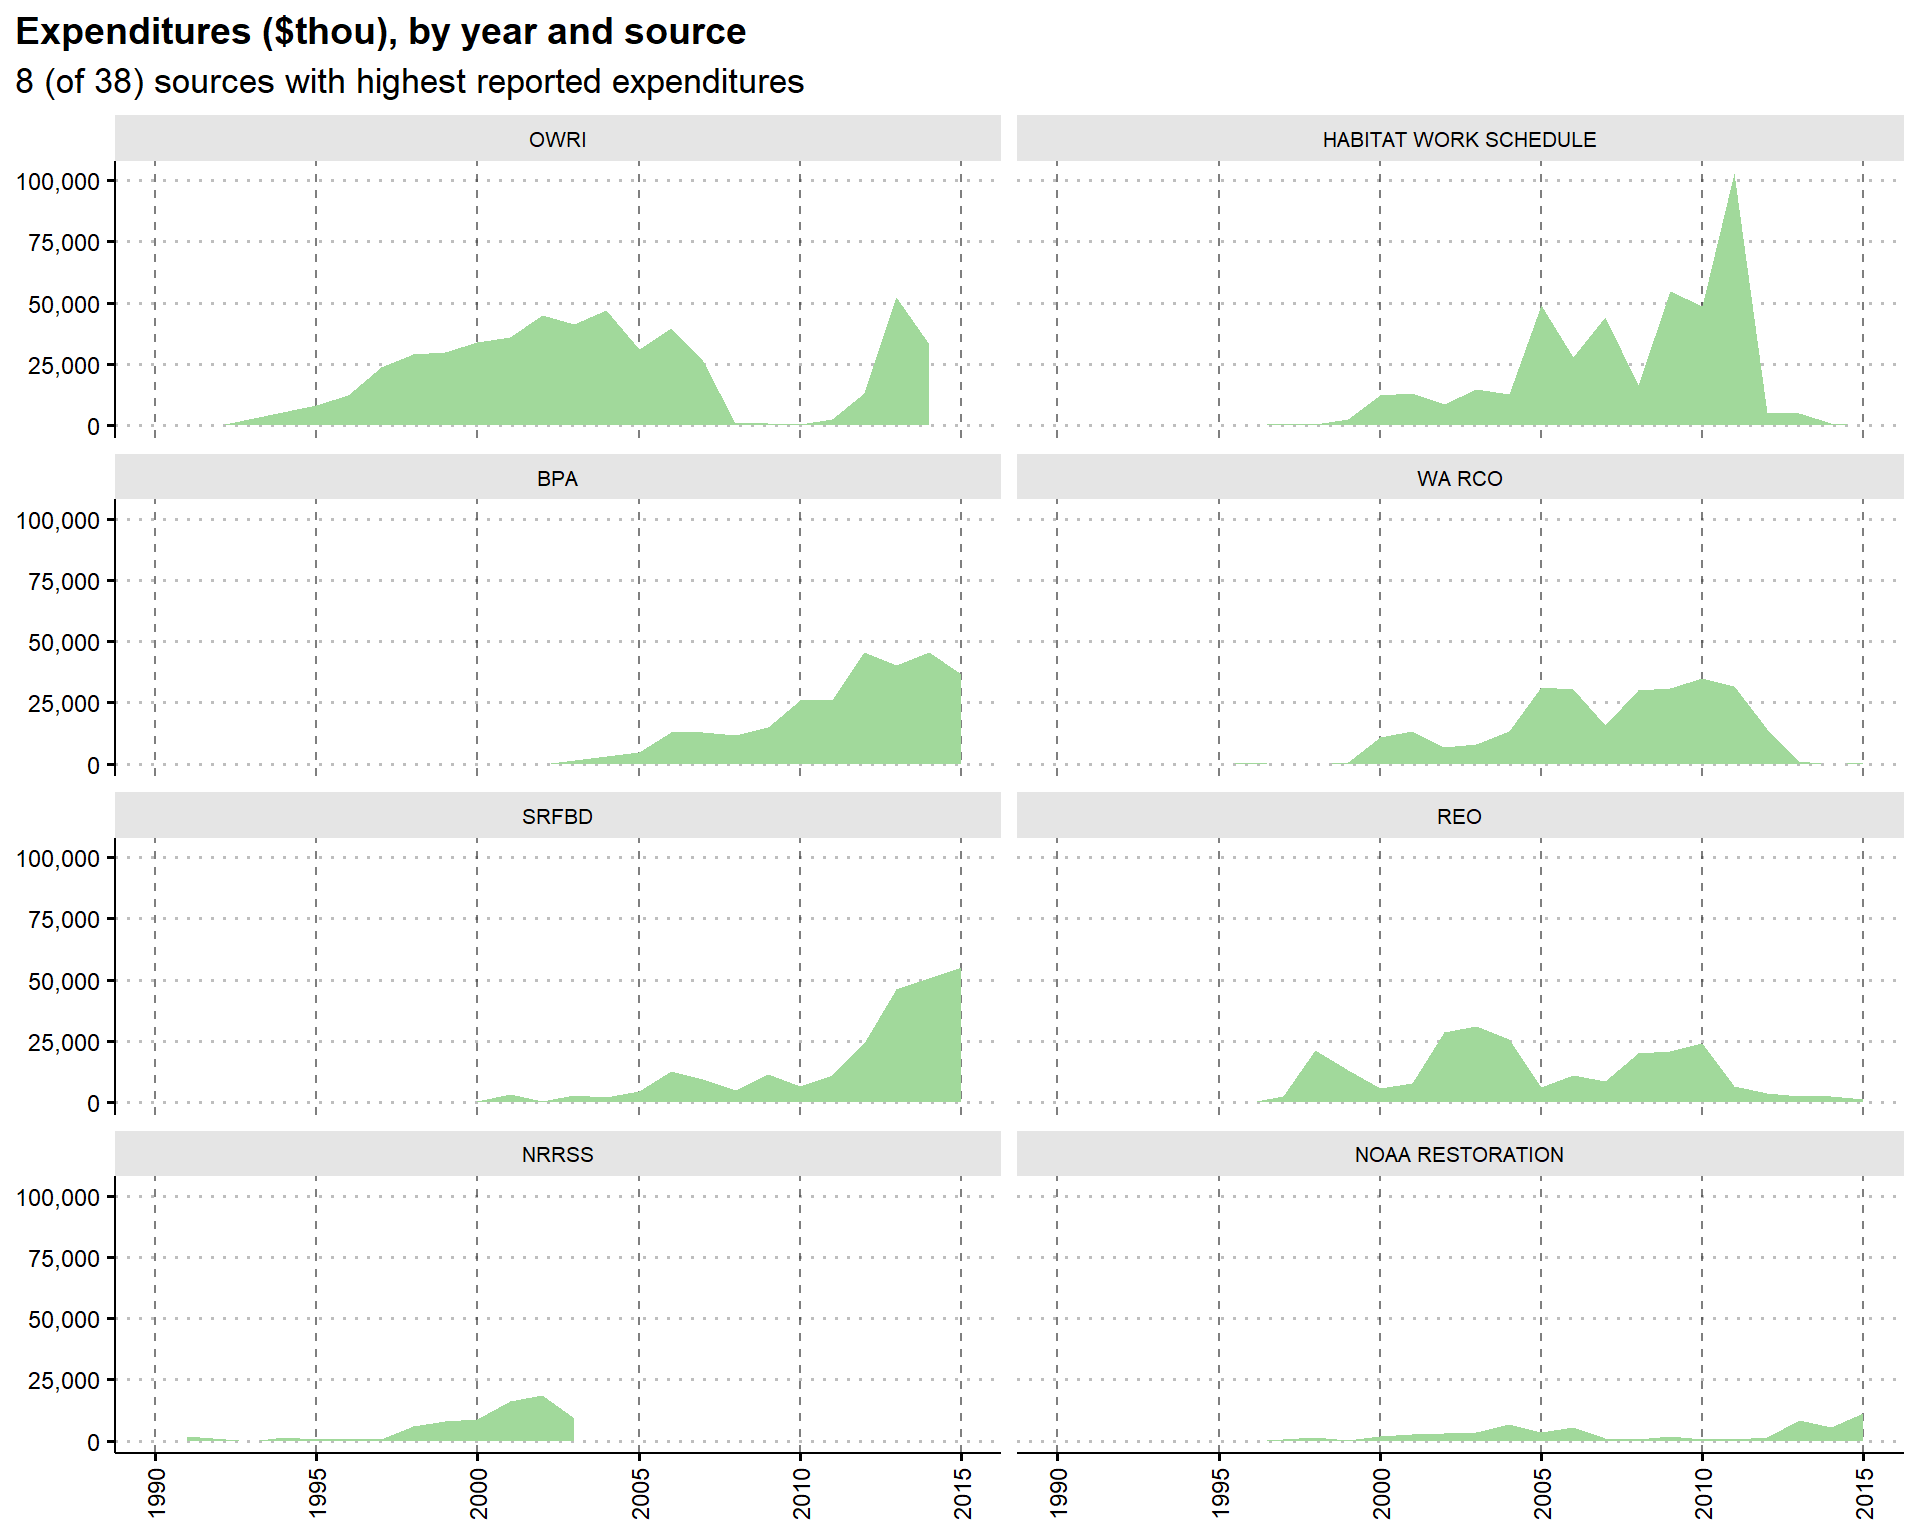
In this section, I visualize reported expenditures over (a) action type, (b) year, (c) basin, and (d) source (and selected cross-tabulations). Note that a single project will fall into multiple action type categories if the project consists of multiple action types. All expenditures are converted to 2019 dollars via FRED Implicit Price Deflator. Three projects were removed as outliers in their spending levels (see note below).
Expenditures are available for 19,838 projects, or 66.3% of 29,916 projects. In total, the PNSHP data set reports $2,264,833,304 in expenditures across all 25 years.
Expenditures Figures
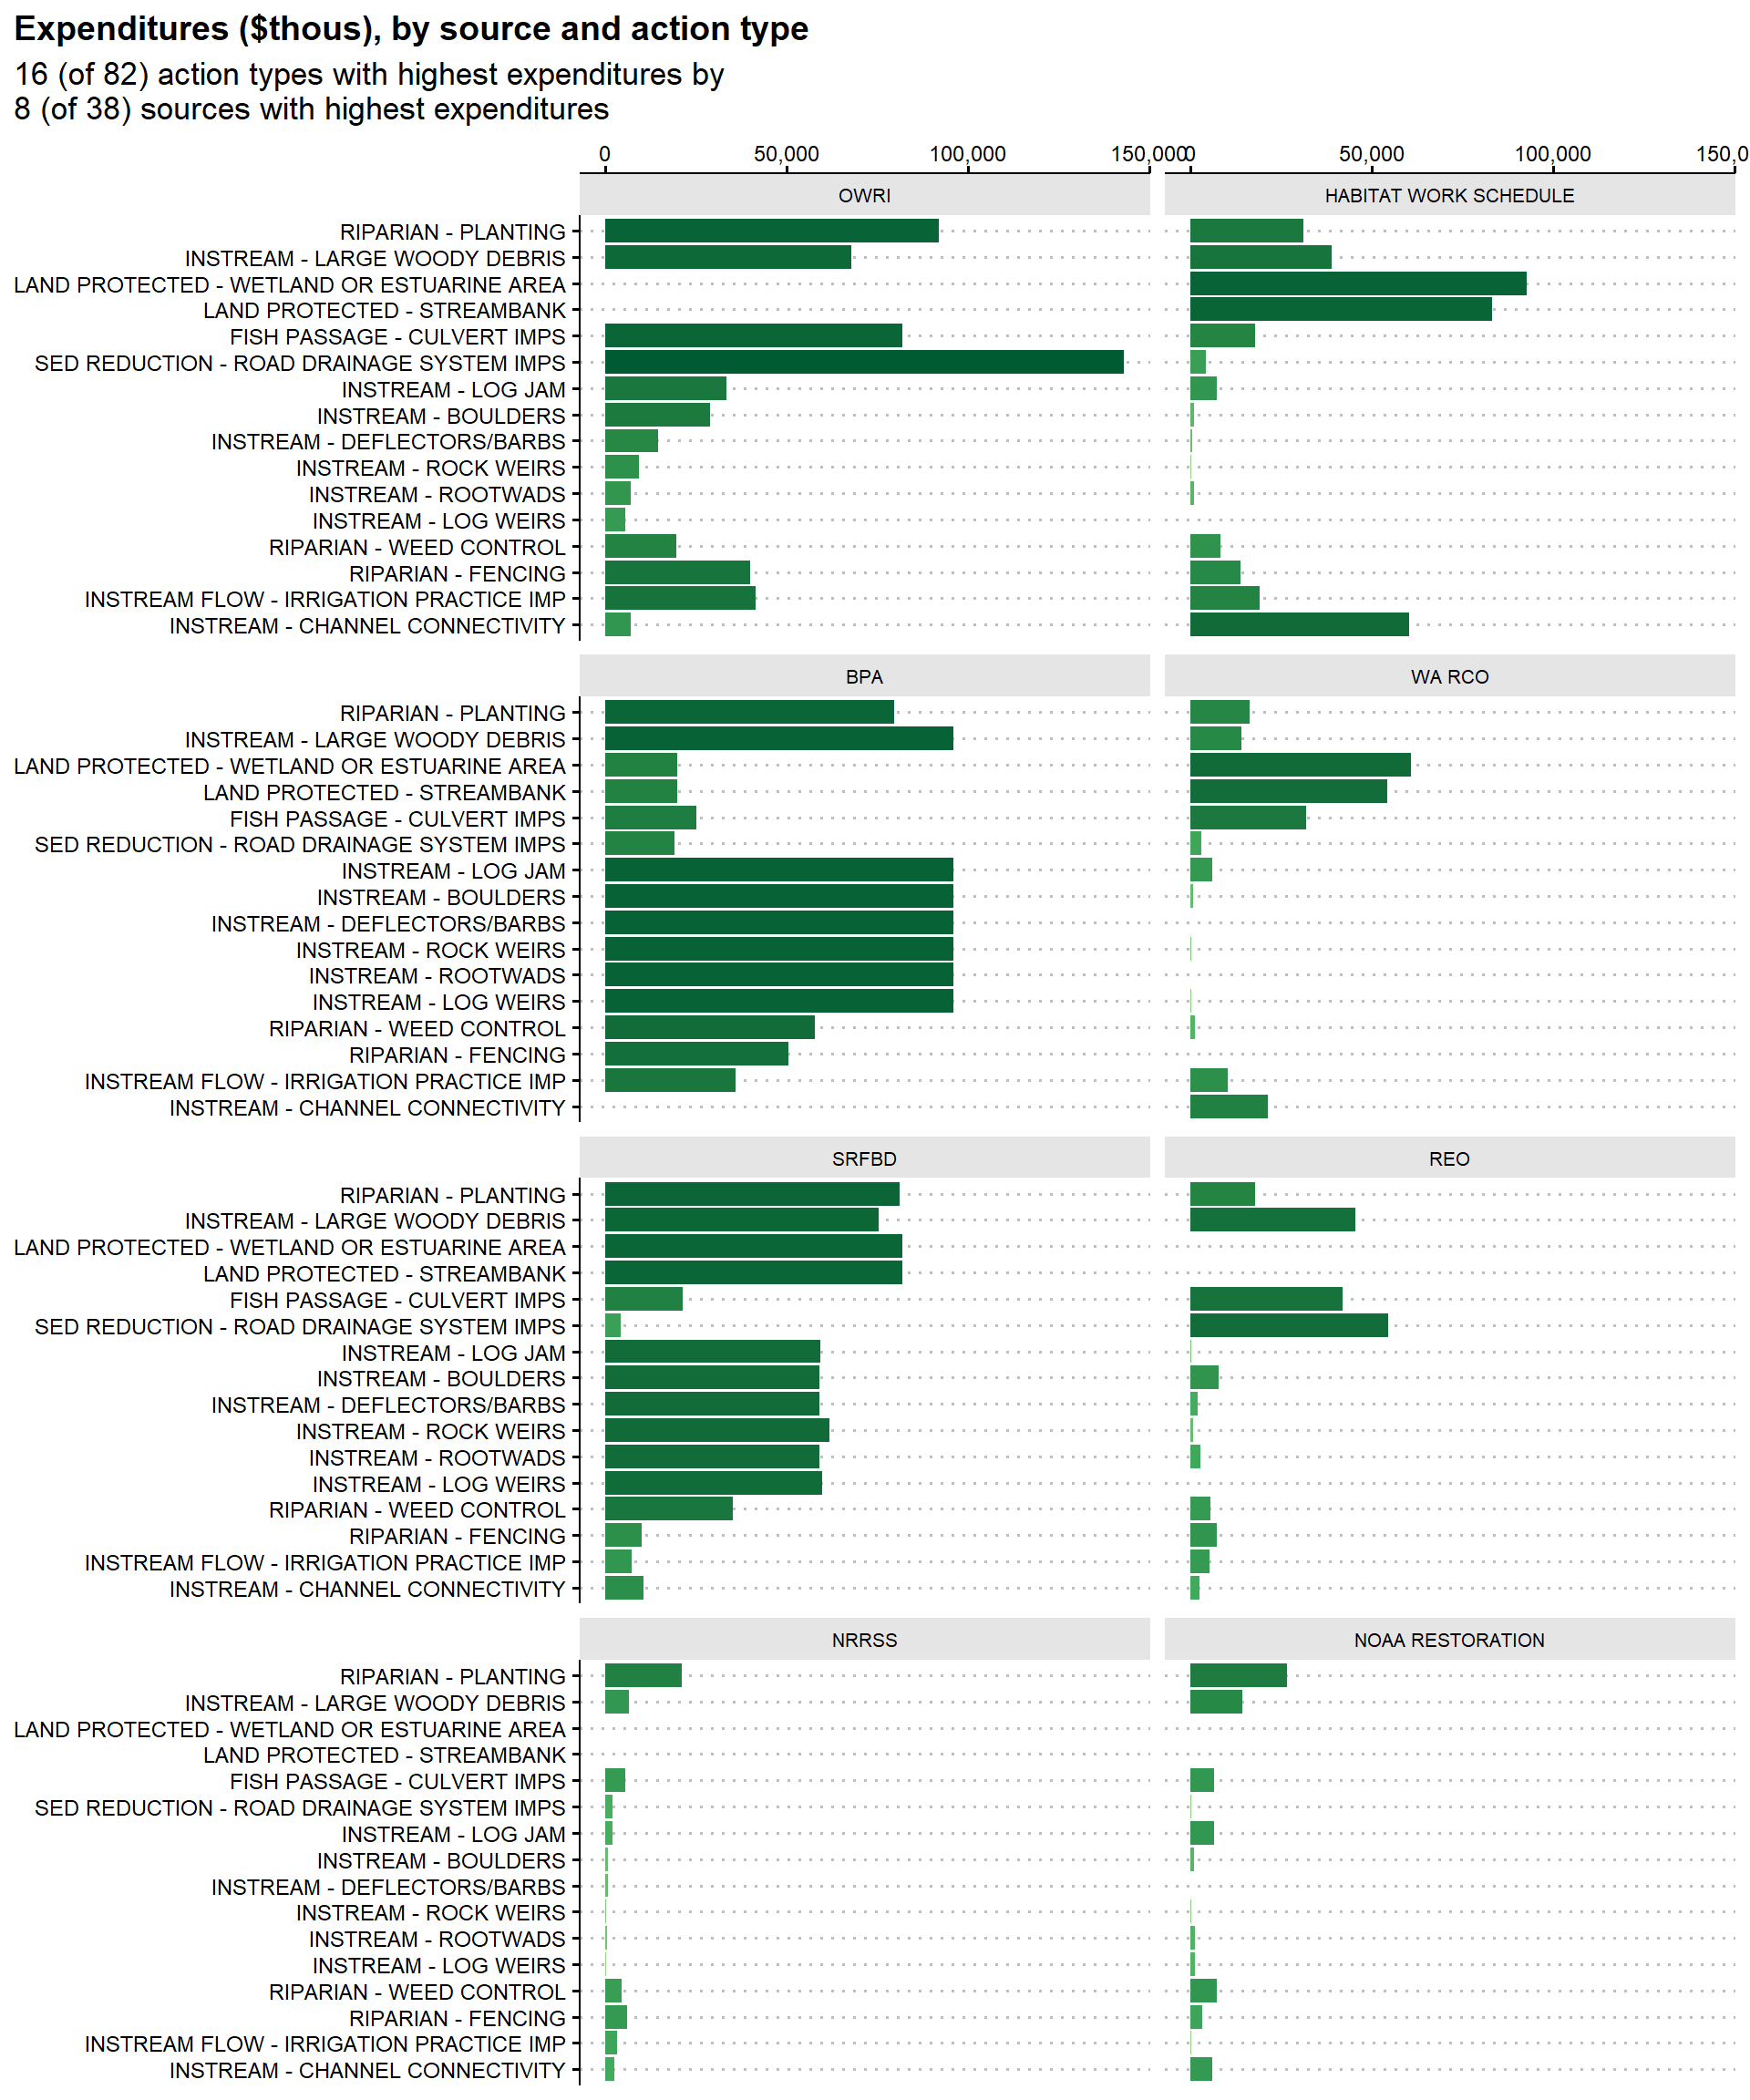
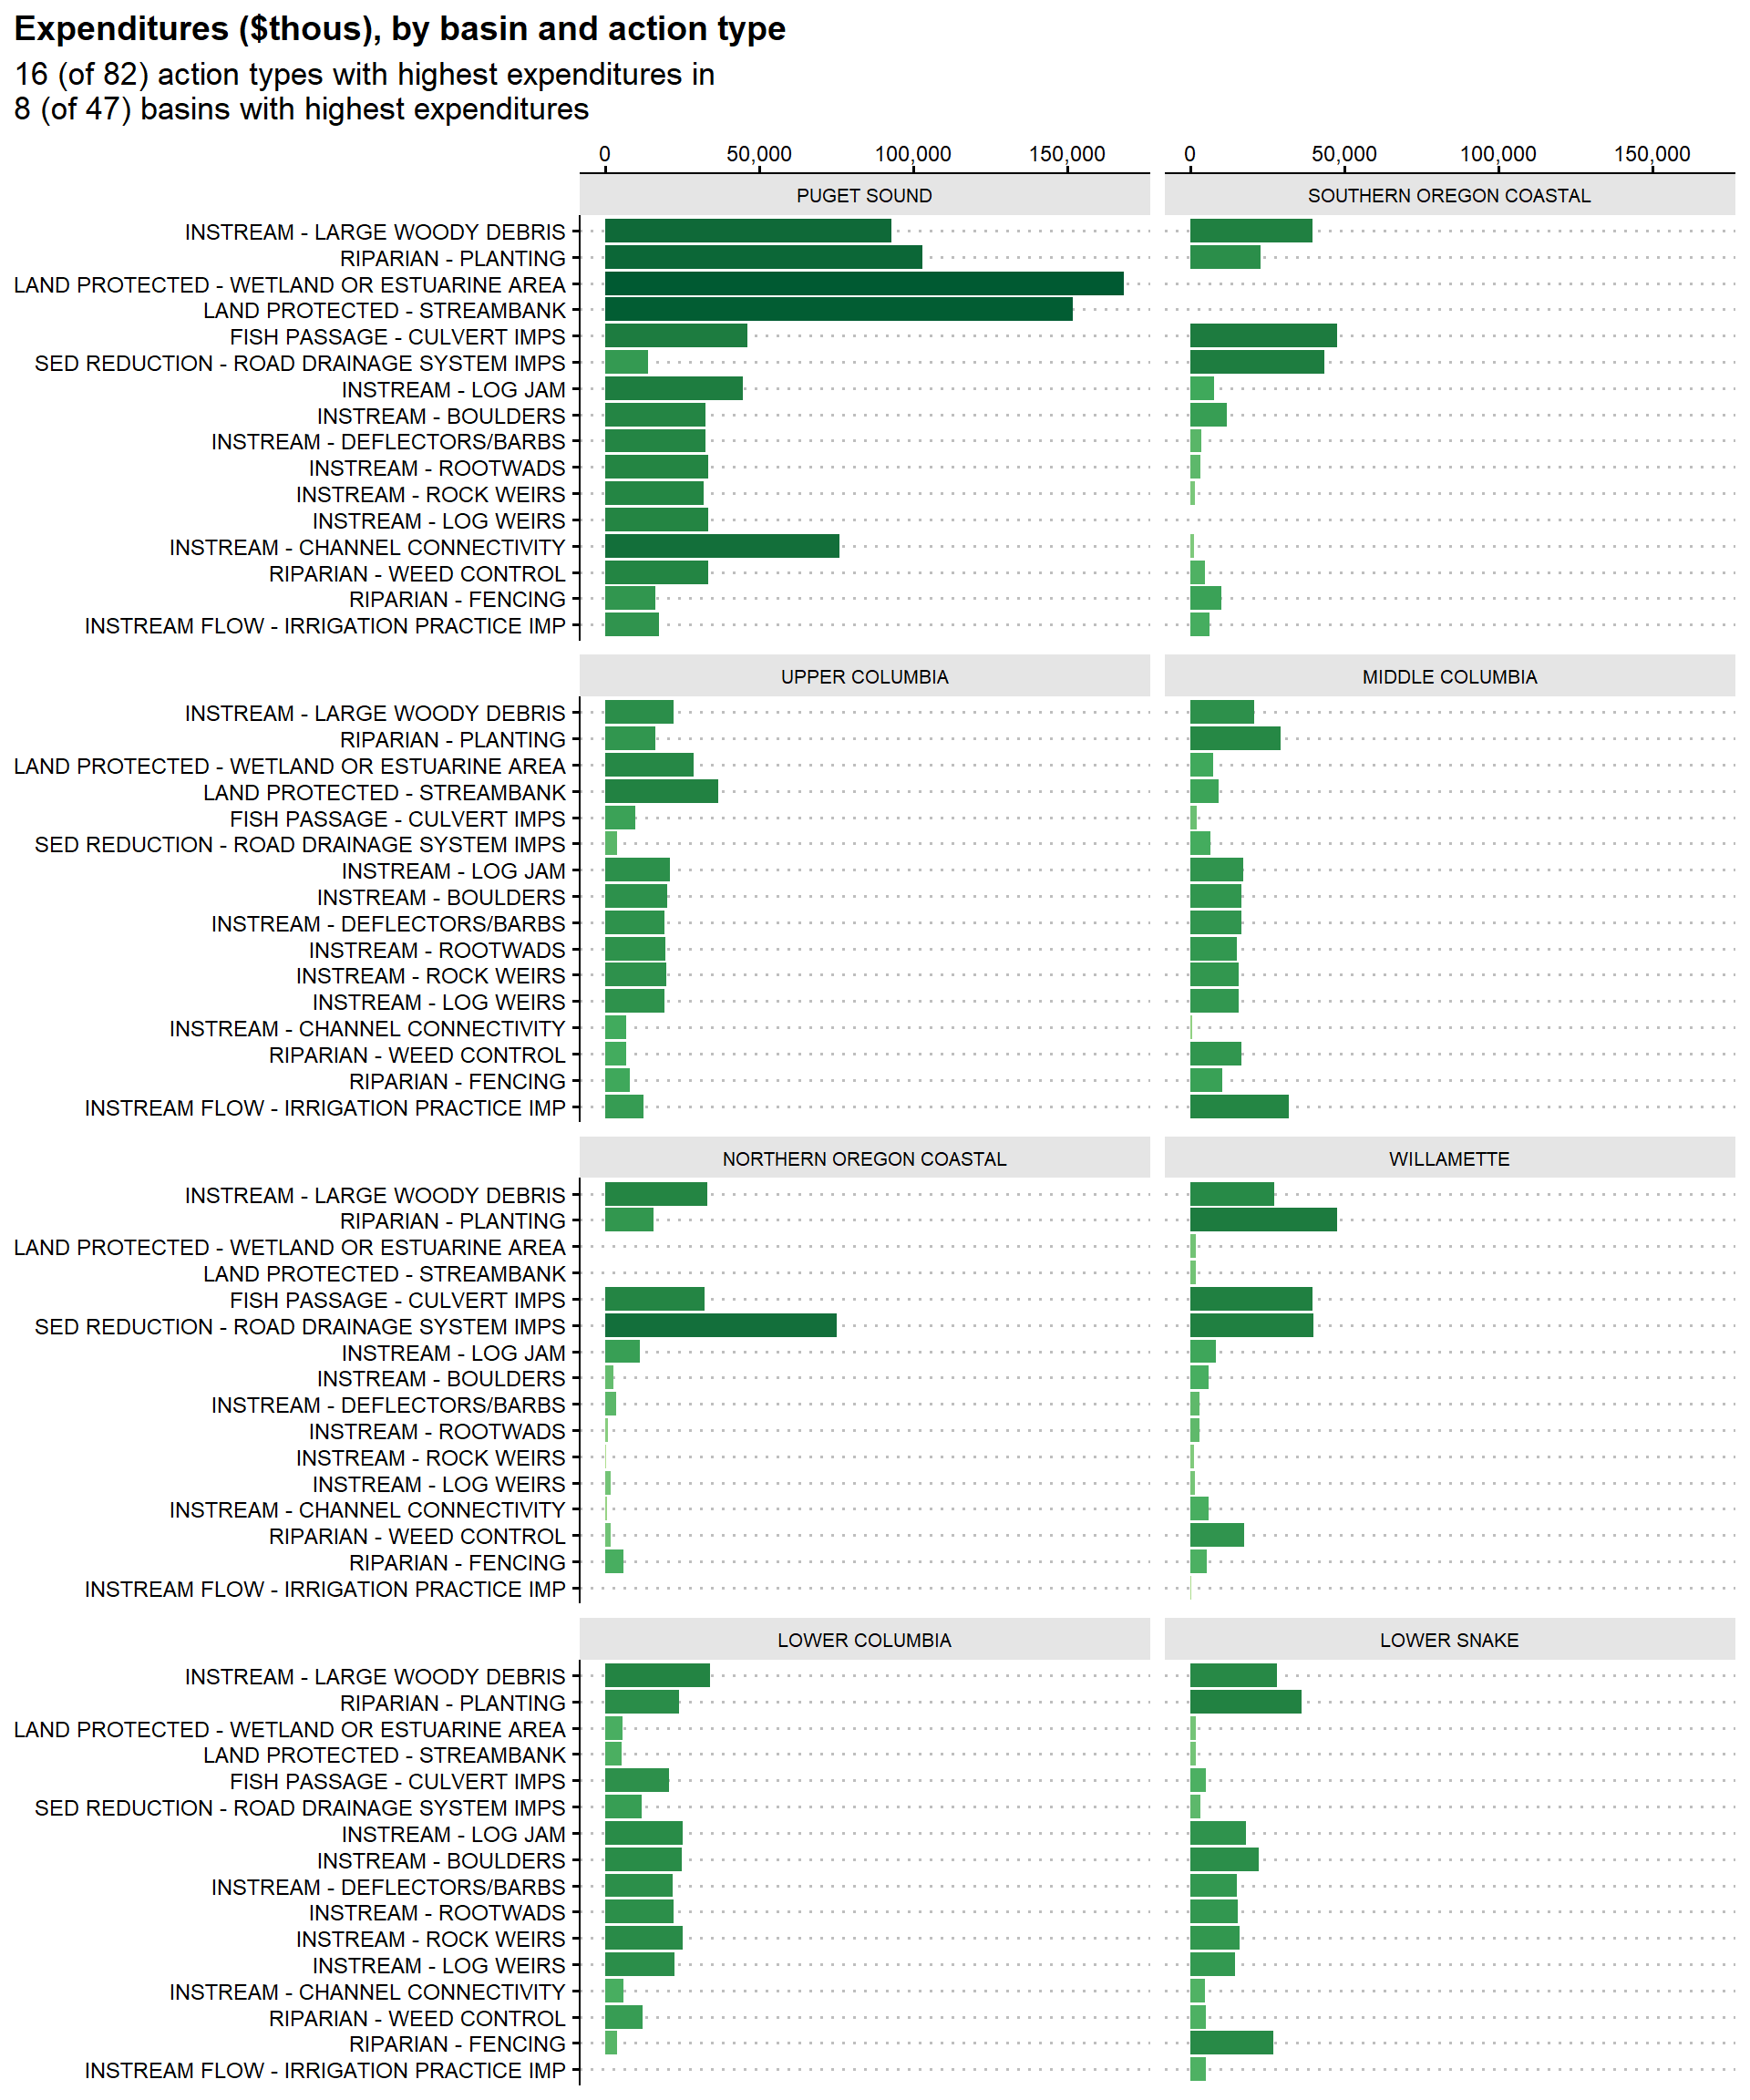
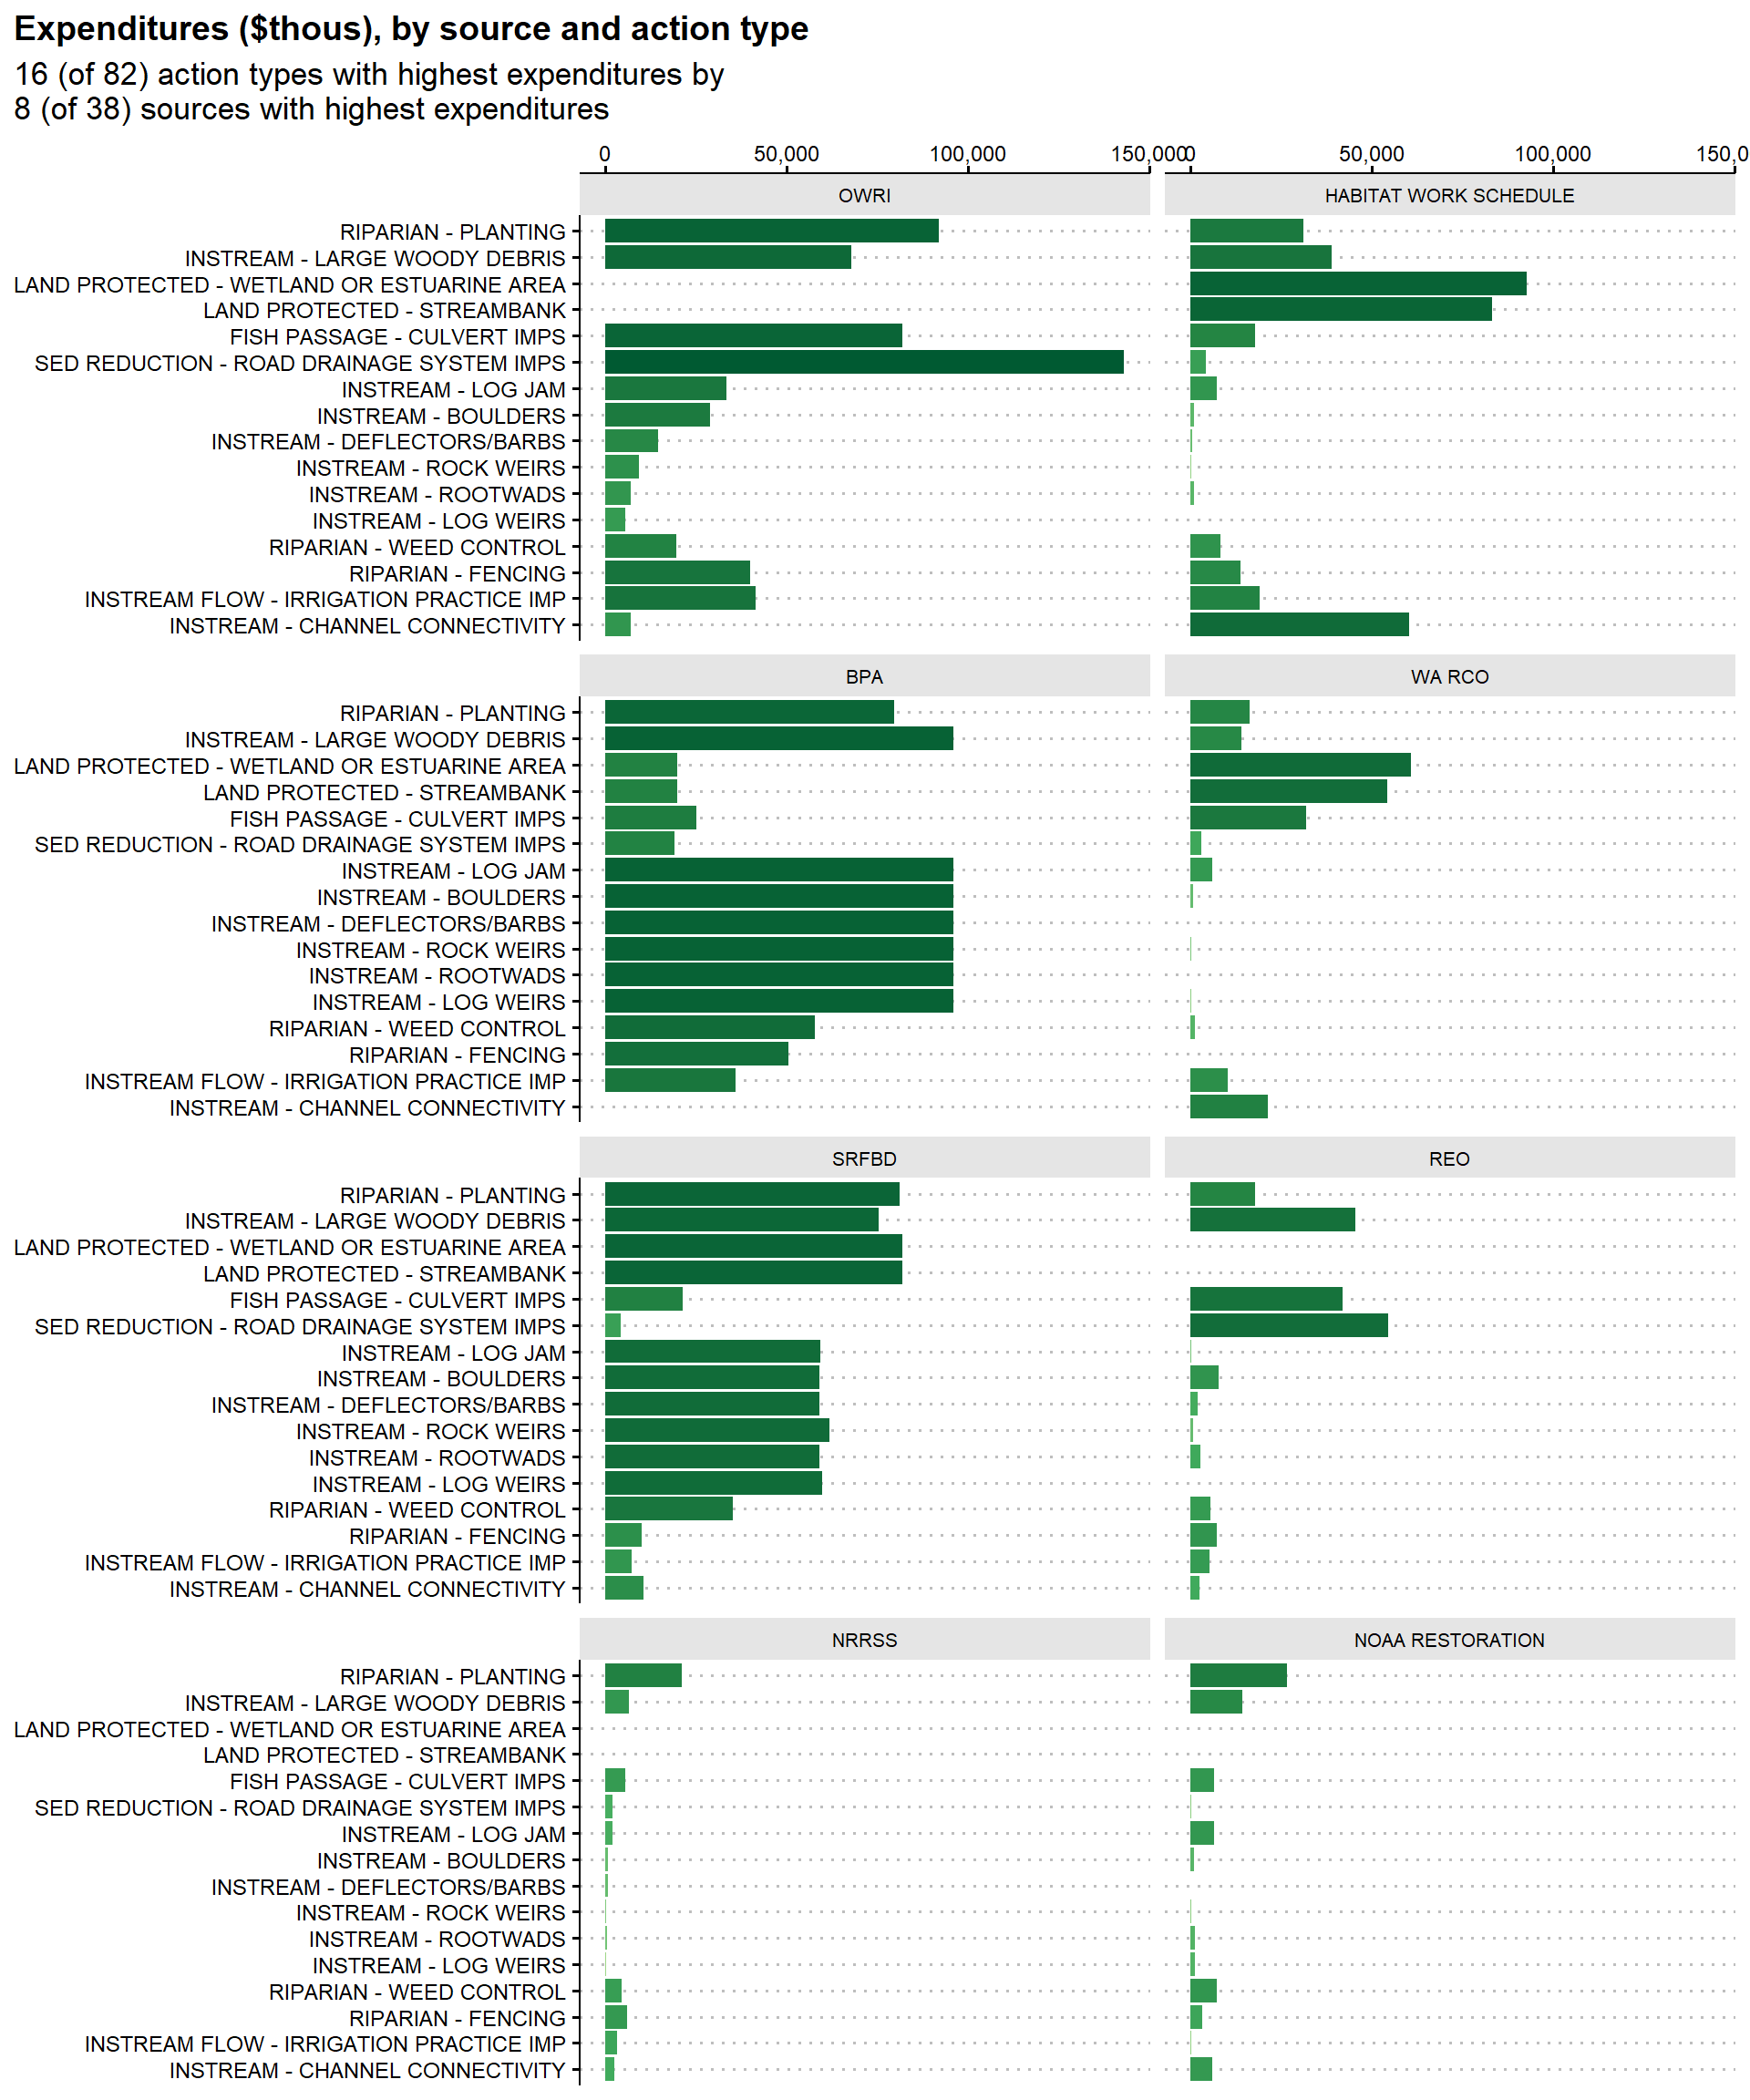
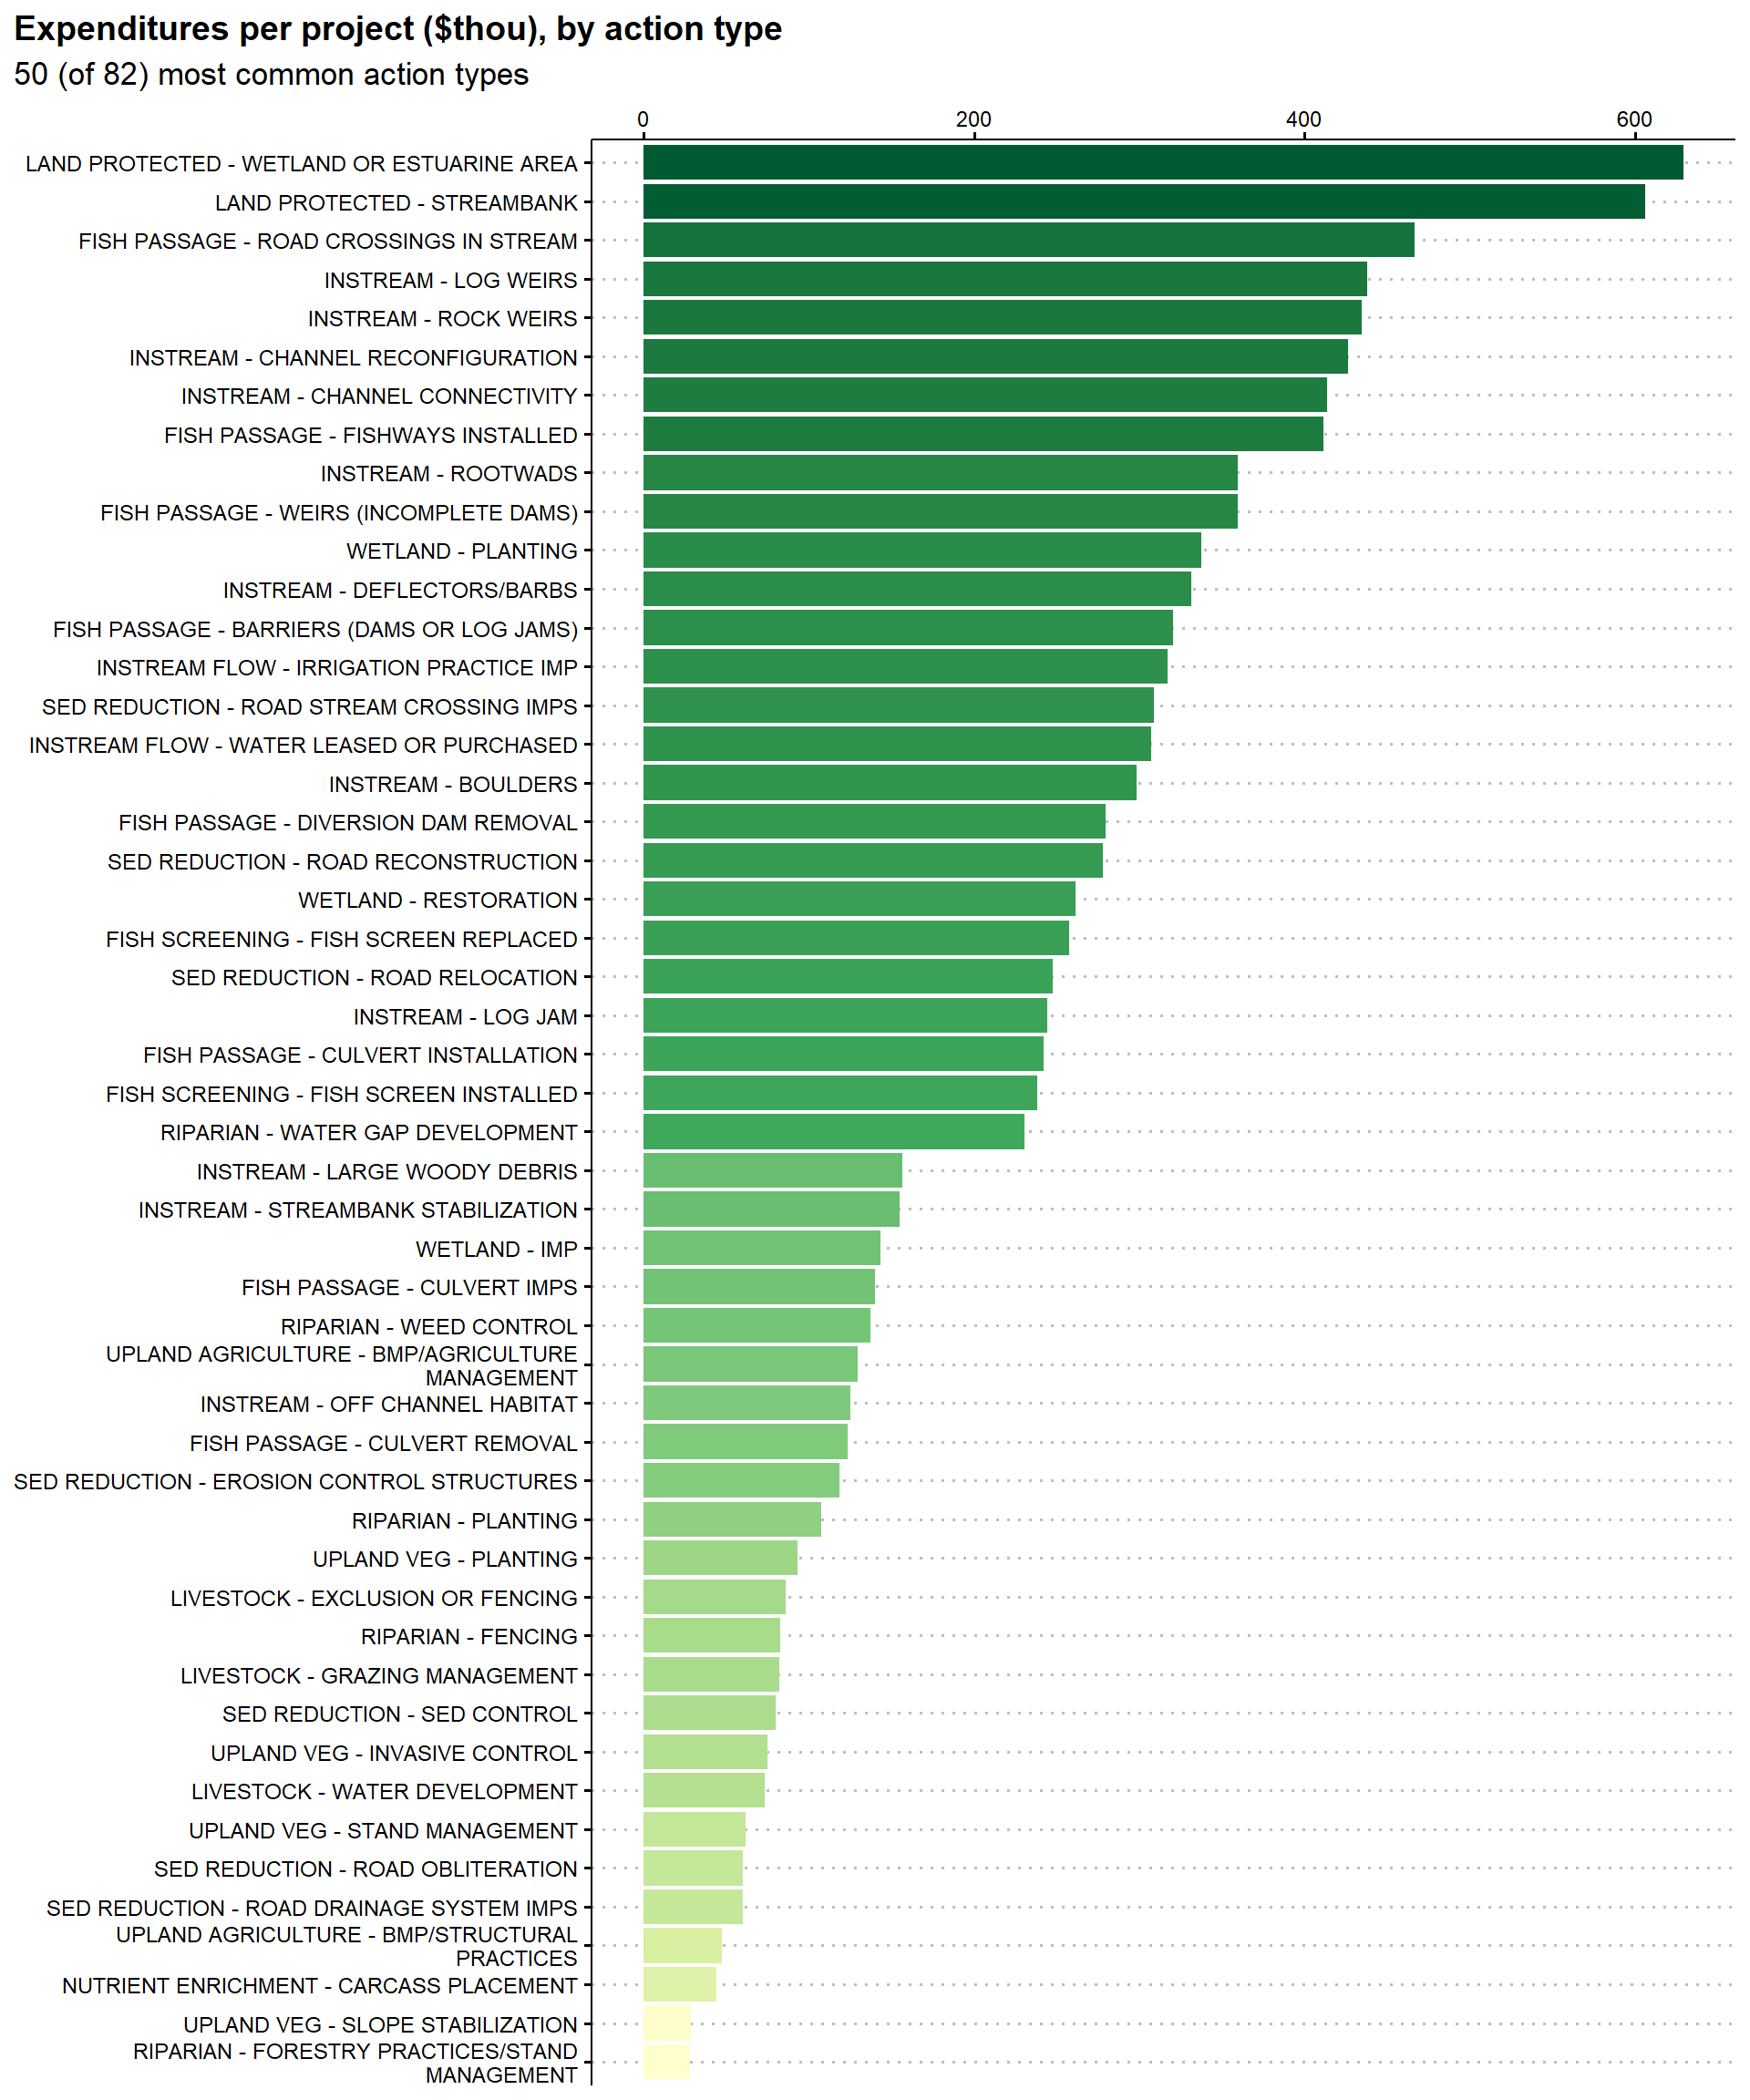
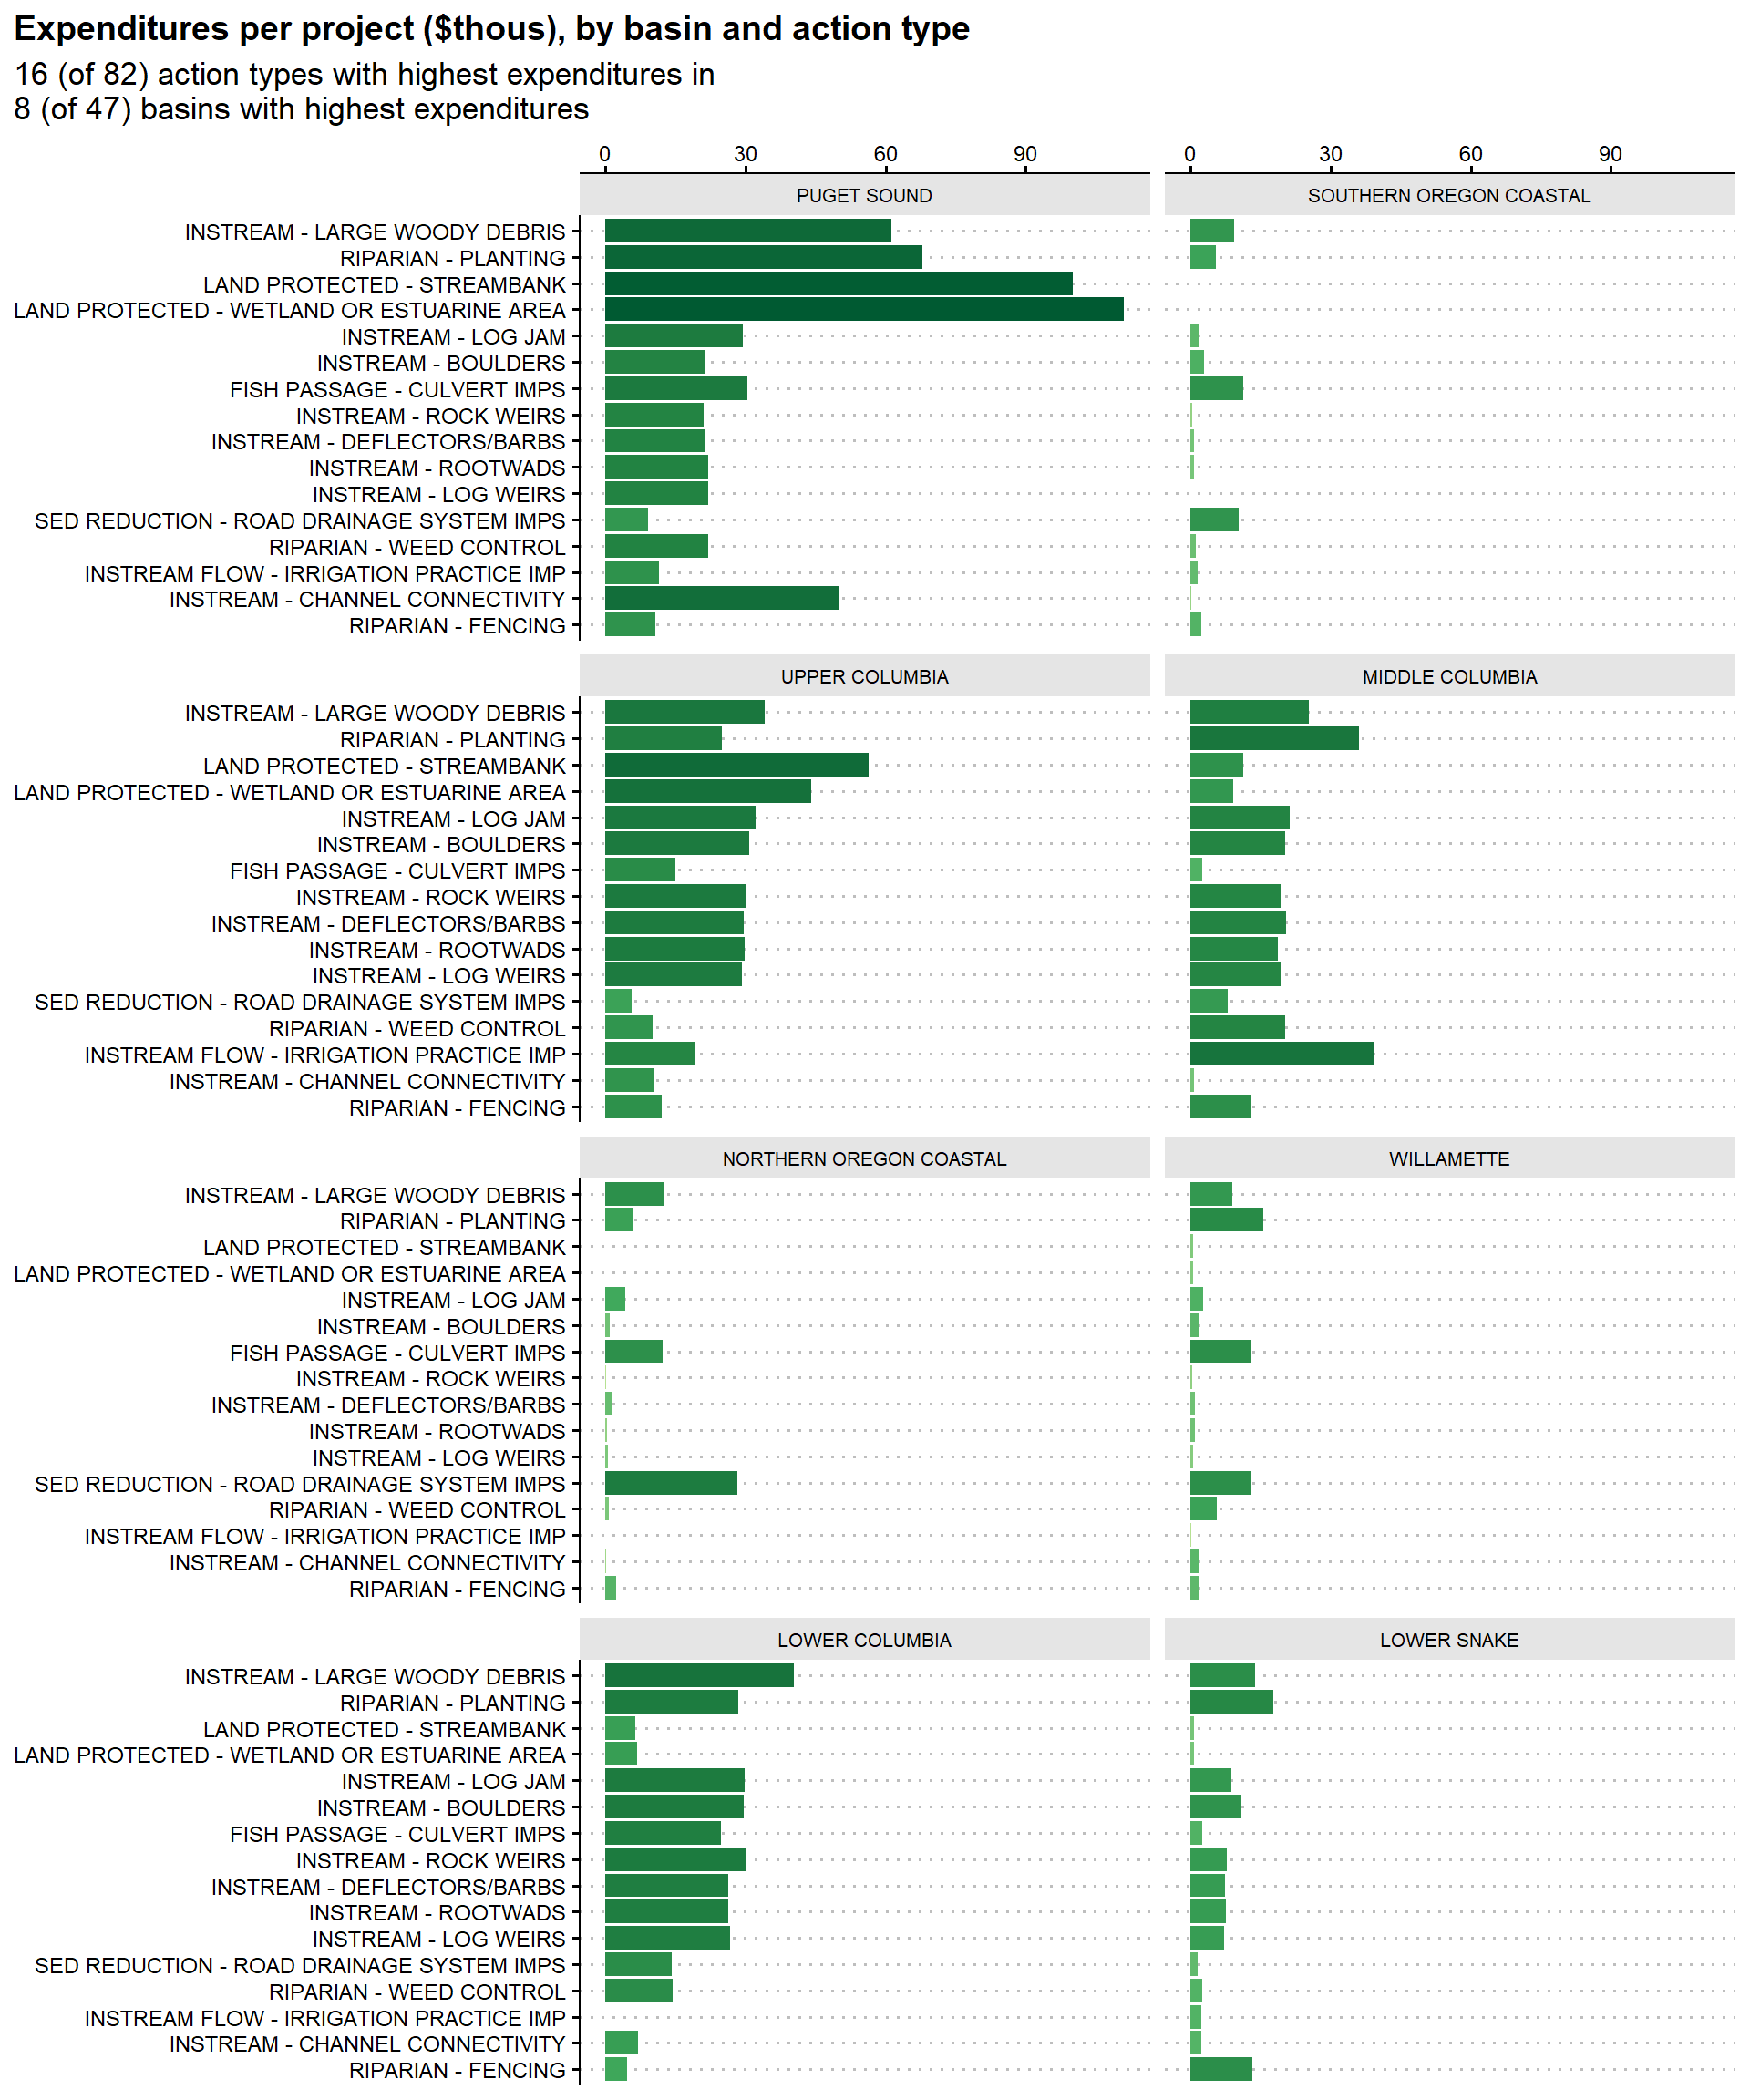
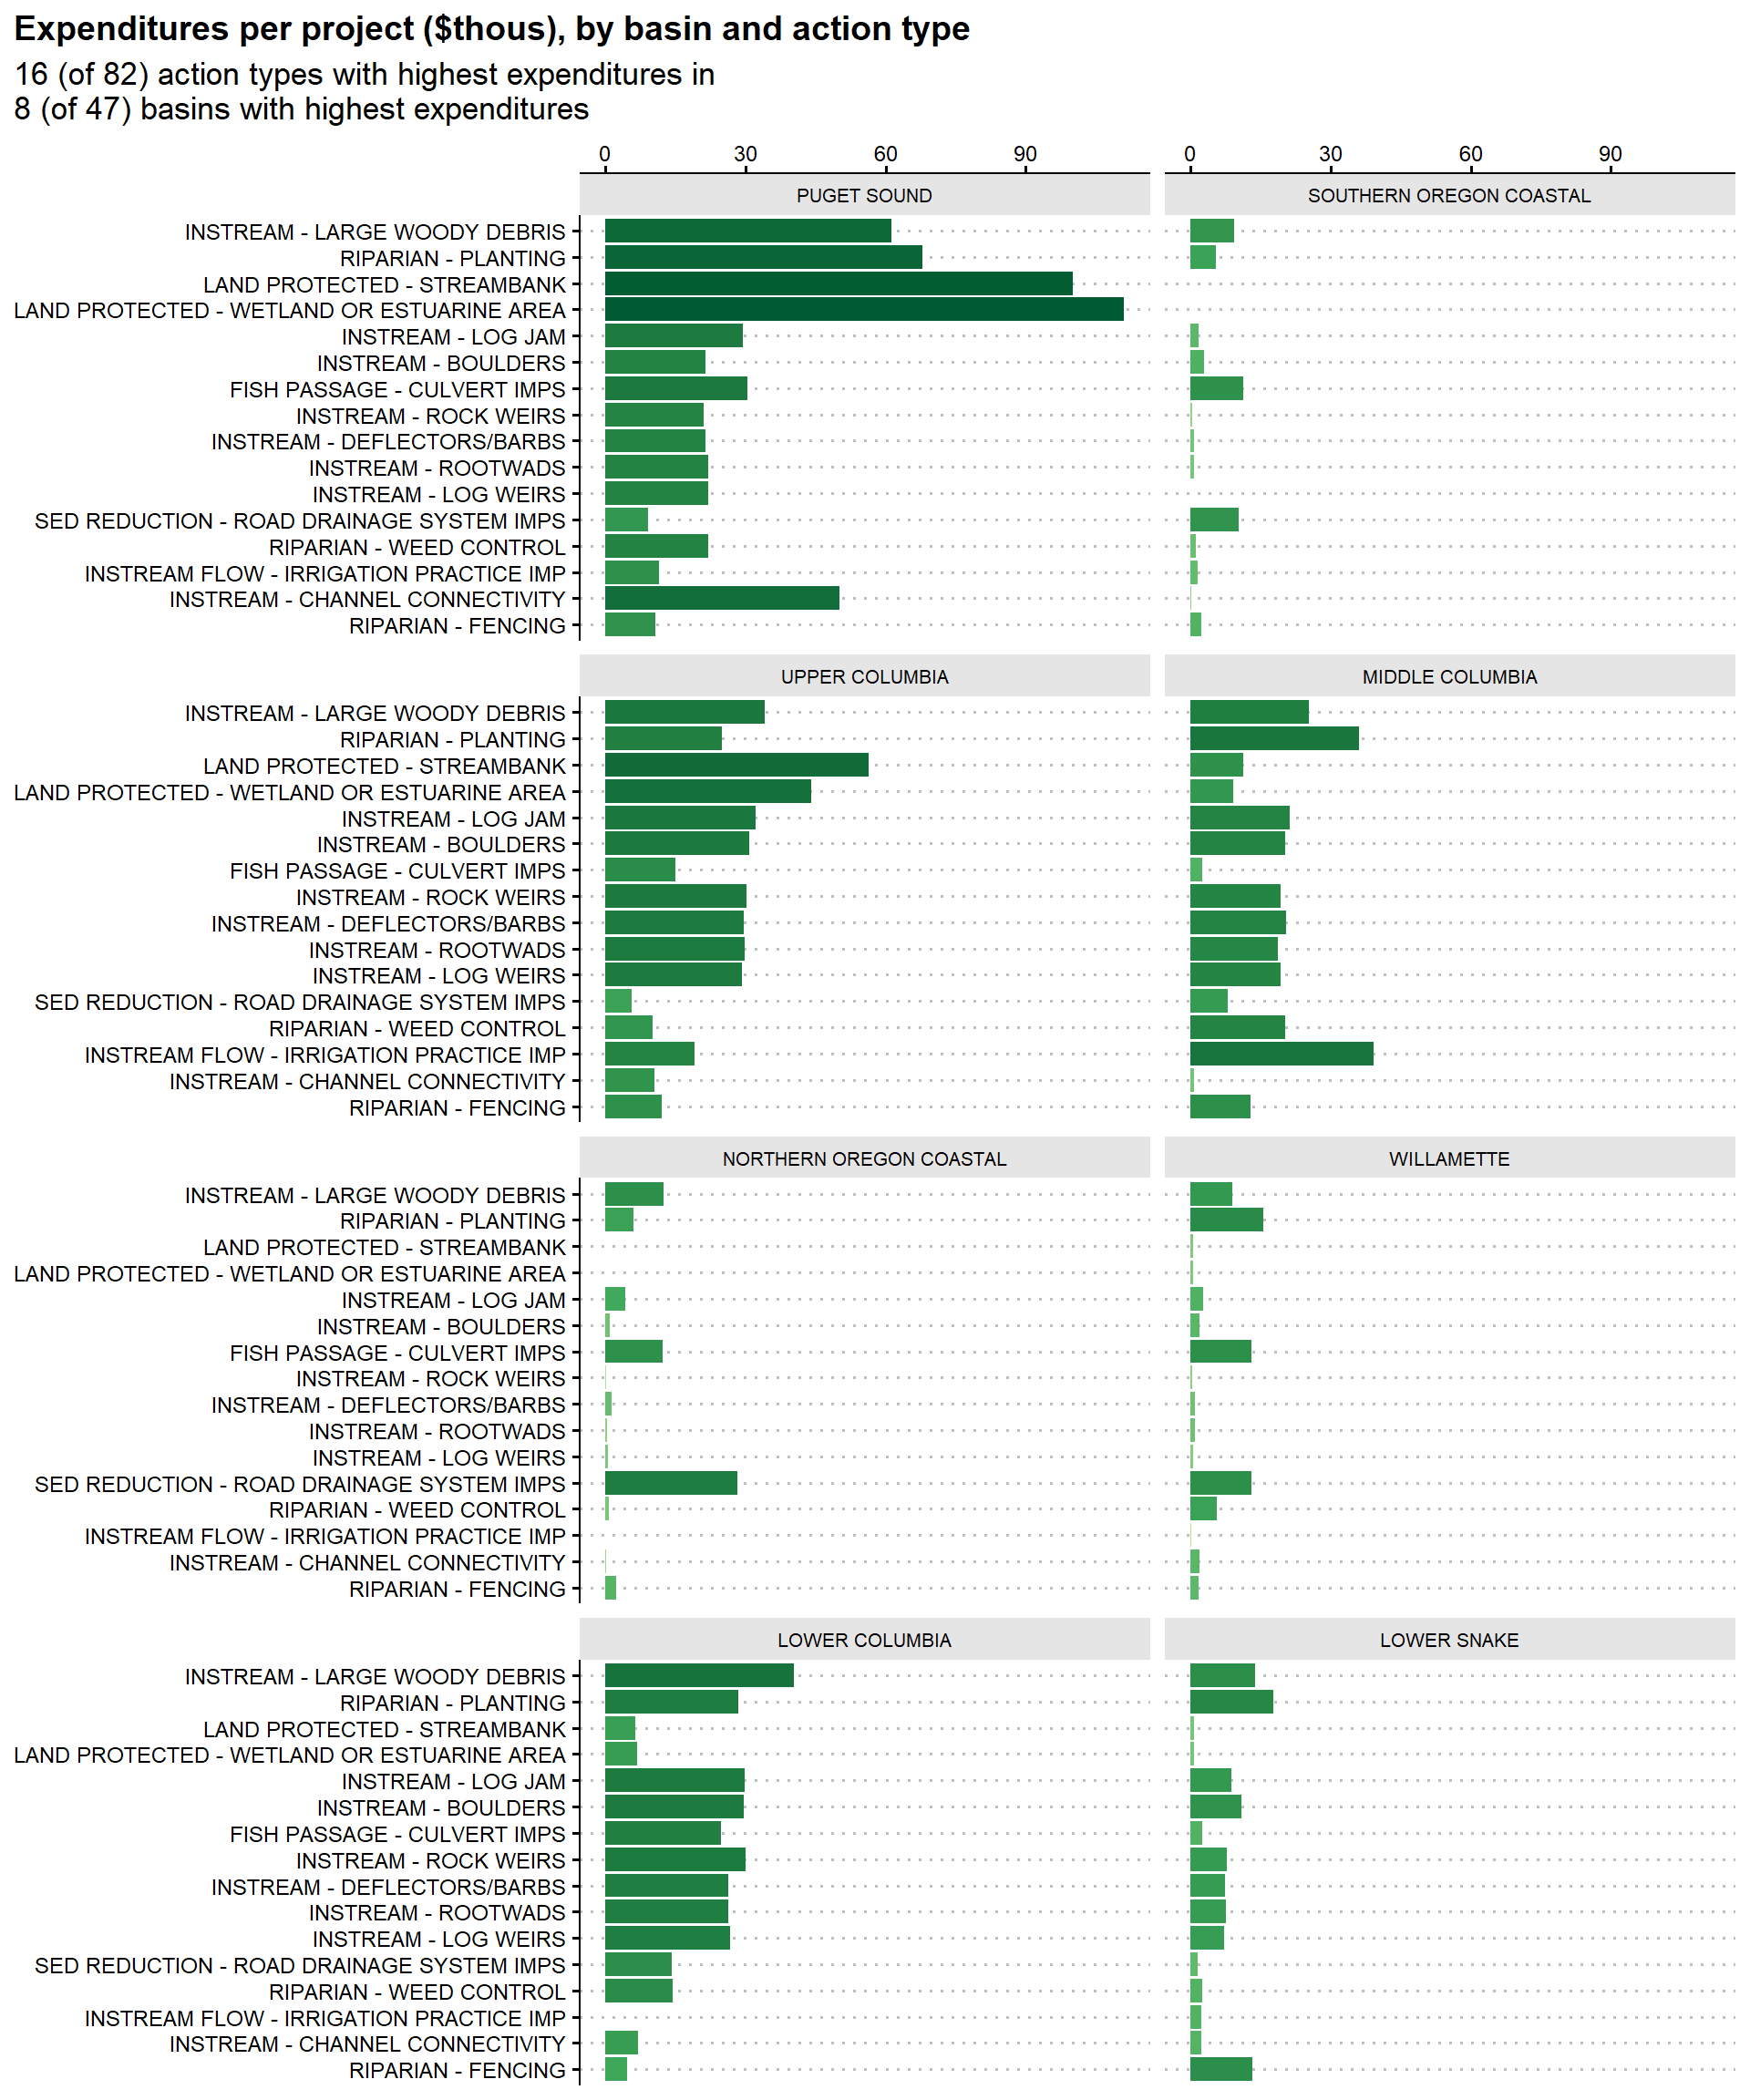
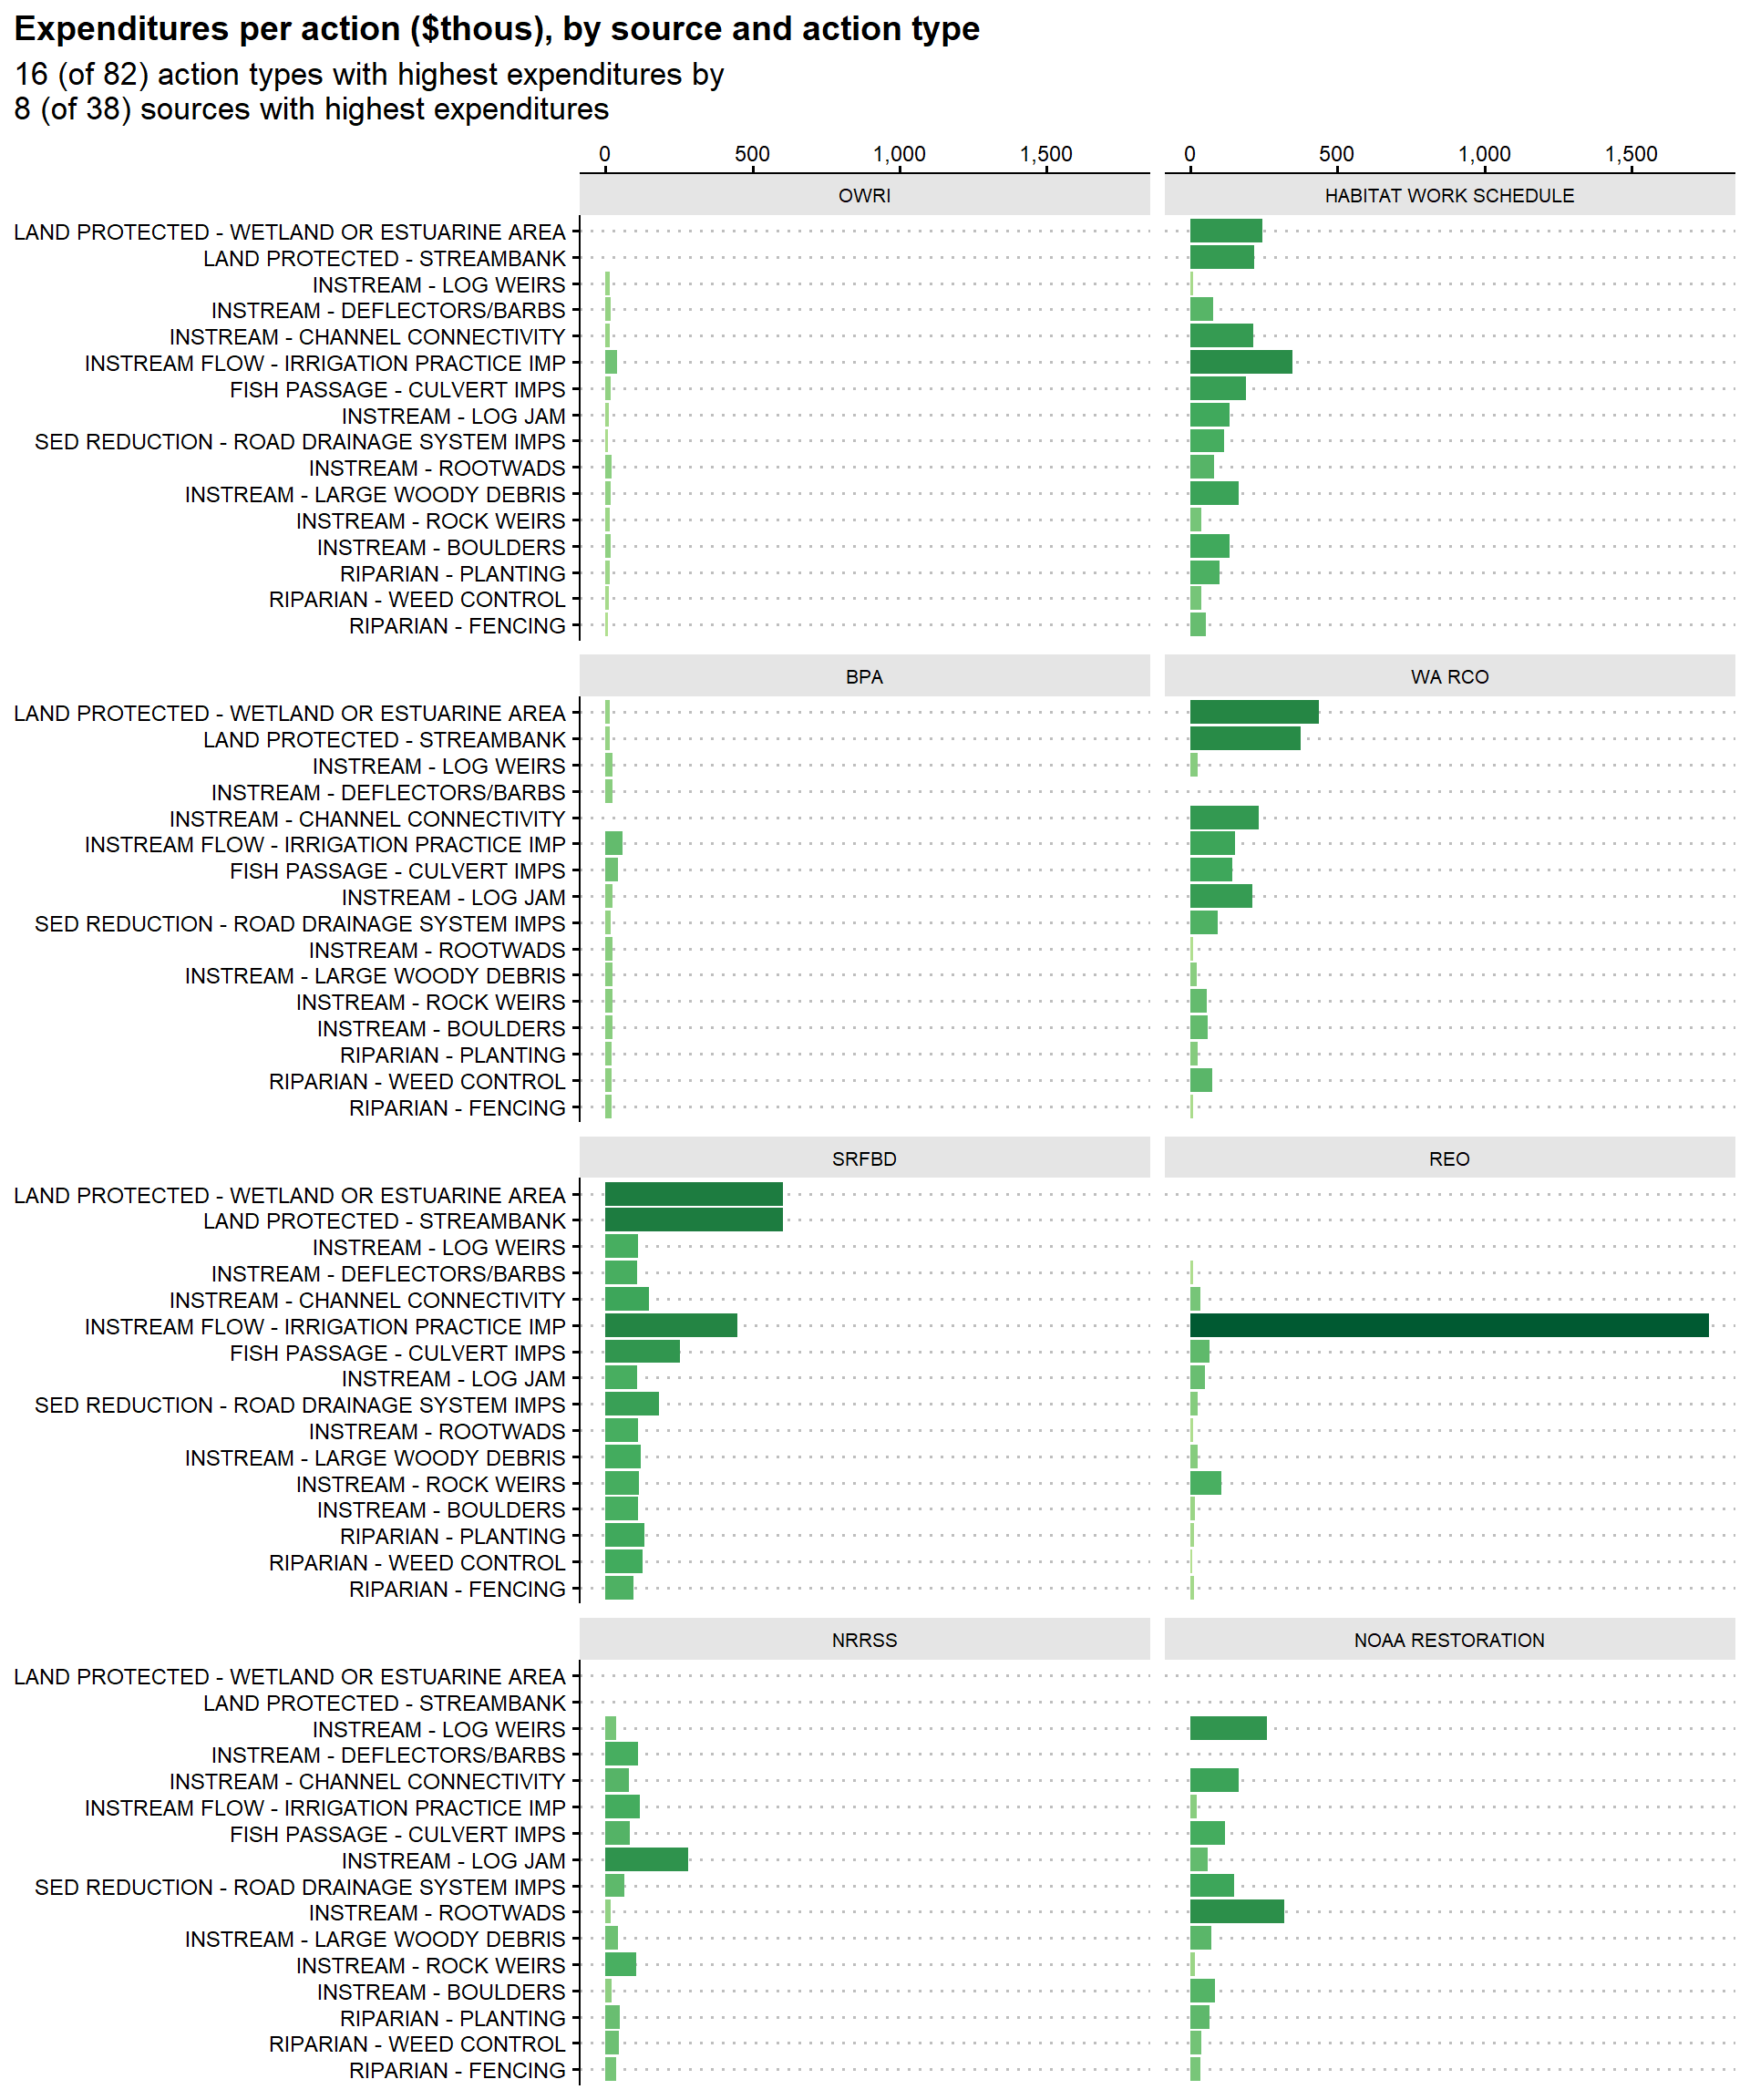
For figures that break down expenditures by action type, note that these are expenditures on projects that include at least one instance of that action type. That is, expenditures per action under the INSTREAM - LARGE WOODY DEBRIS action type would be expenditures per action for projects that include that action type as opposed to expenditures per action of that action type. For projects with multiple action types, we cannot distinguish between spending on each action type.
Total
By Year
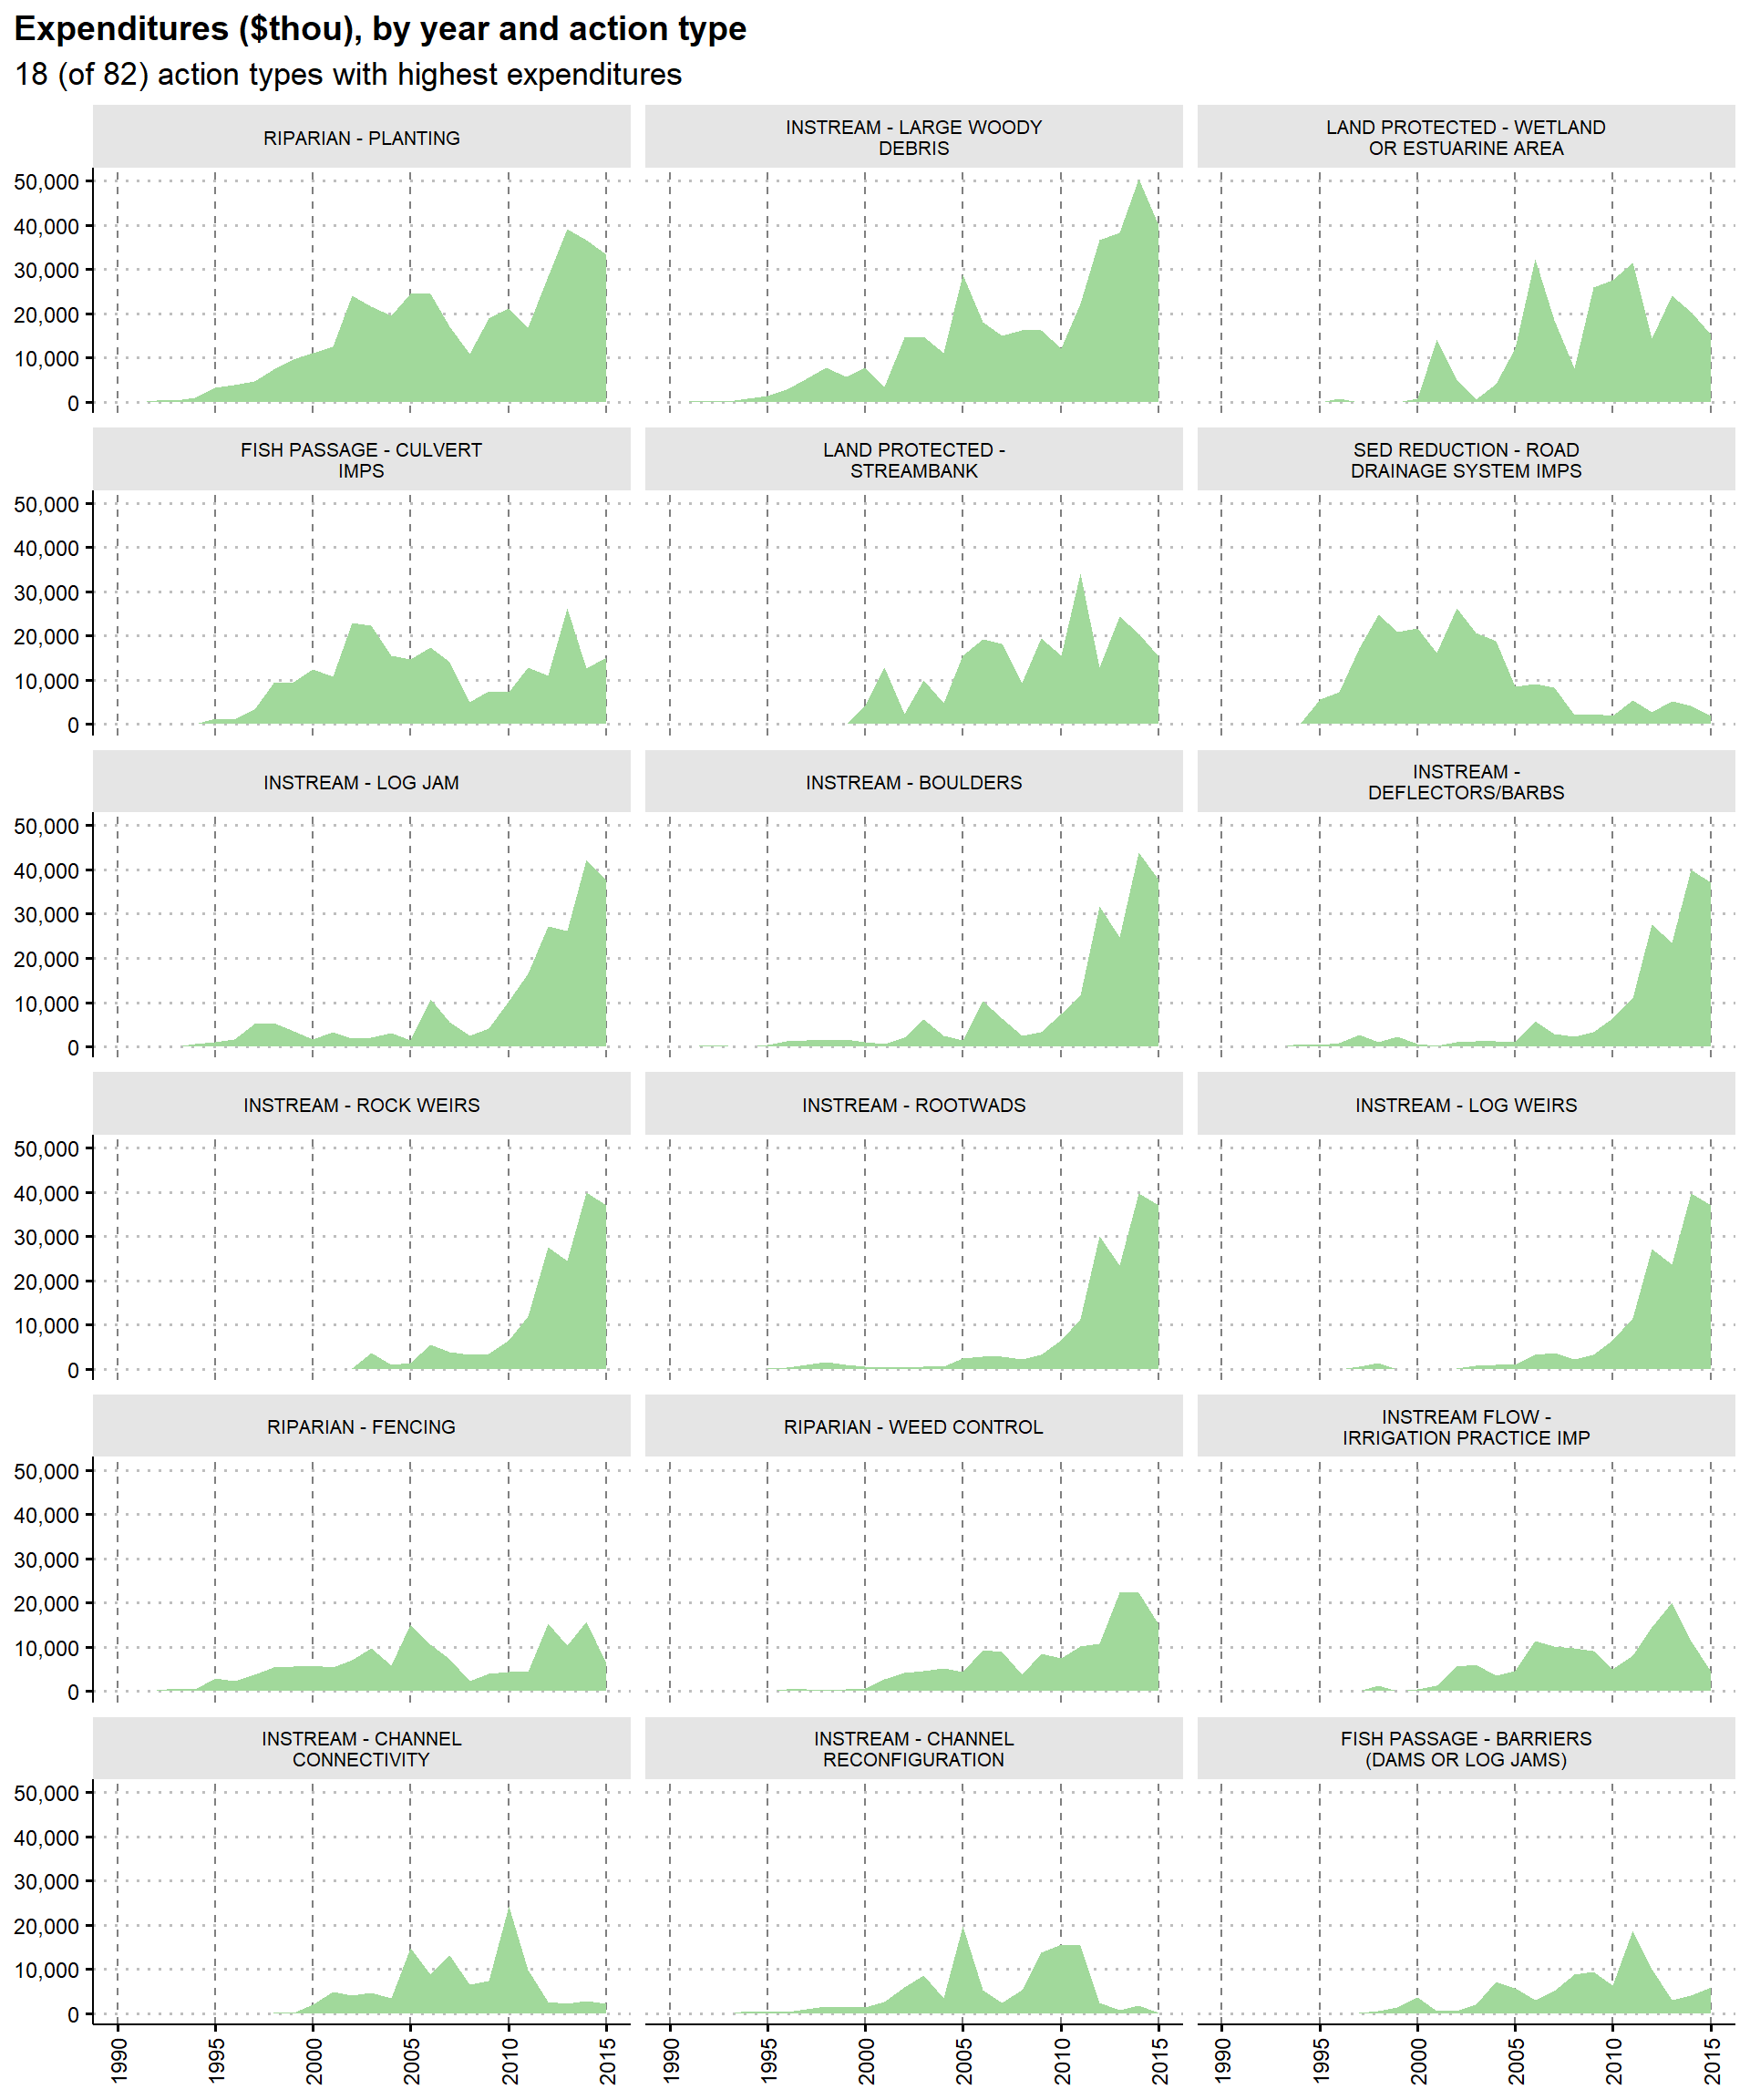
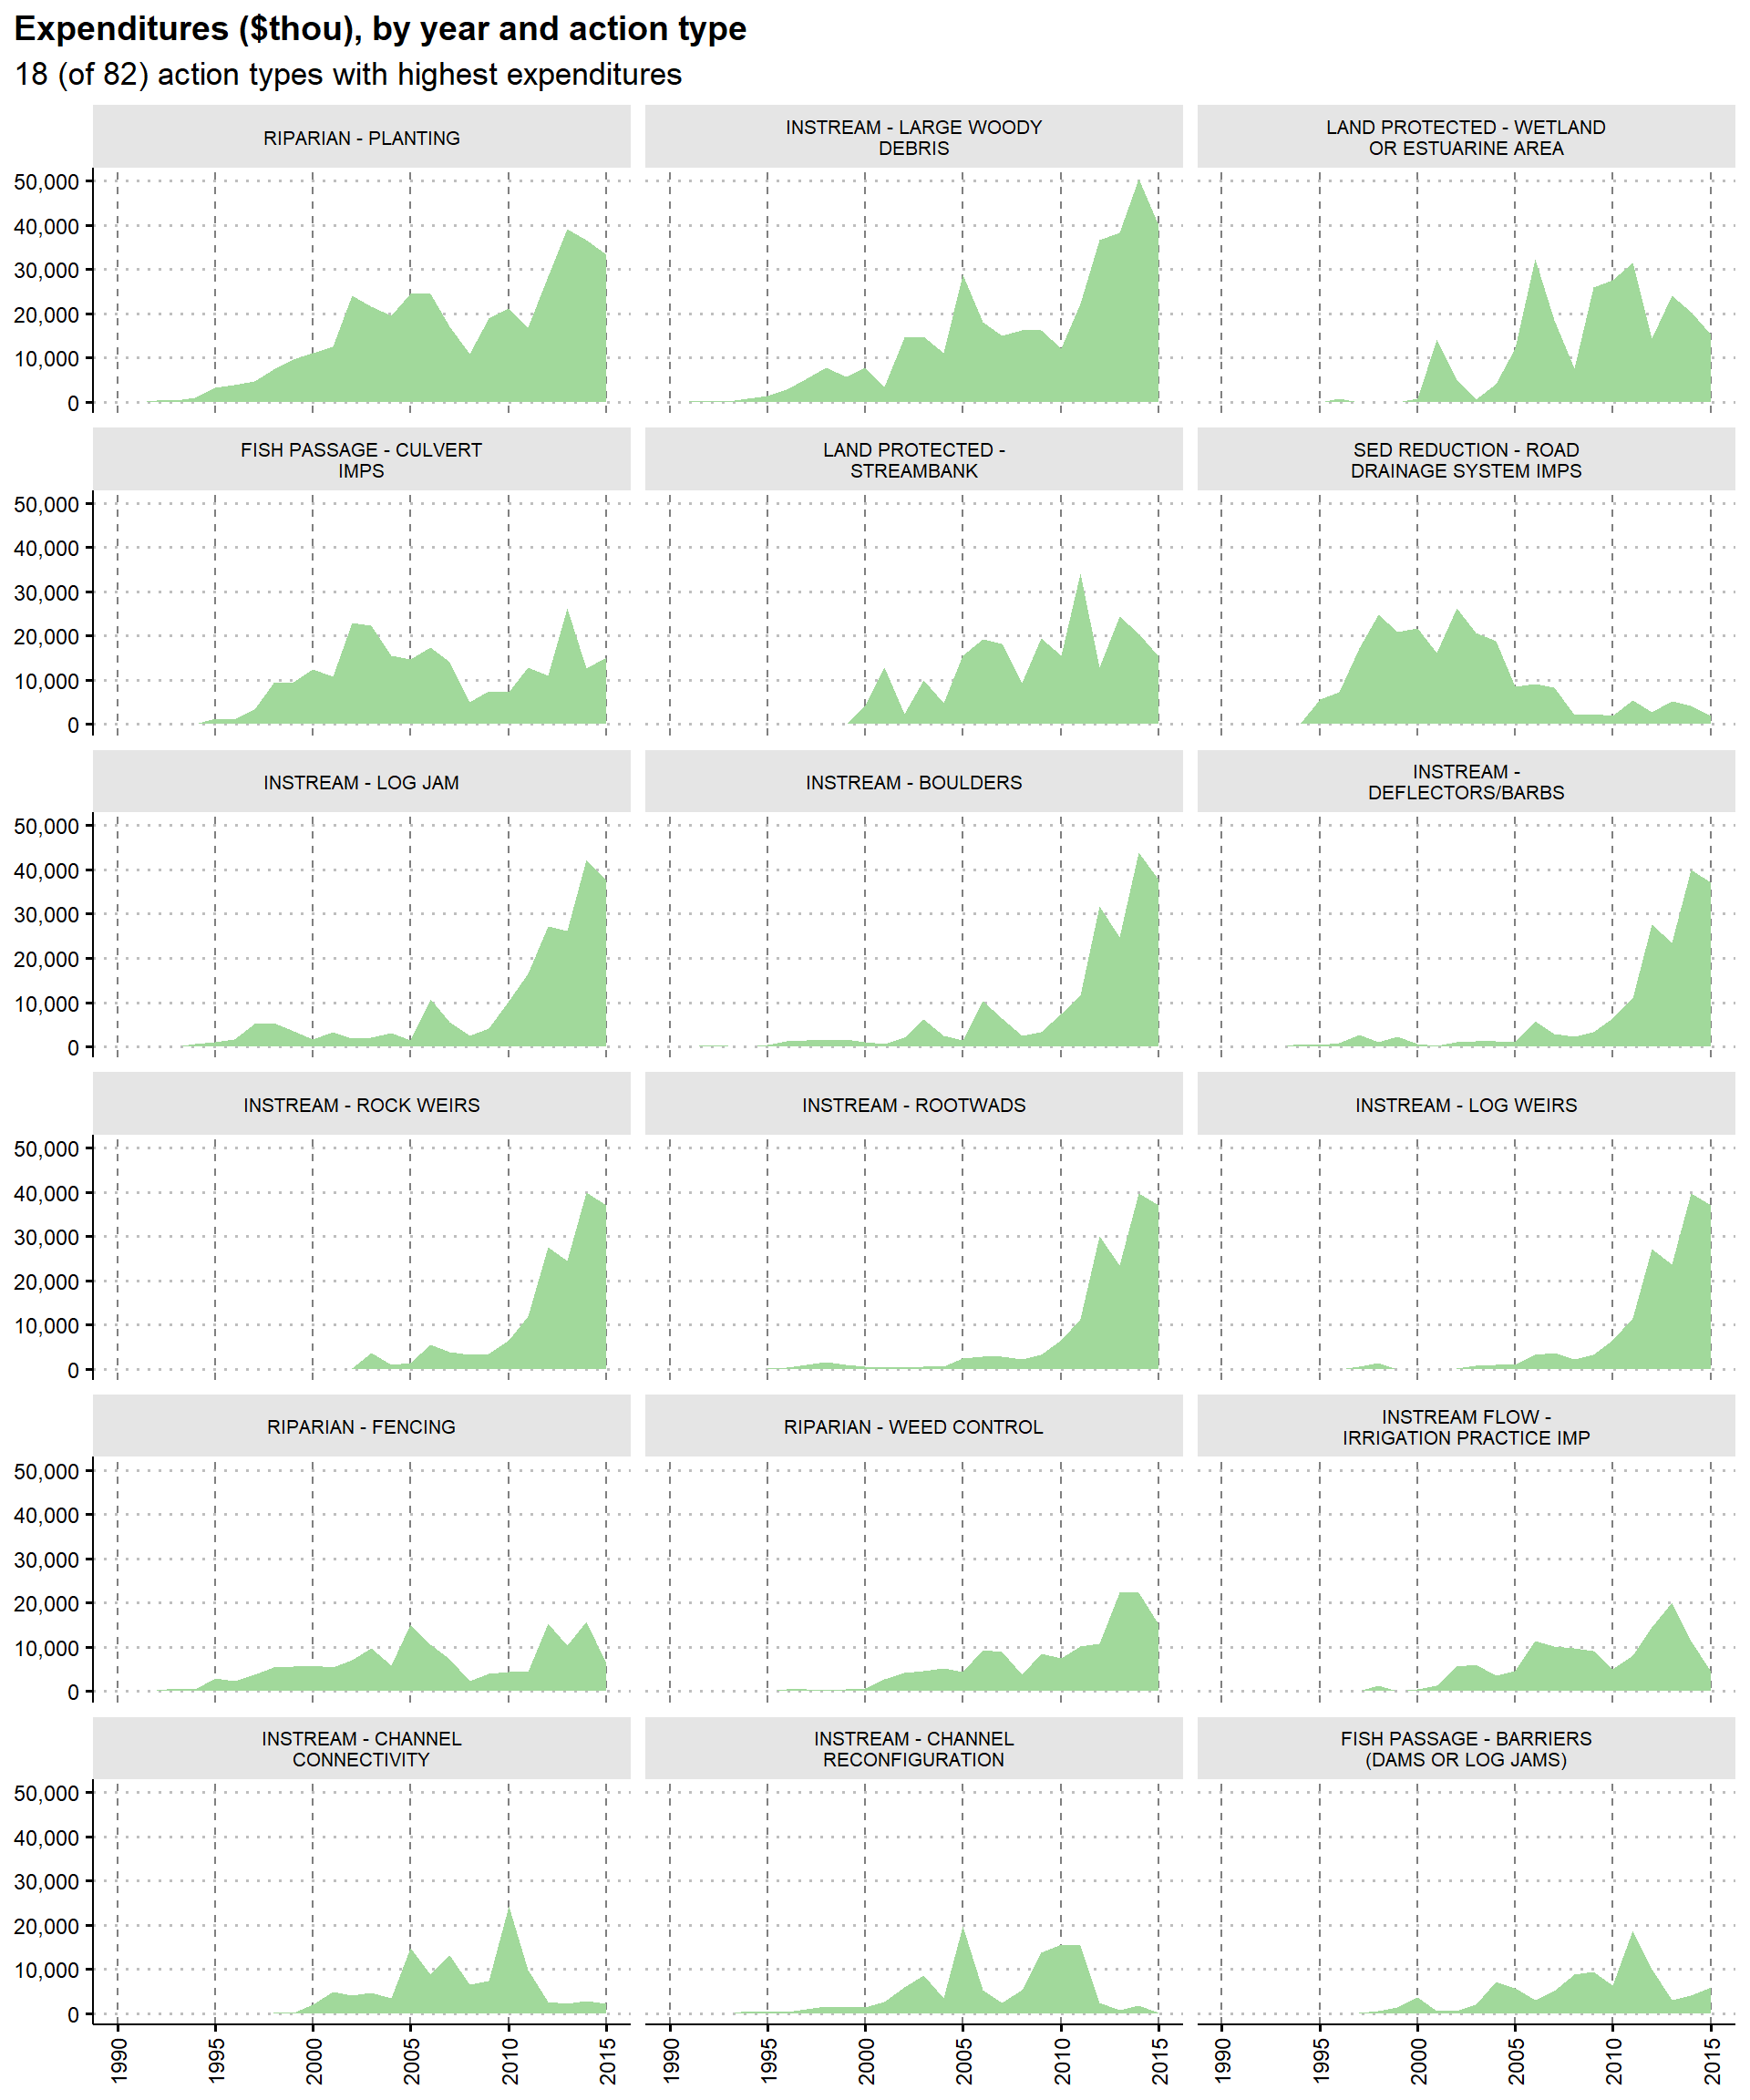
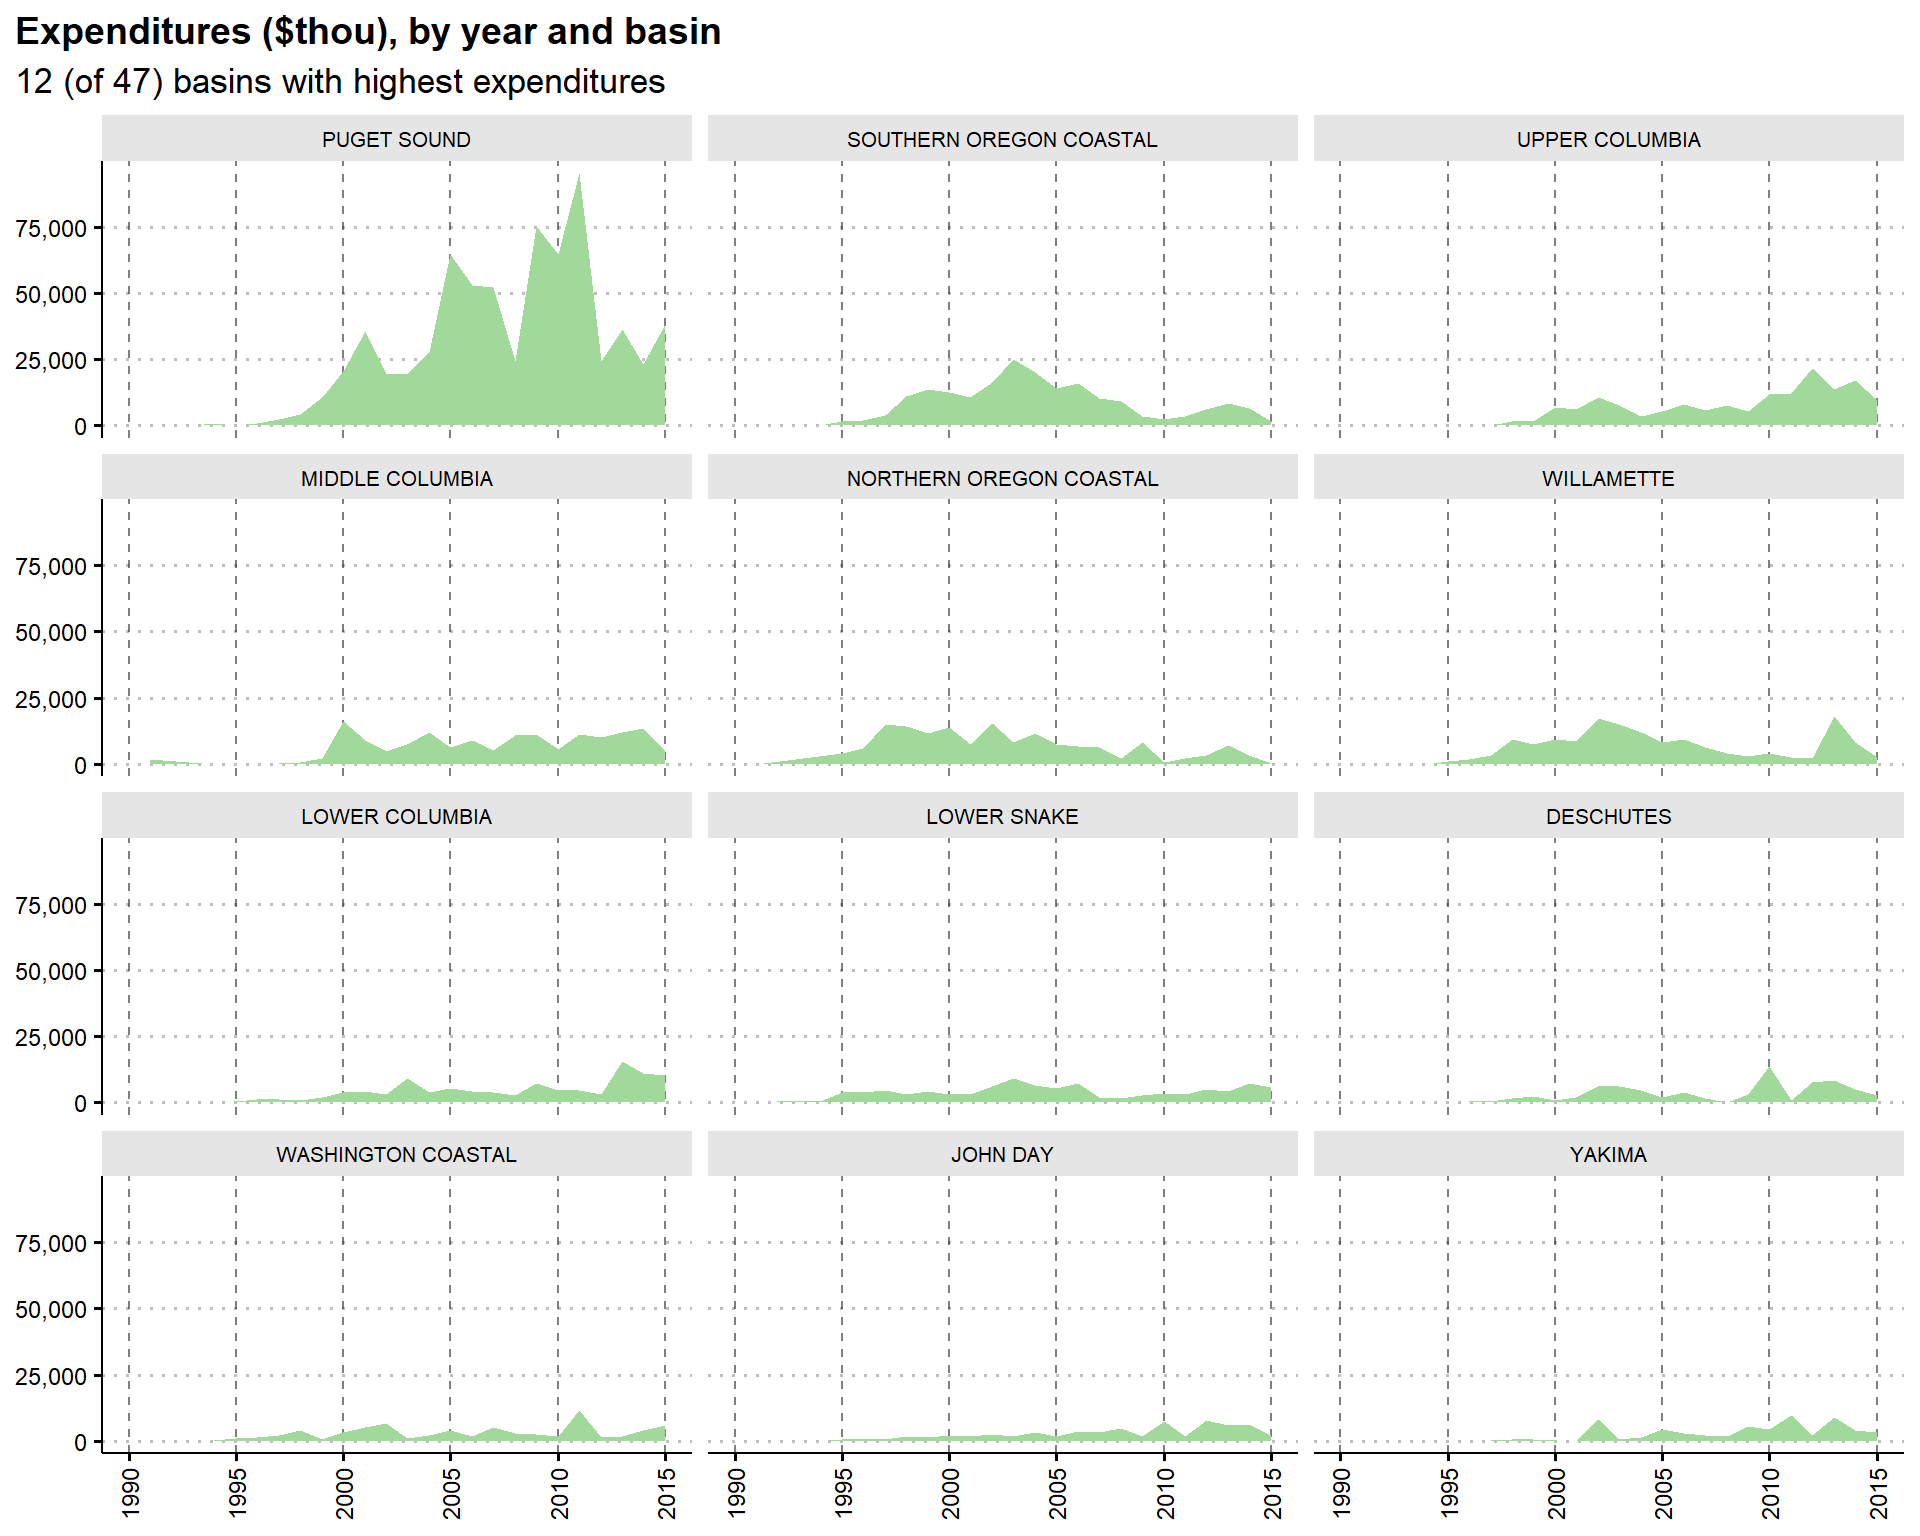
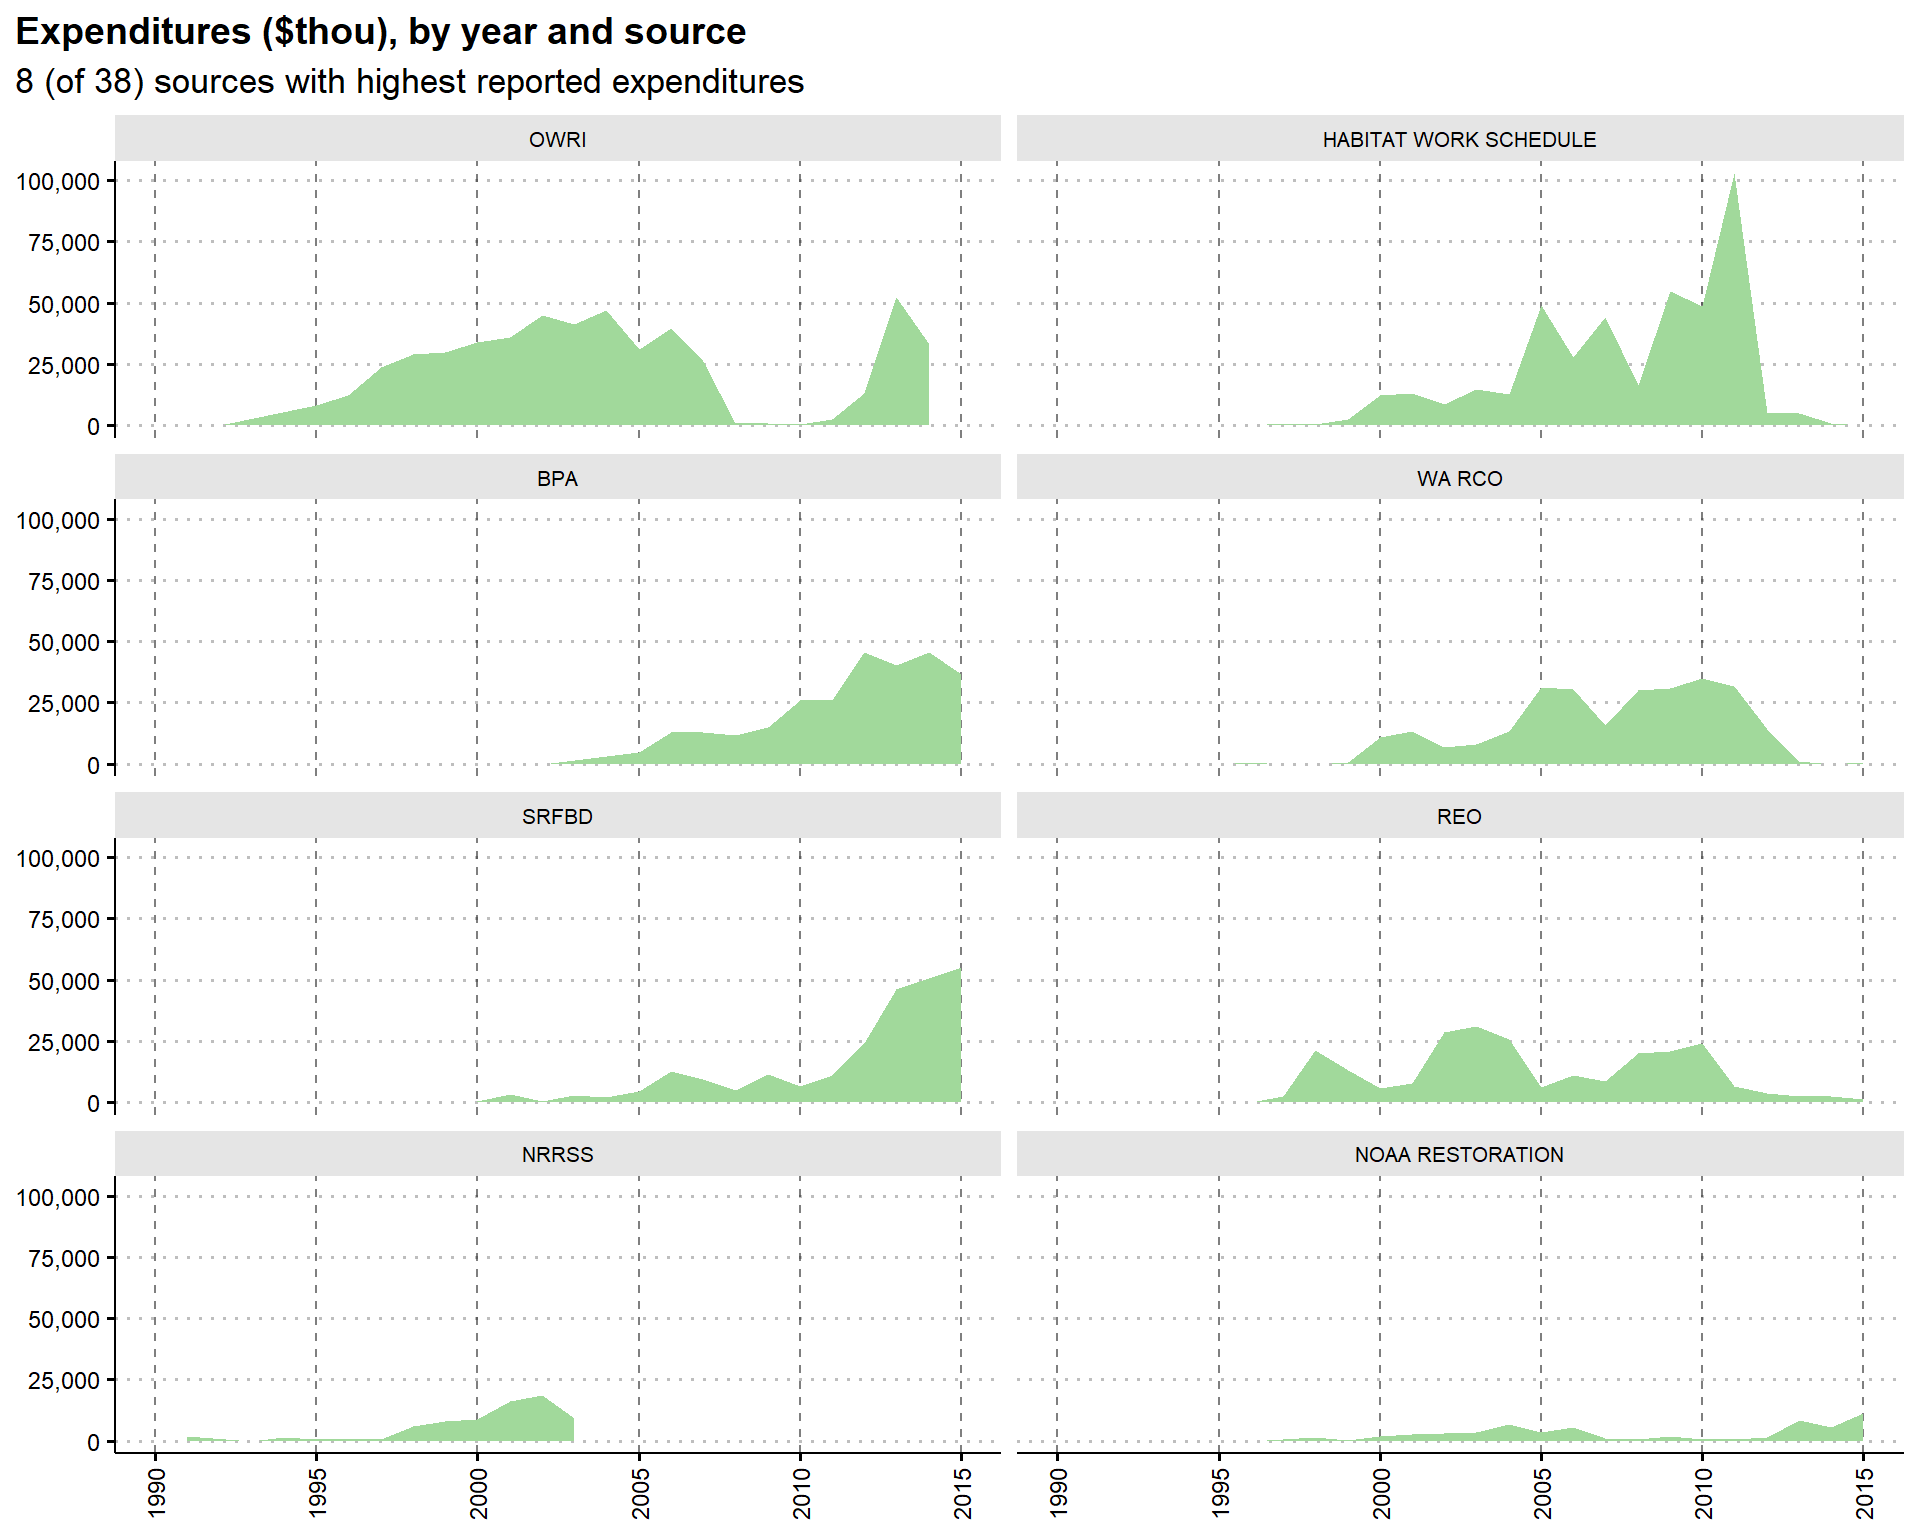
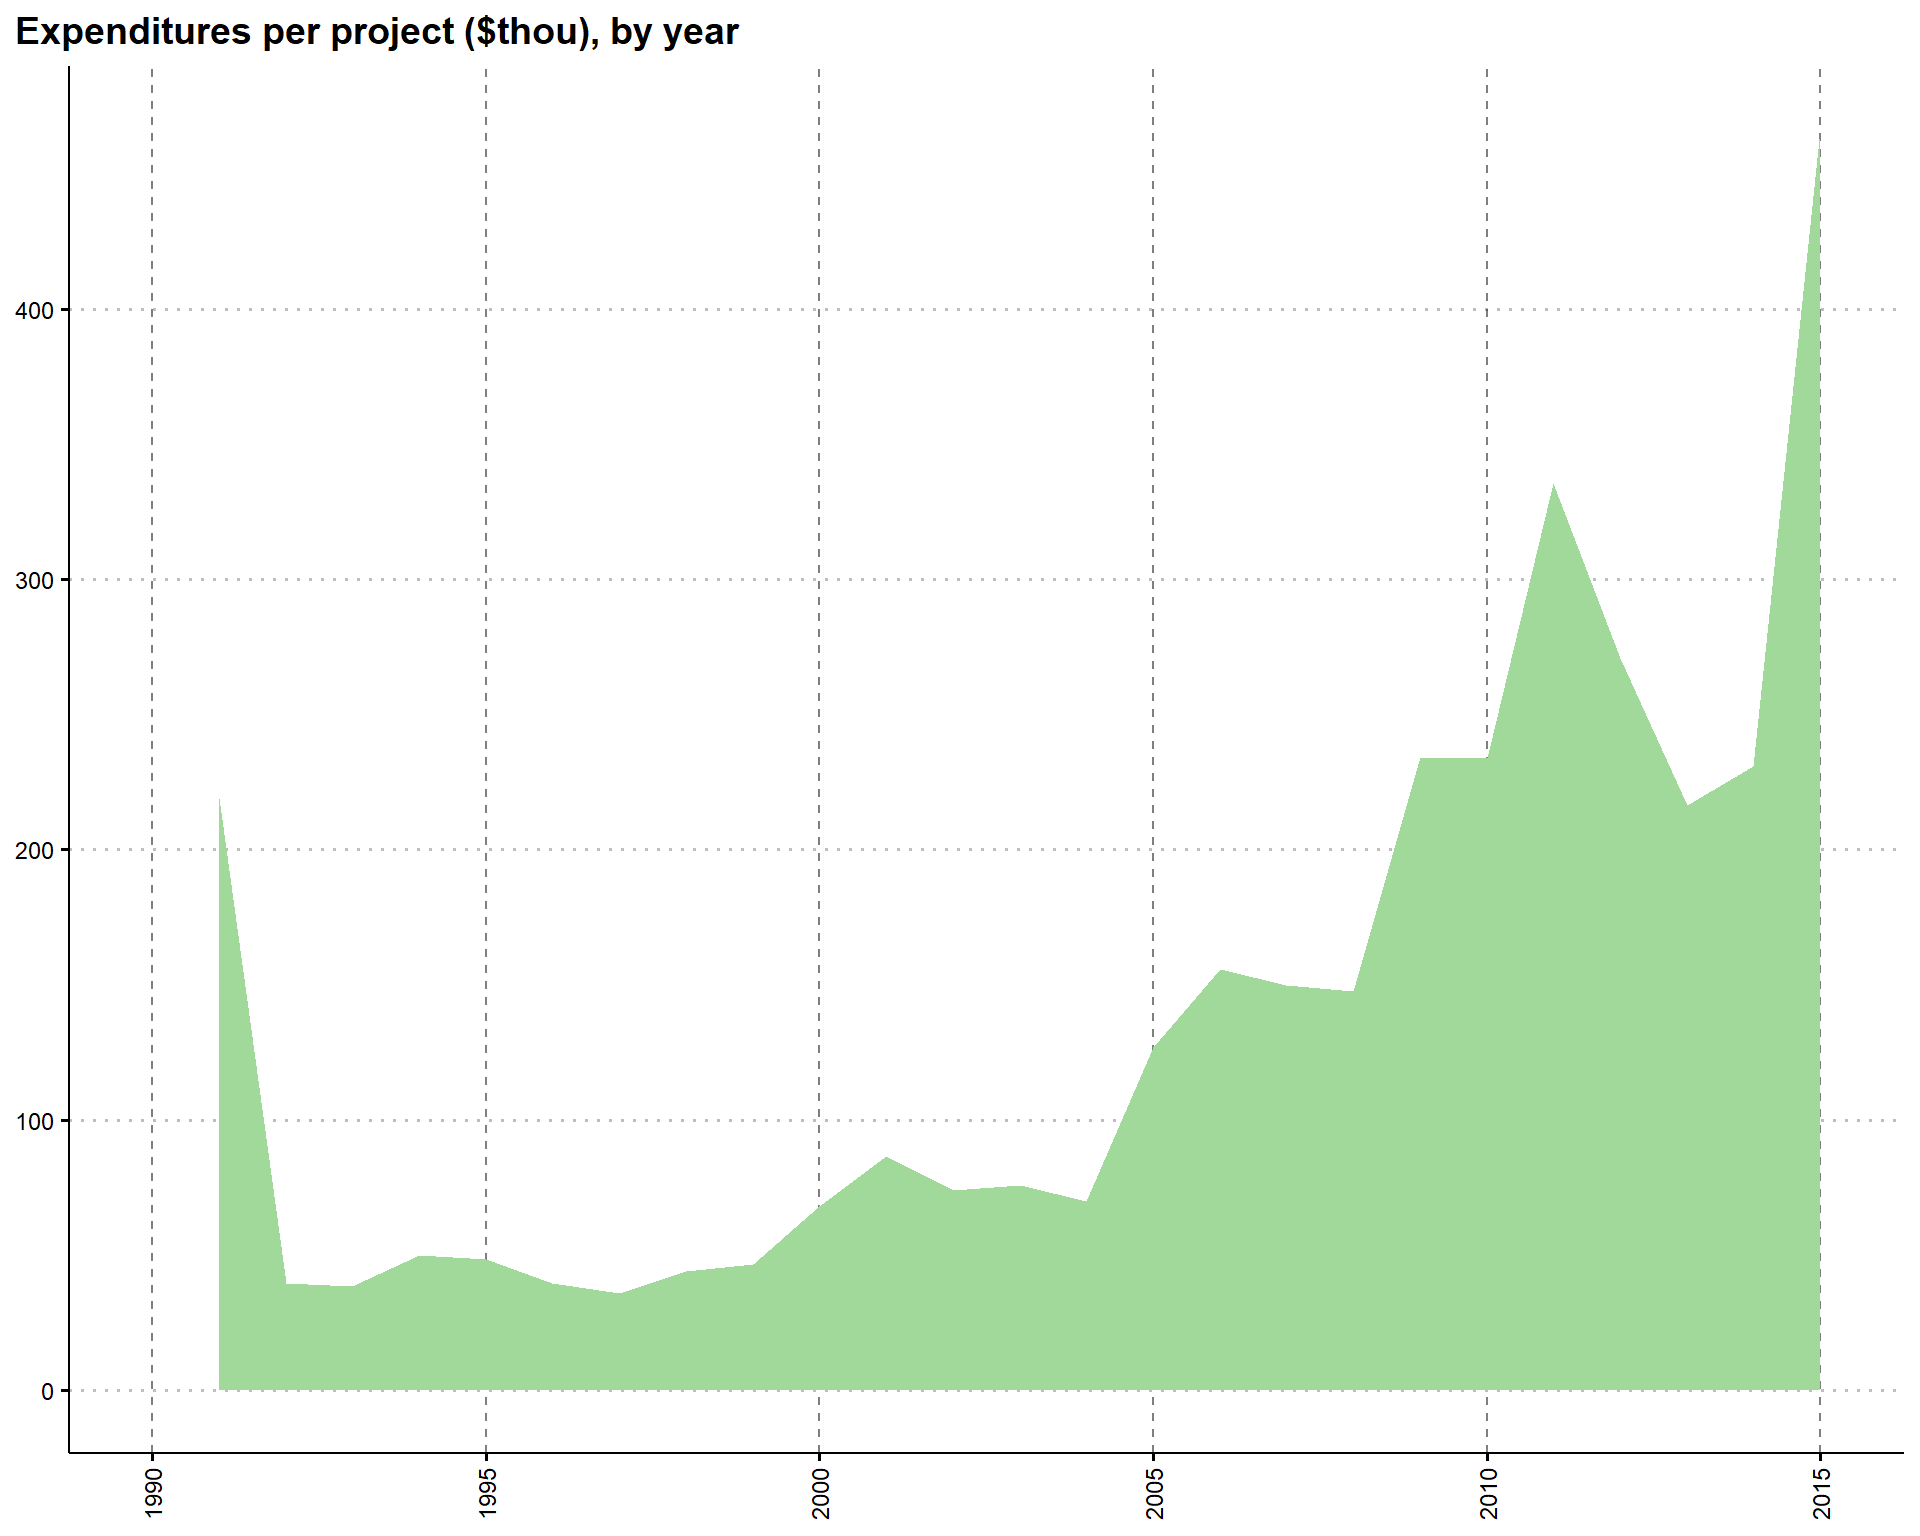
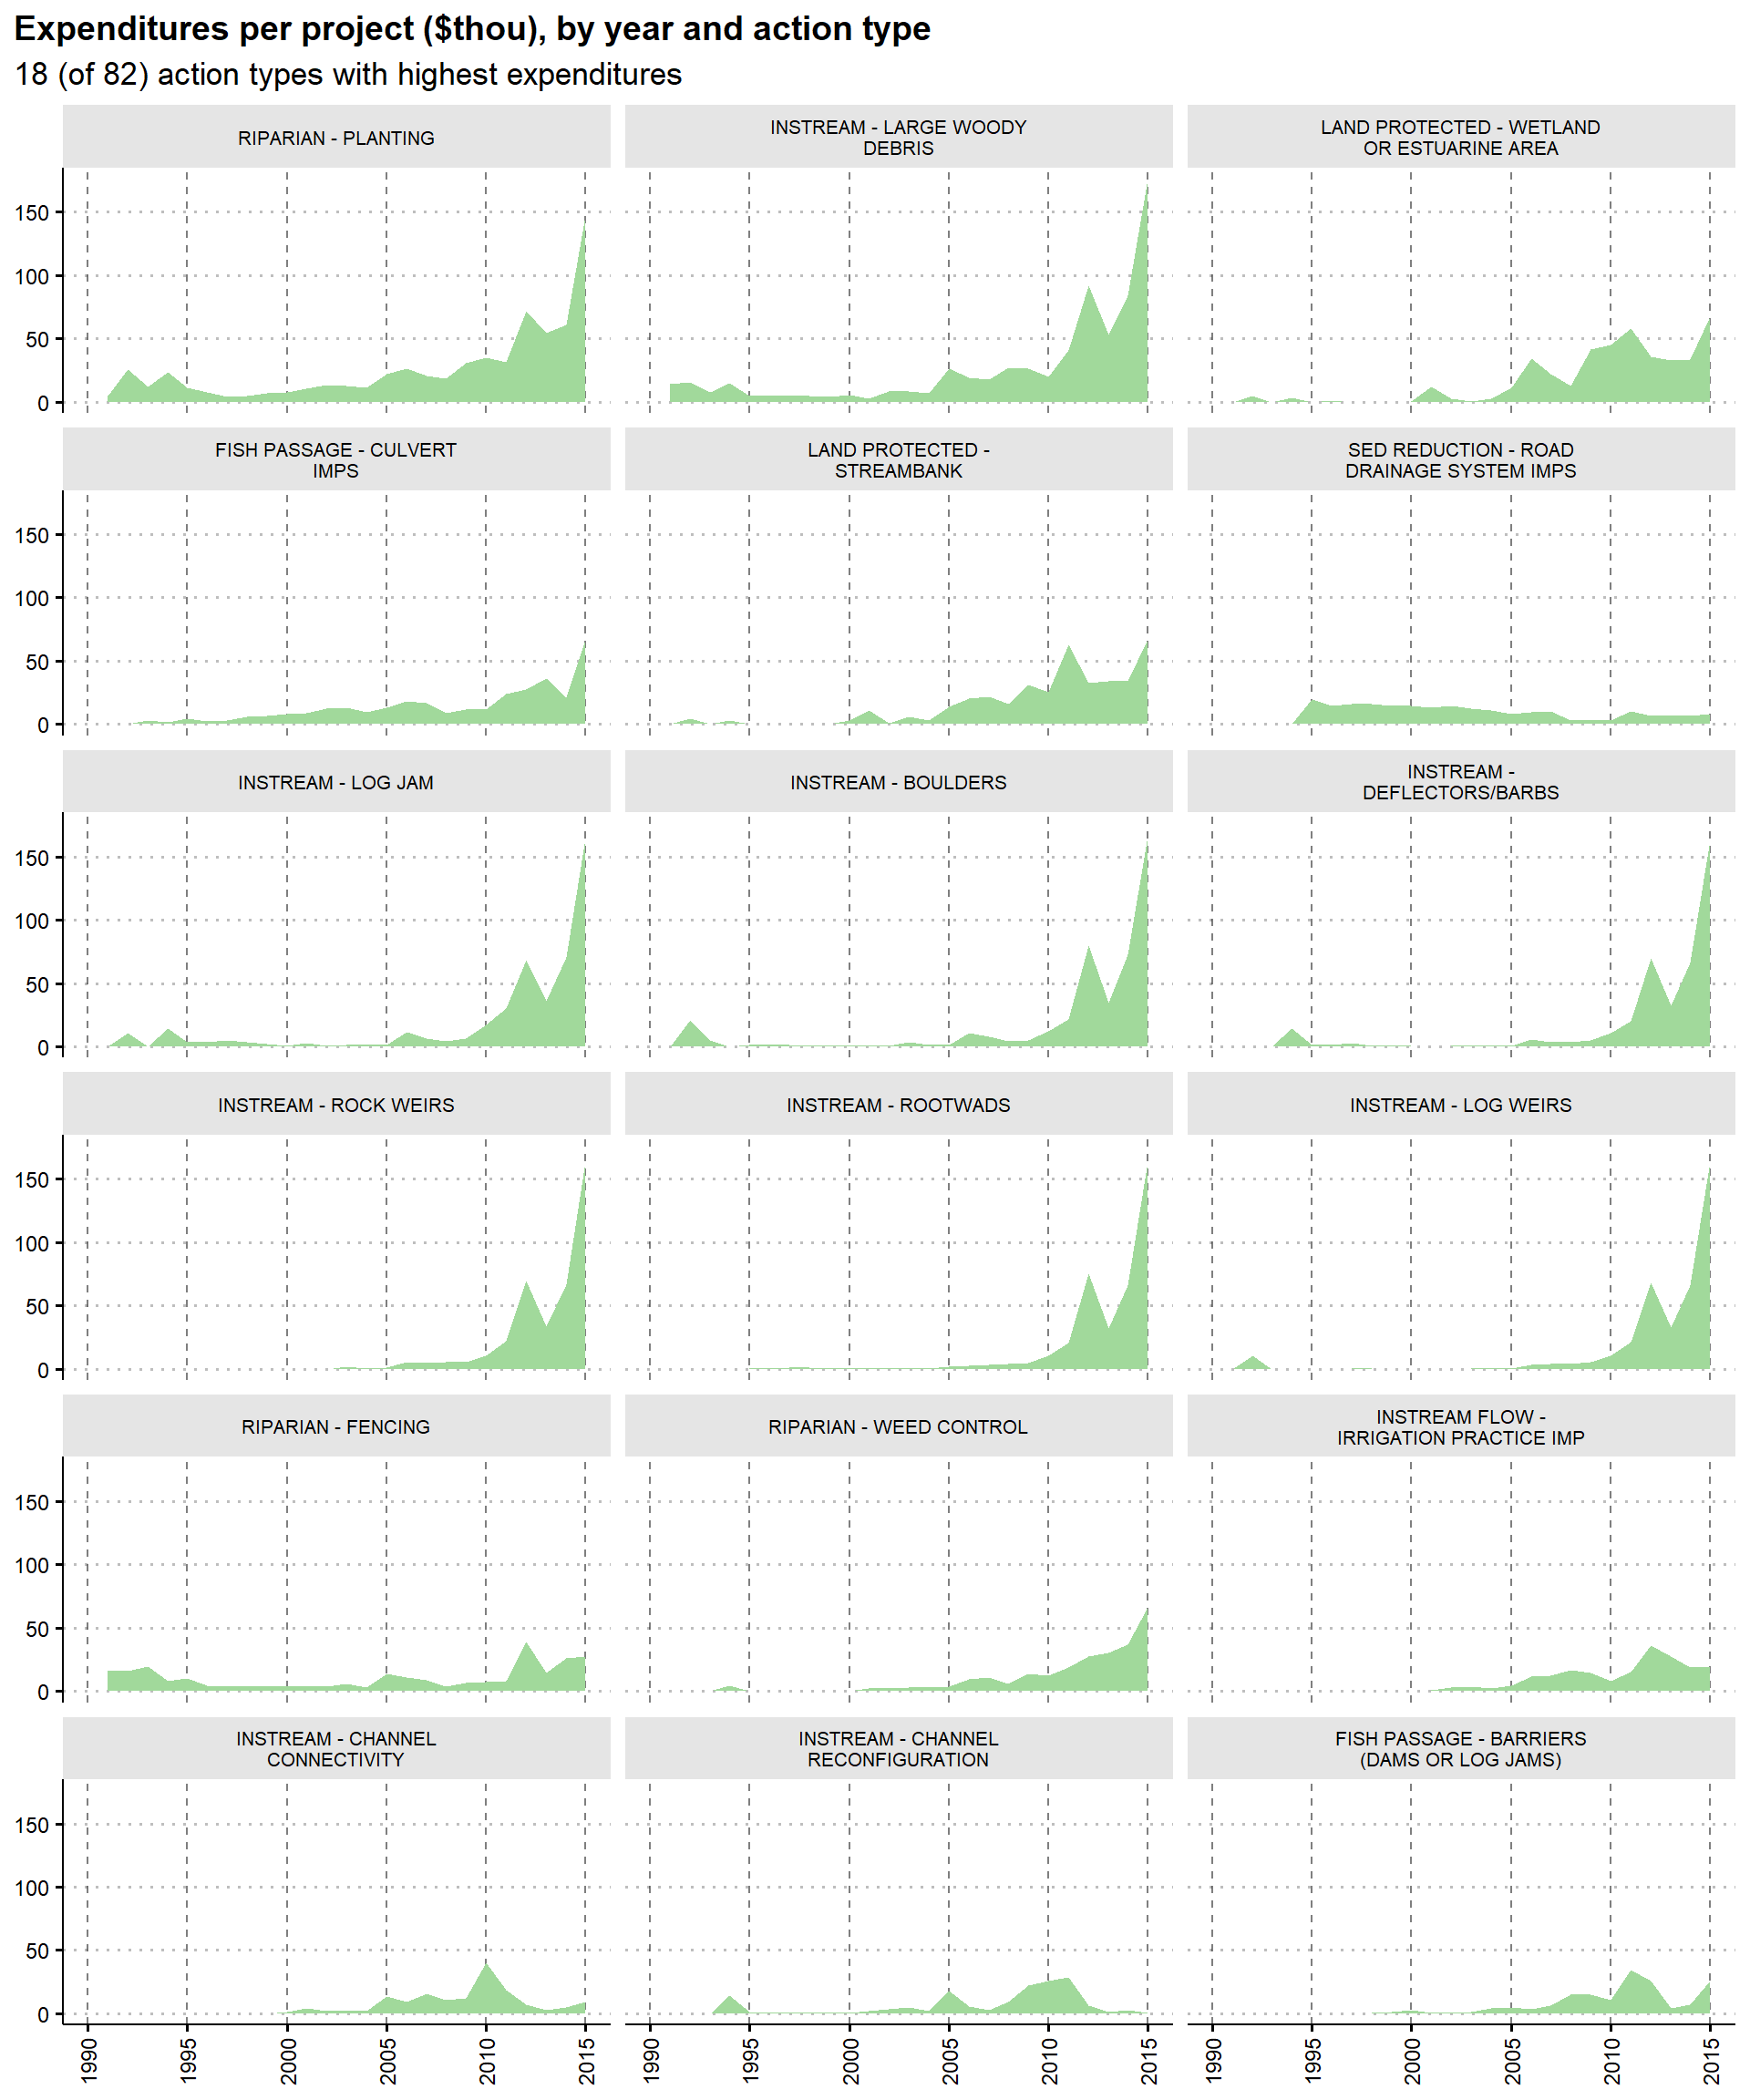
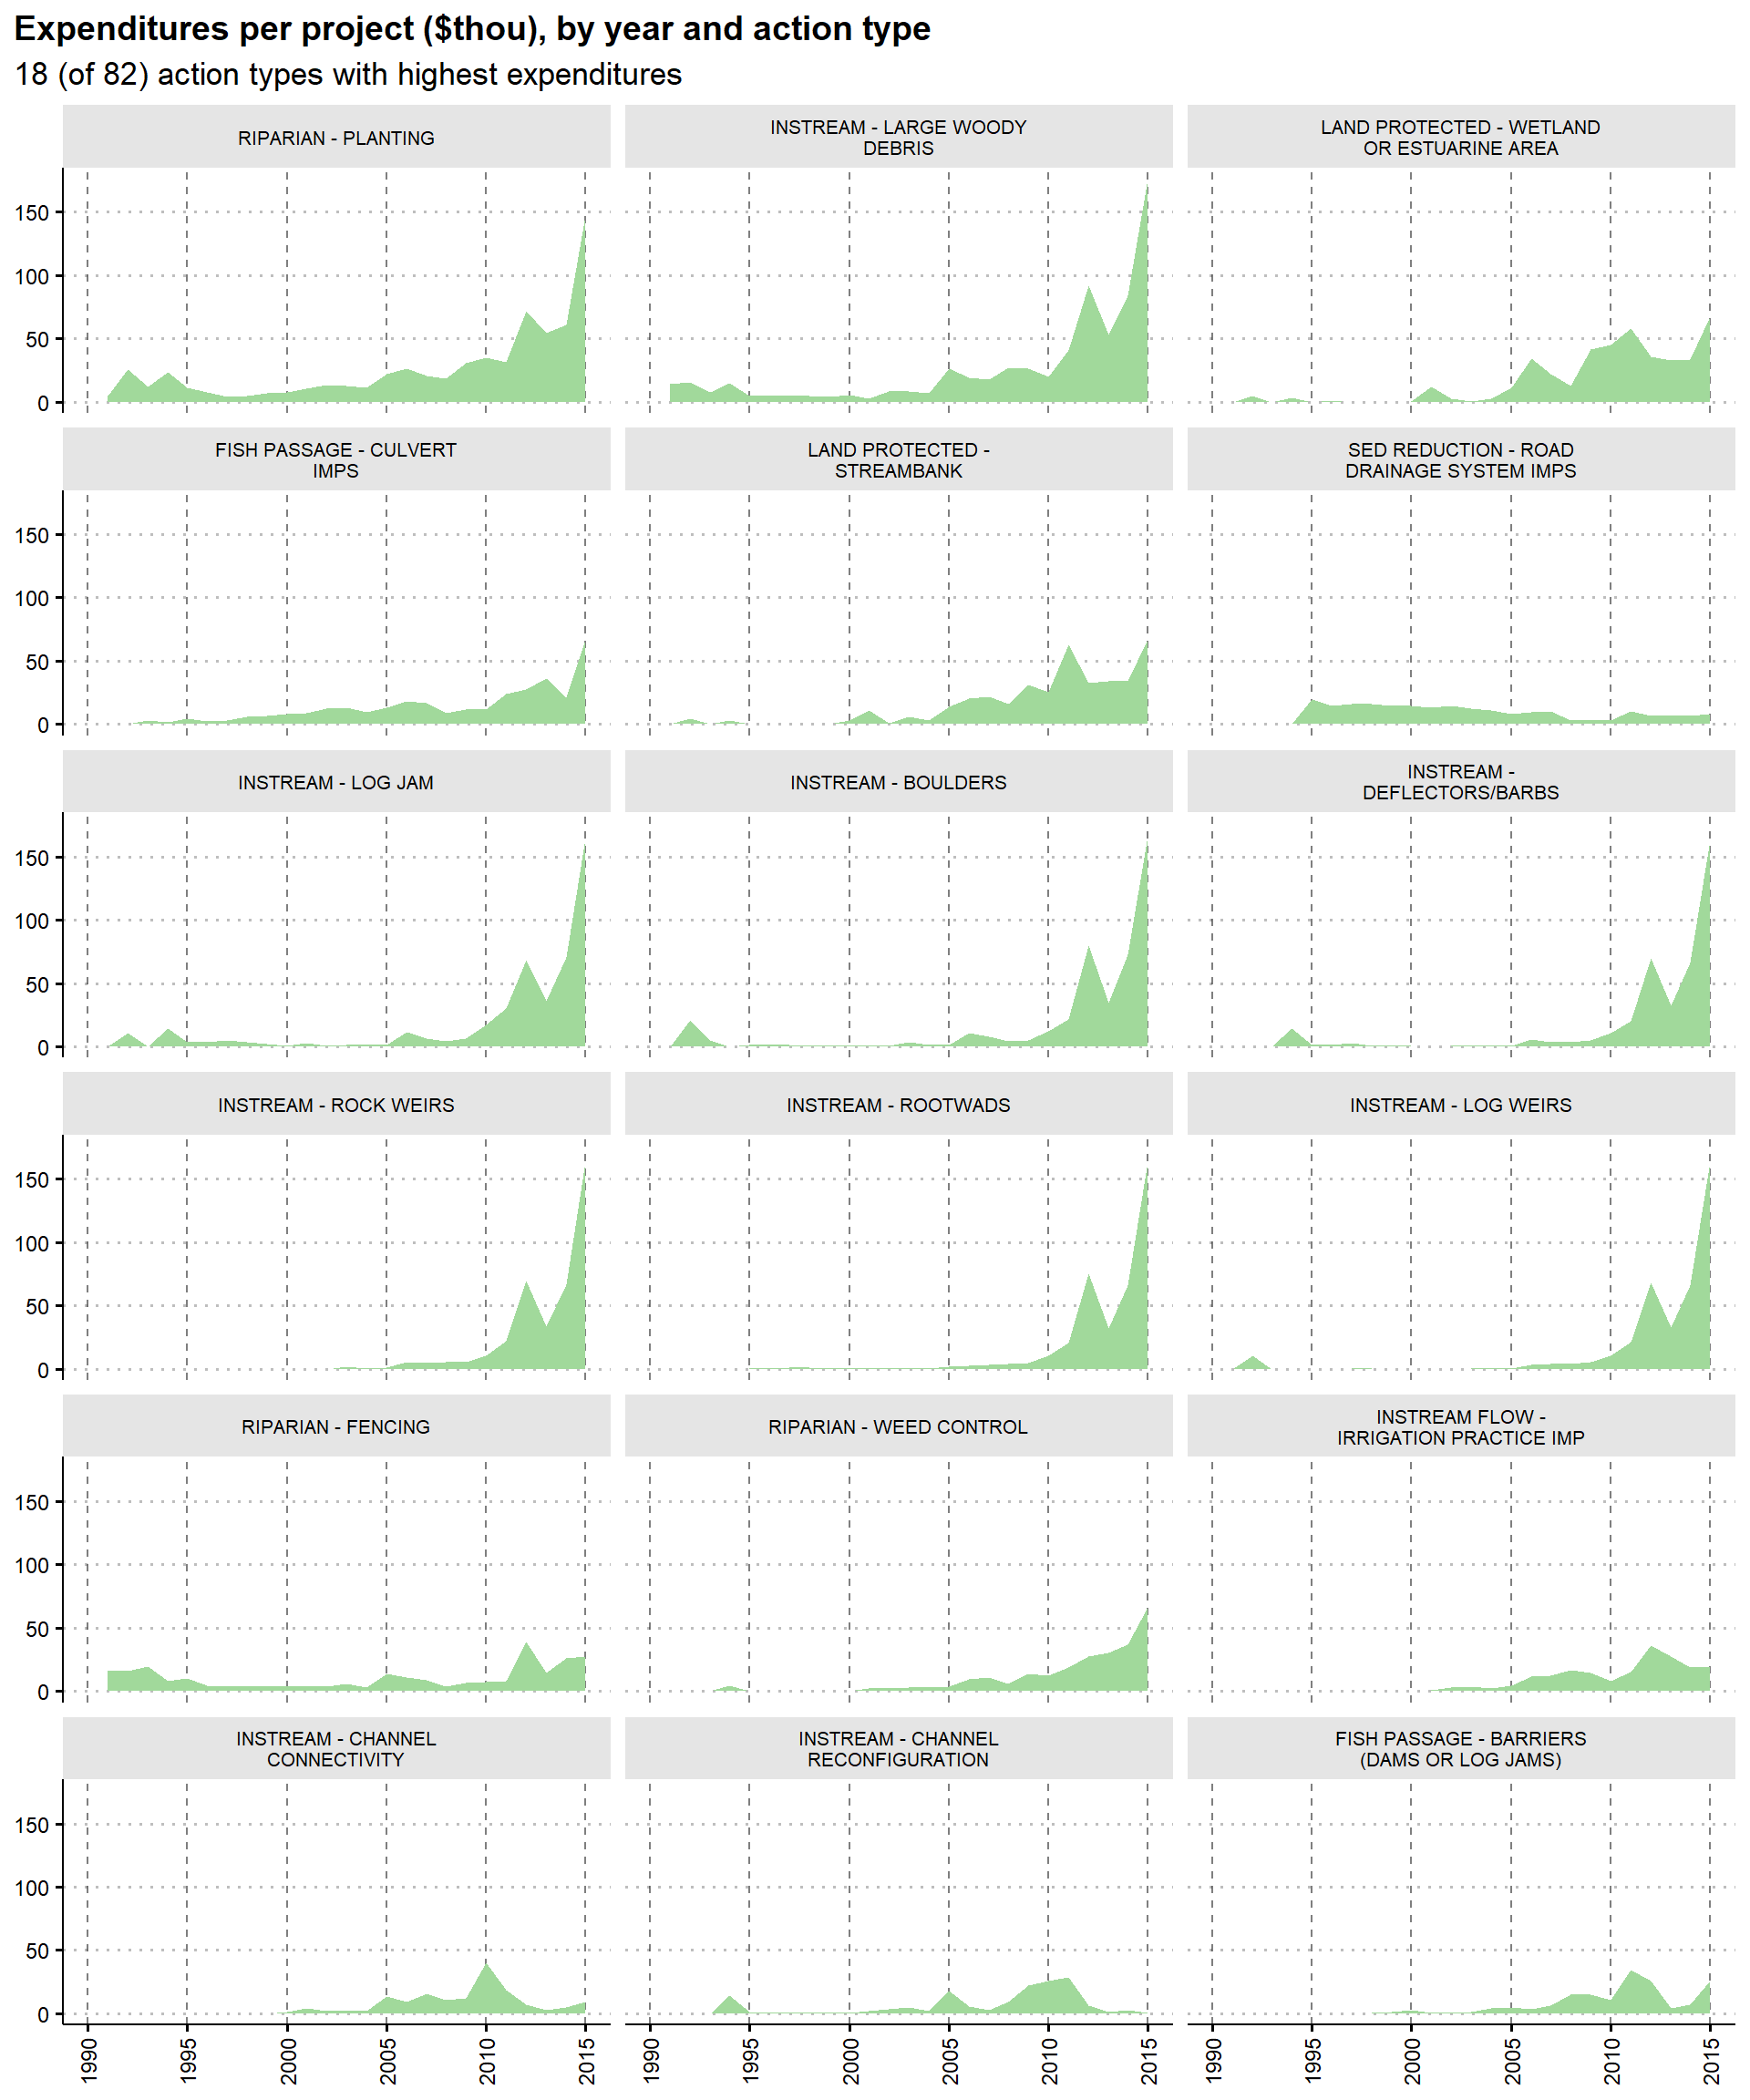
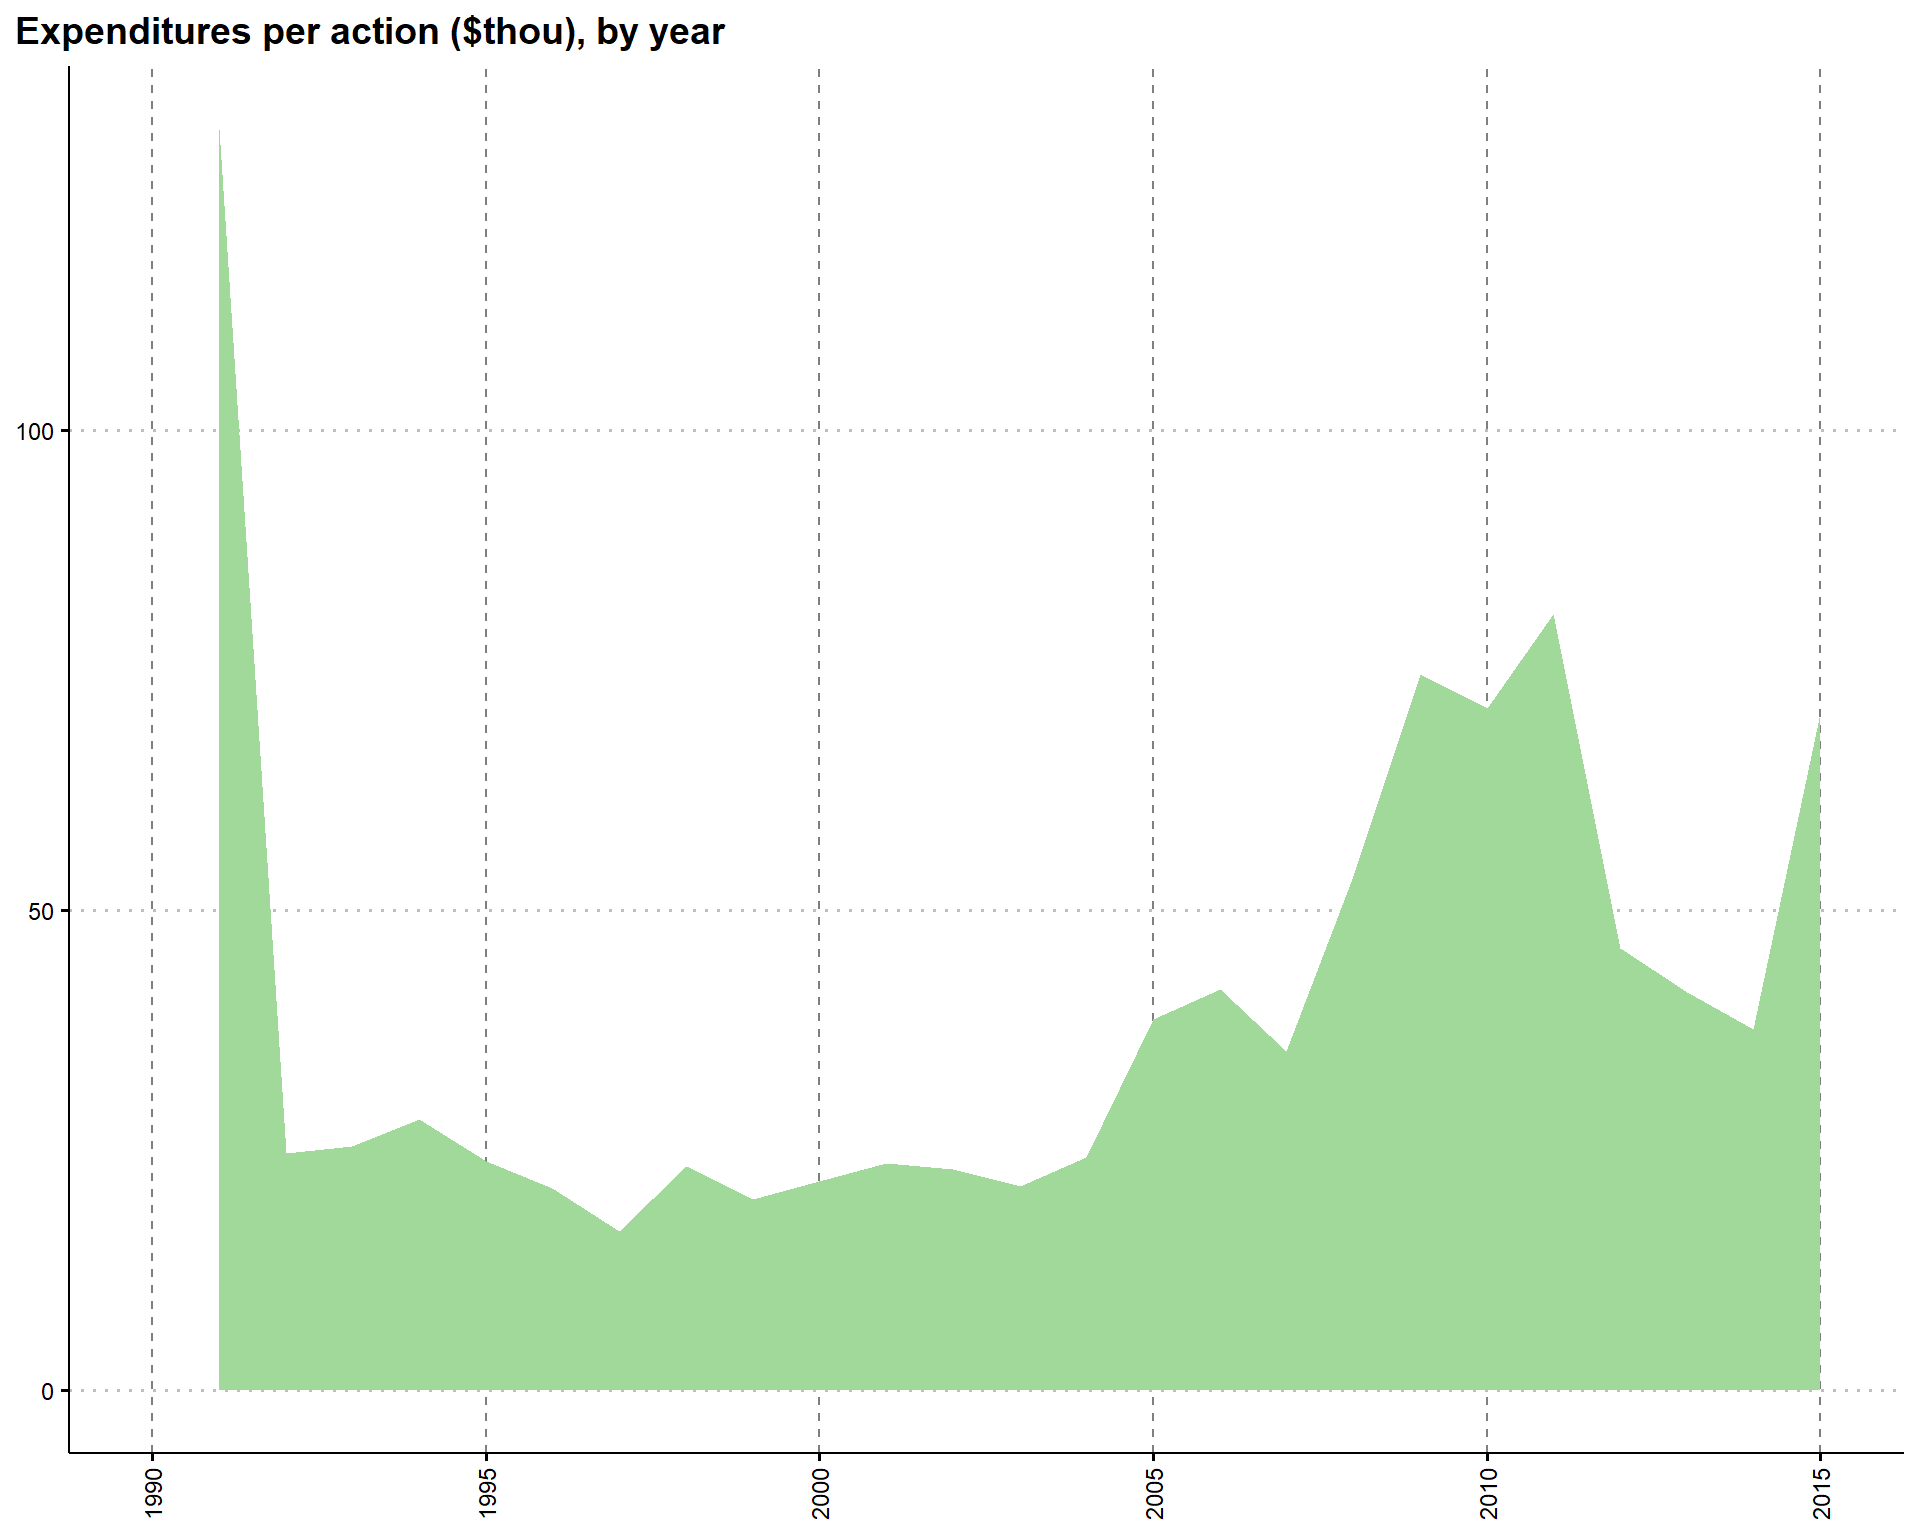
Observation: Expenditures have been rising overall and for almost all major actions over time, with the exception of road drainage improvements (see note in the Action and Project Counts section above). Expenditures per project and per action have been rising over time as well. This may be because agencies are attempting more complex projects and extensive actions, or because the mix of actions is shifting towards more expensive actions. It may also be that the “low hanging fruit” is all gone and that there simply aren’t more actions available. Of course, it could also be that costs are just rising over time (though I have already adjusted for inflation). As seen in the Counts figures, there is a noticeable drop in spending in the year of the financial crisis, though overall spending quickly recovers.
By Action Type
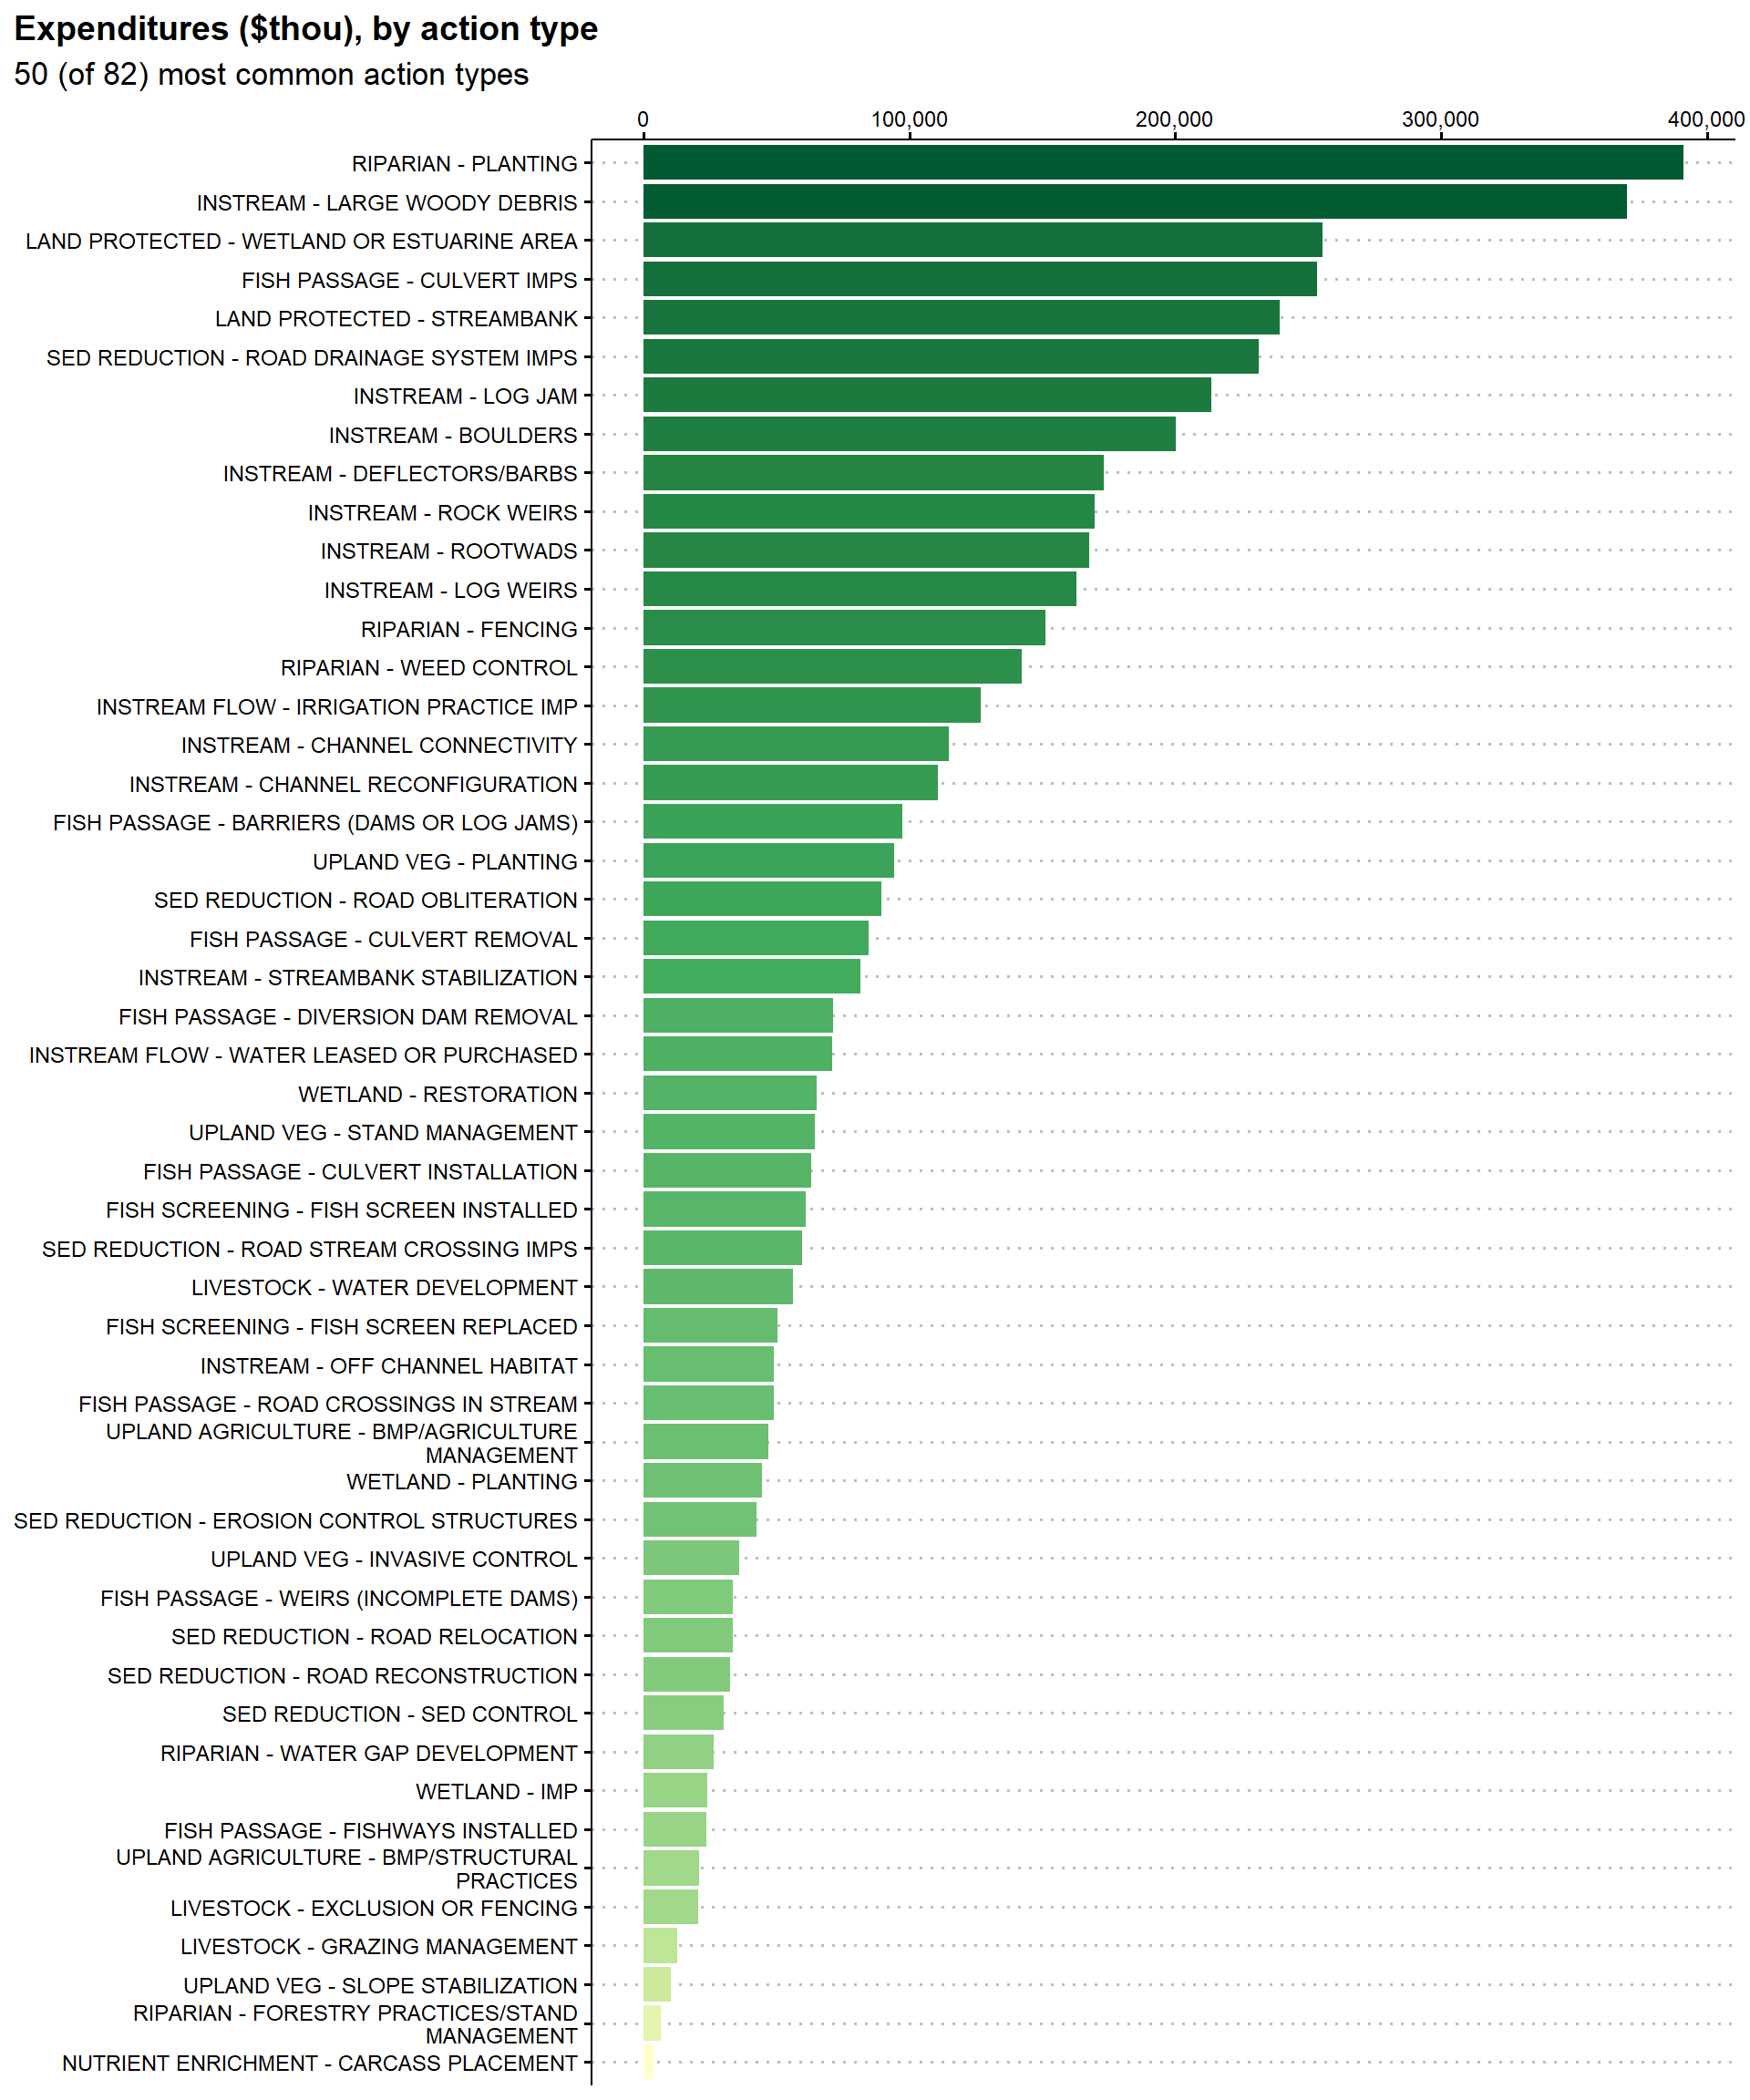
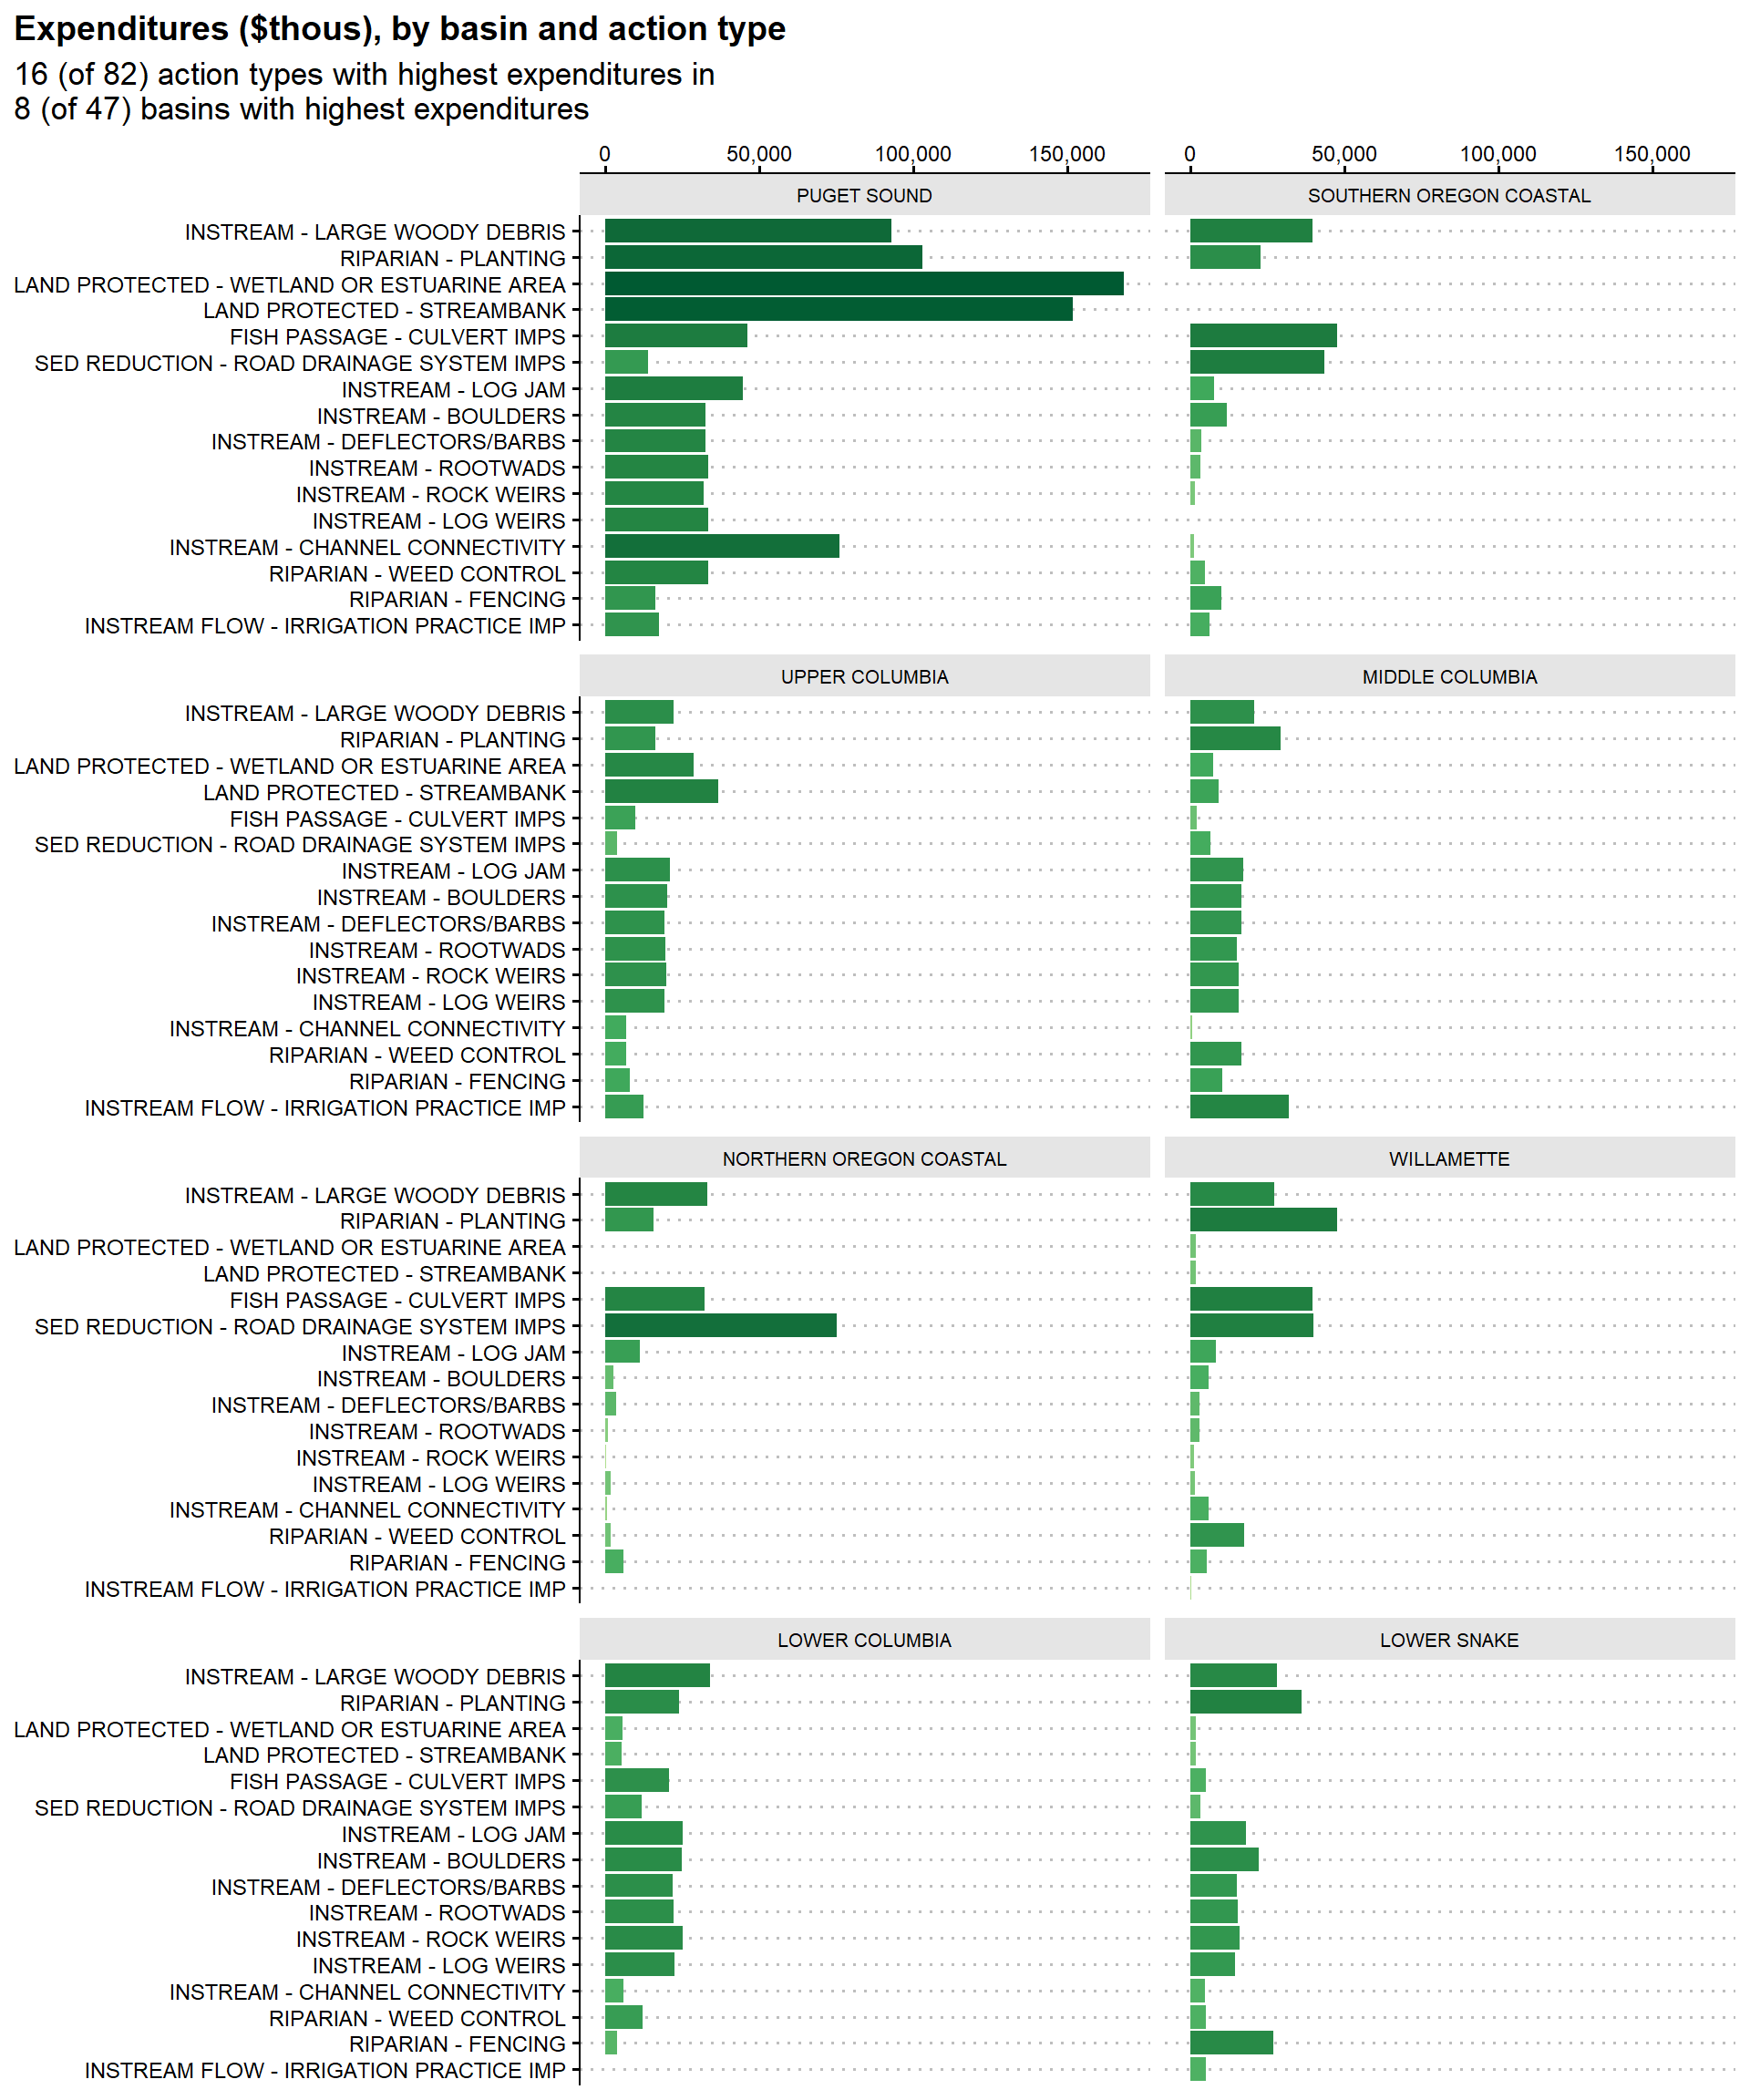
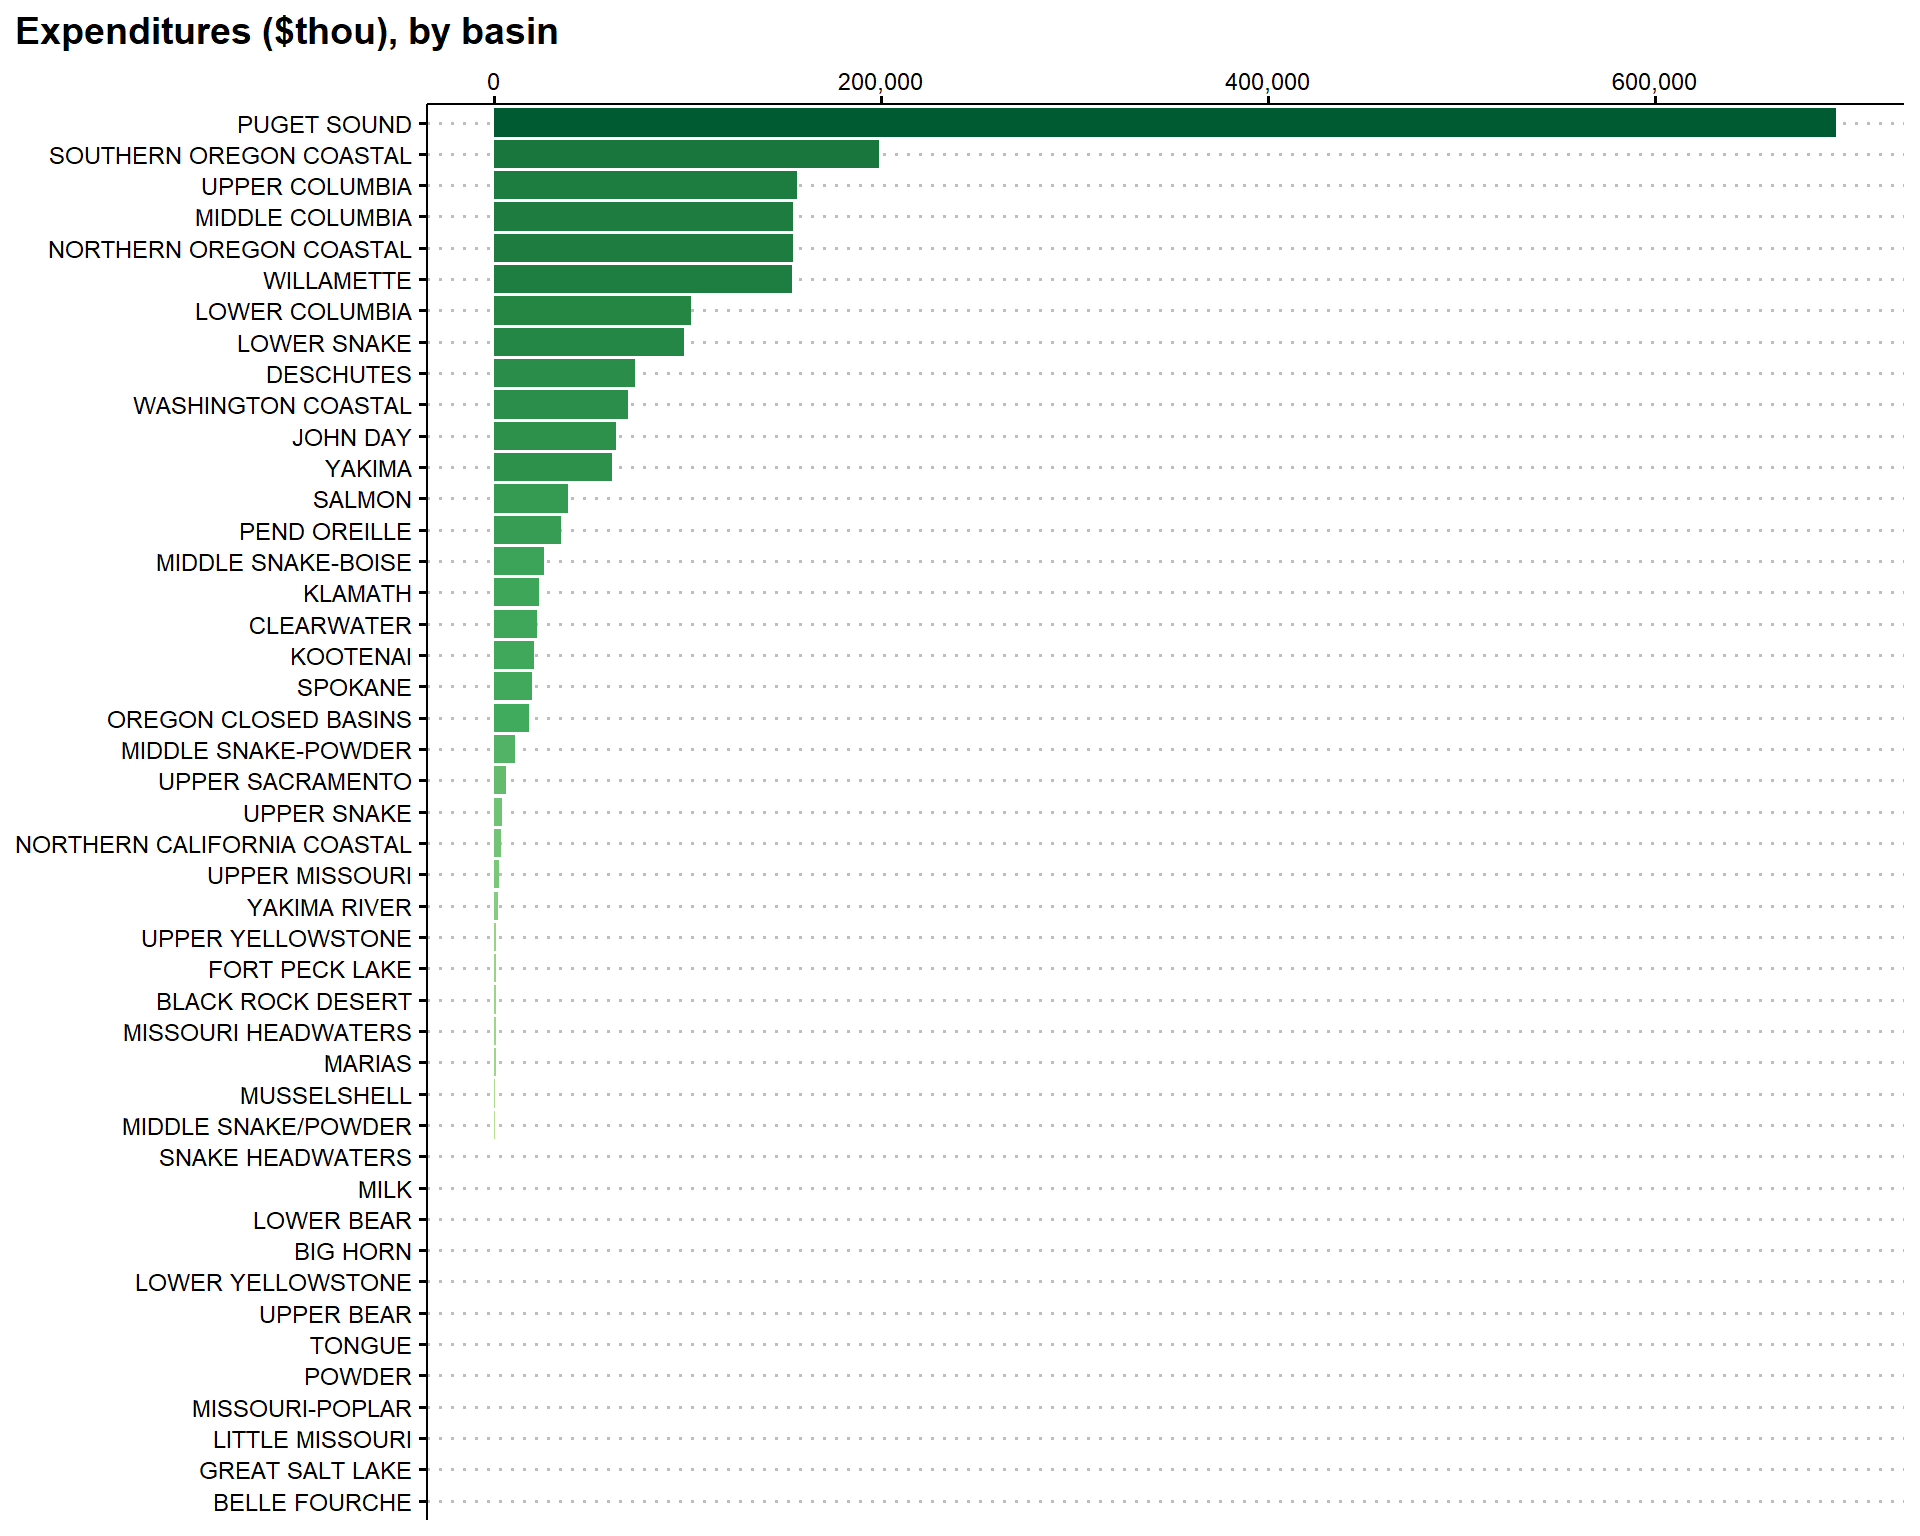
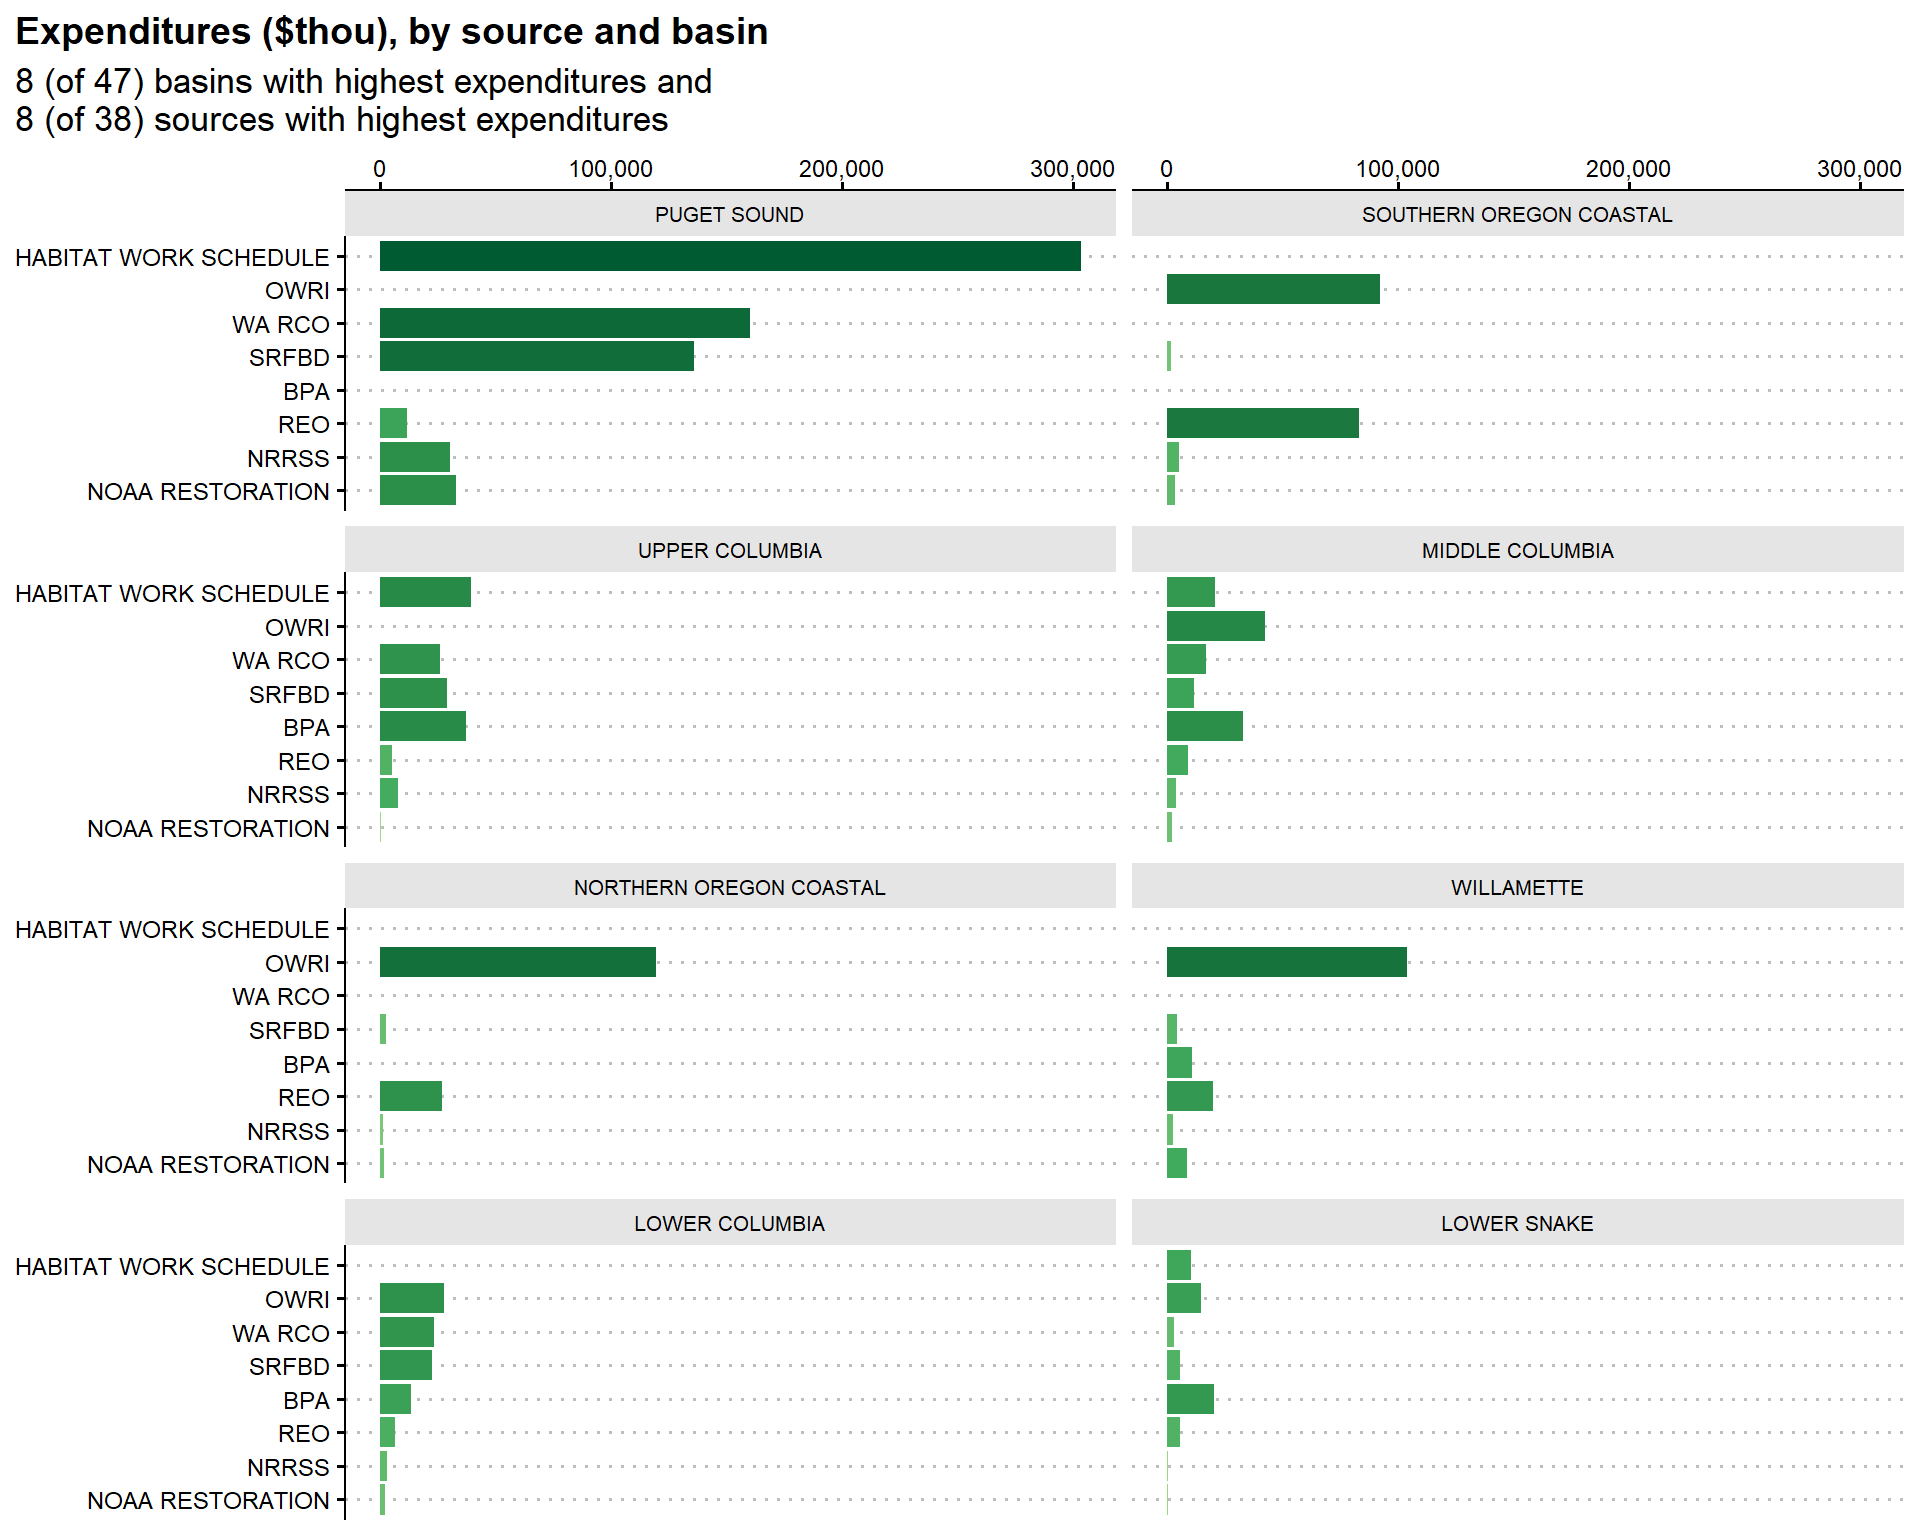
Observation: Projects involving direct habitat interventions like riparian planting and in-stream placement of large woody debris, log jams, weirs, rootwads, and boulders make up the bulk of the spending. For multiple action projects, these sorts of actions tend to be reported together, which might explain their clustering at the top the total expenditure figures. These projects appear throughout the region, but Puget Sound has seen the most investment by a wide margin. Overall, these projects are the most widespread and represent the bulk of spending.
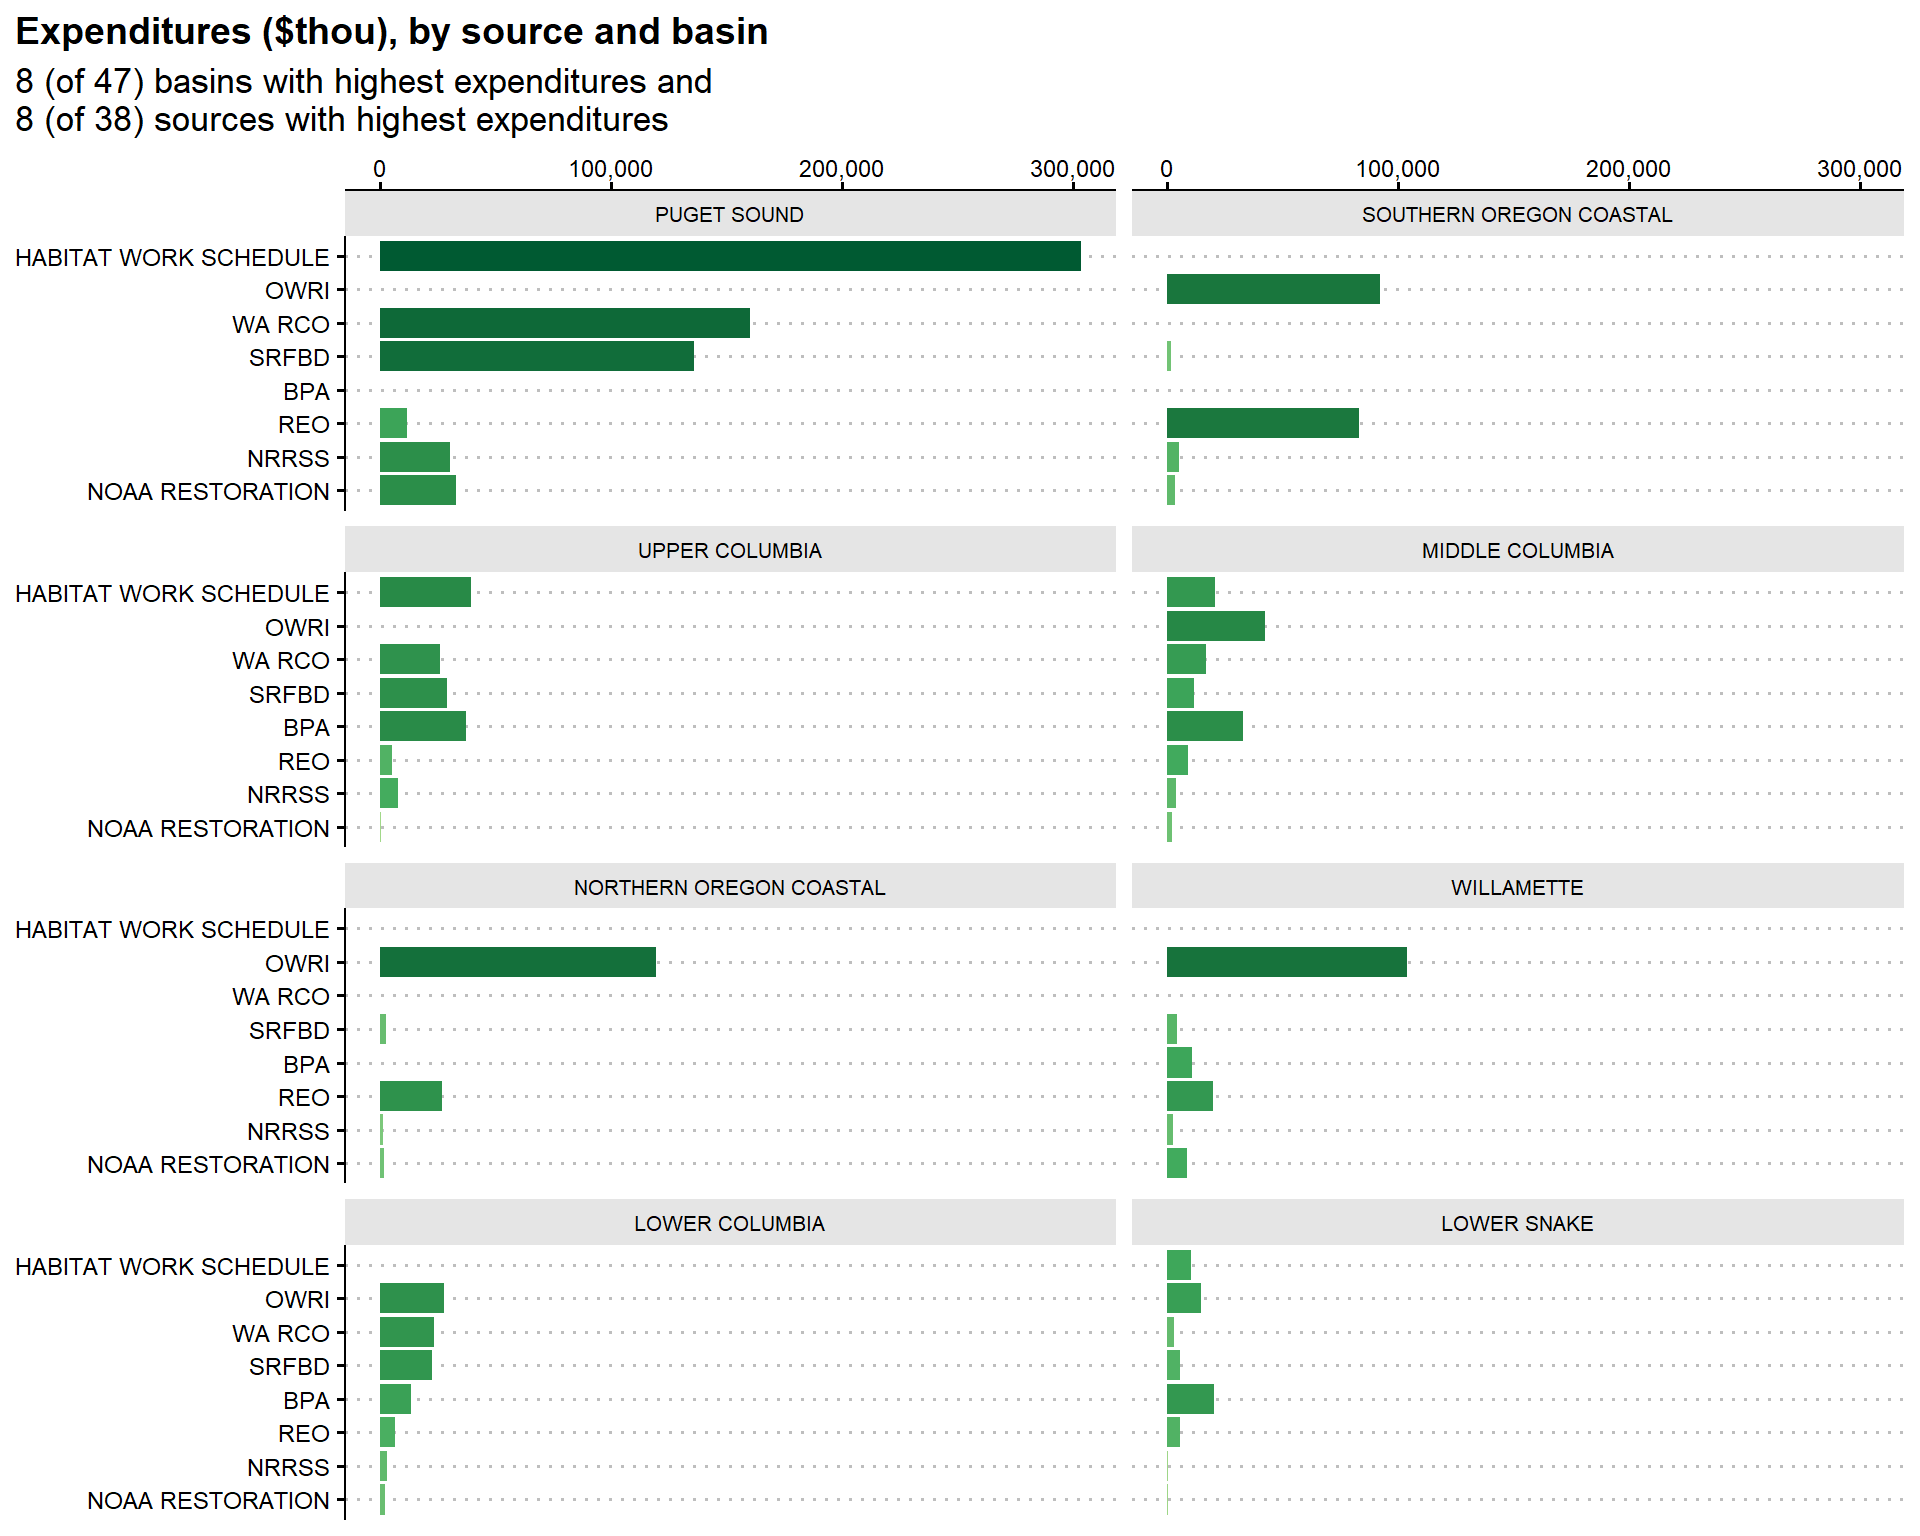
Observation: The bulk of the land acquisition spending is in the Puget Sound. Habitat Work Schedule and WA RCO (including SRFBD projects) report the most spending on these projects, and both operate mainly in the Puget Sound region. On the other hand, OWRI does not report land acquisition projects, so we may be getting an incomplete picture of acquisition activity in Oregon. Land acquisitions are clearly the most expensive actions, so including them together with other actions might obscure some signal.
By Basin
By Reporting Source
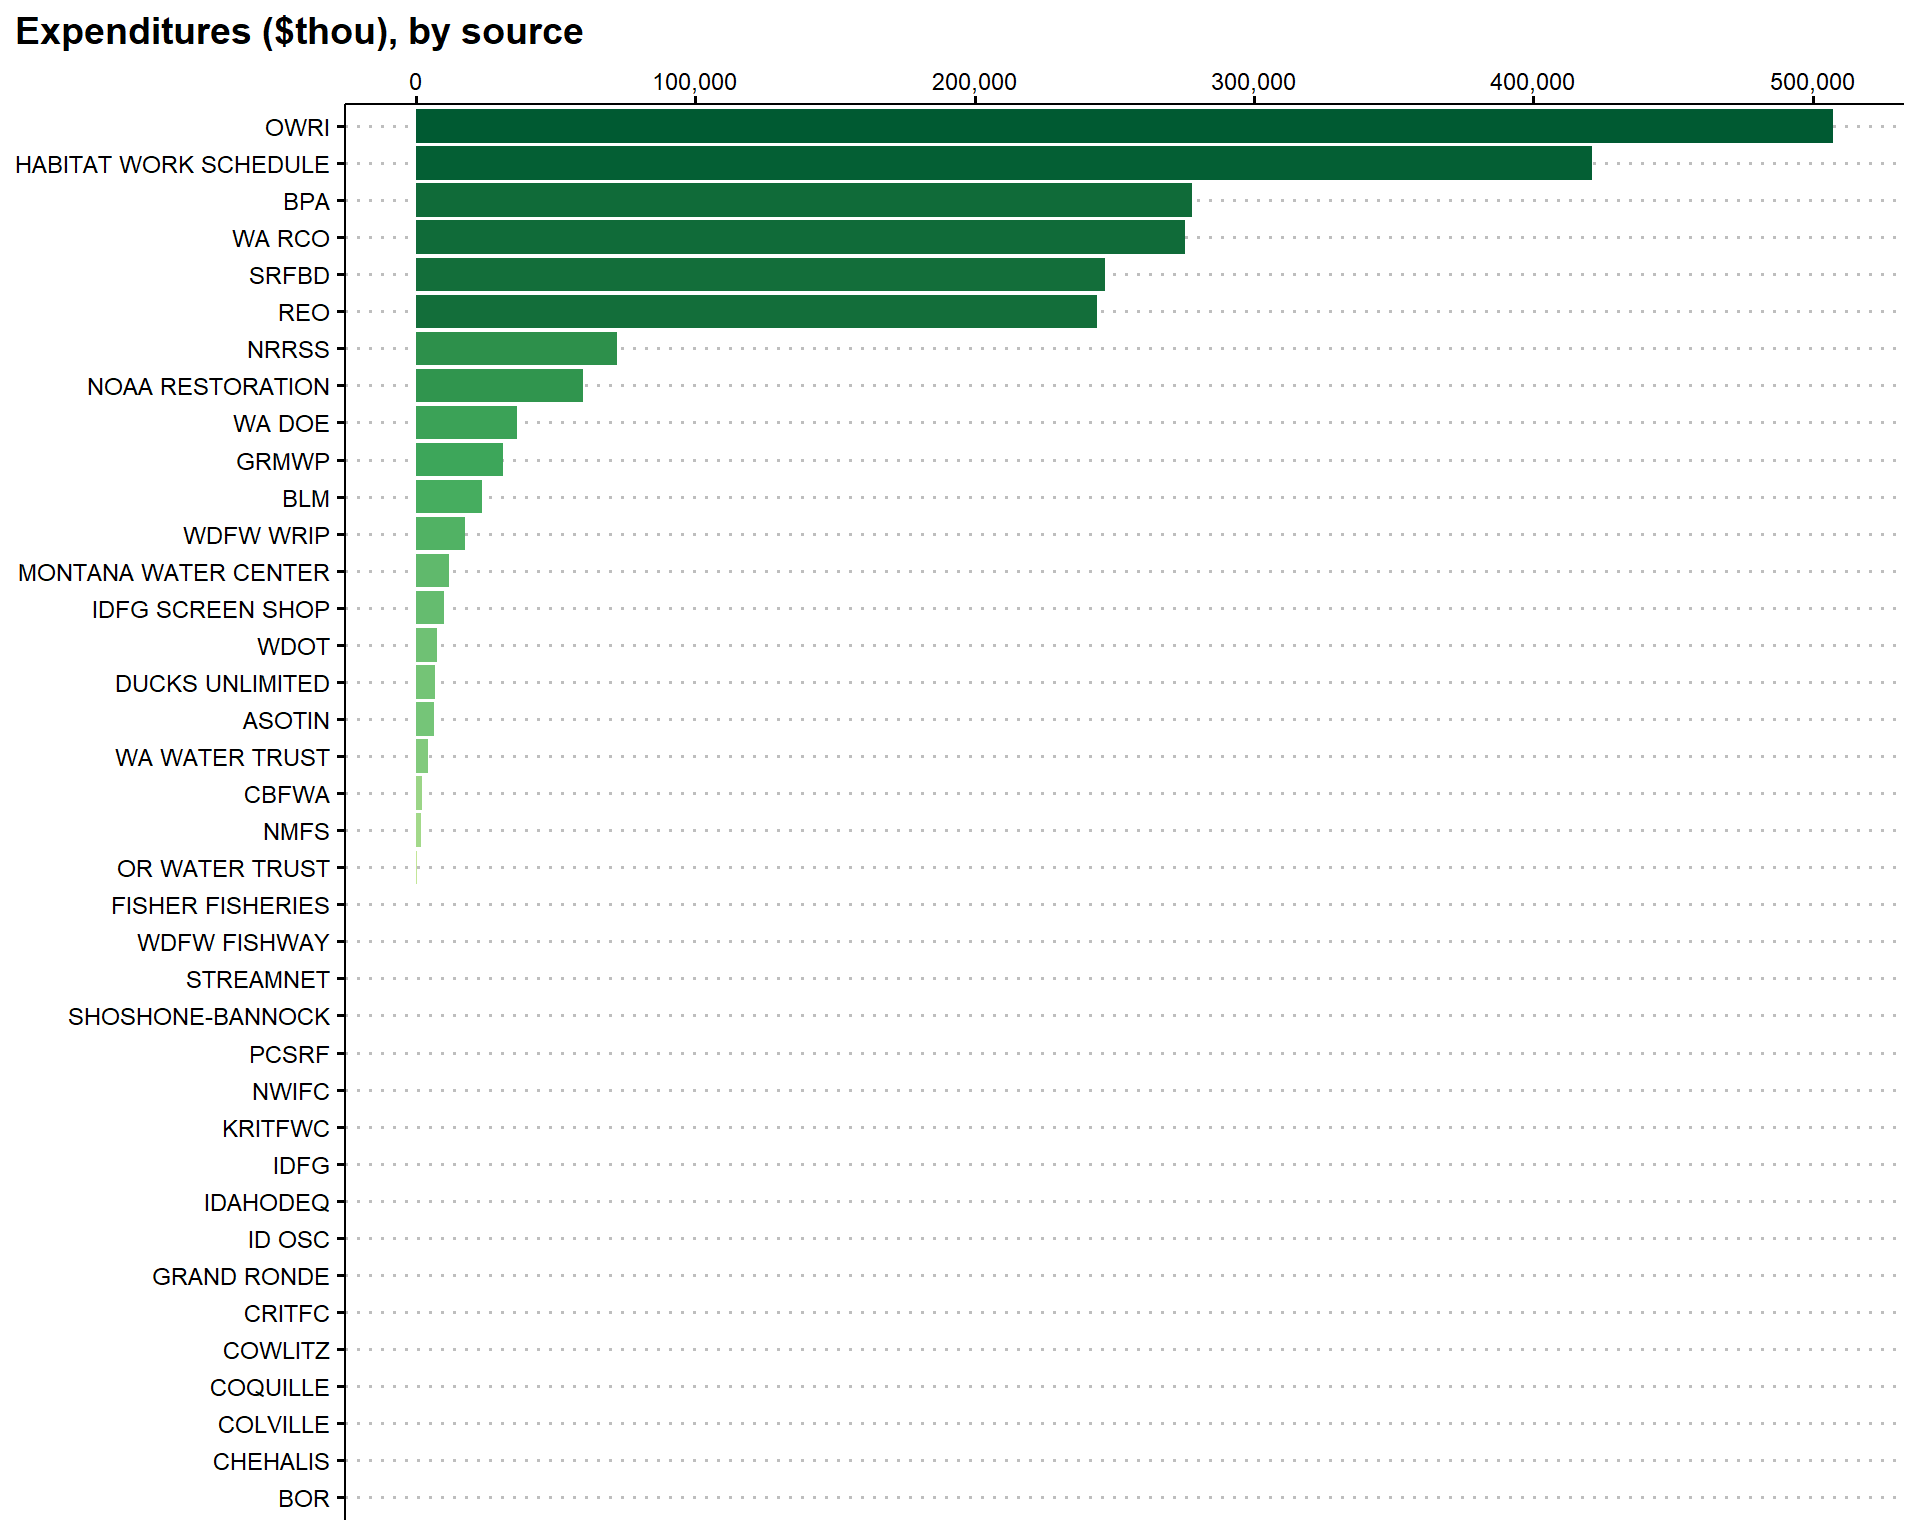
Observation: Only 22 of the 38 sources report any costs at all. The top six sources account for the vast majority of reported spending.
Per Project
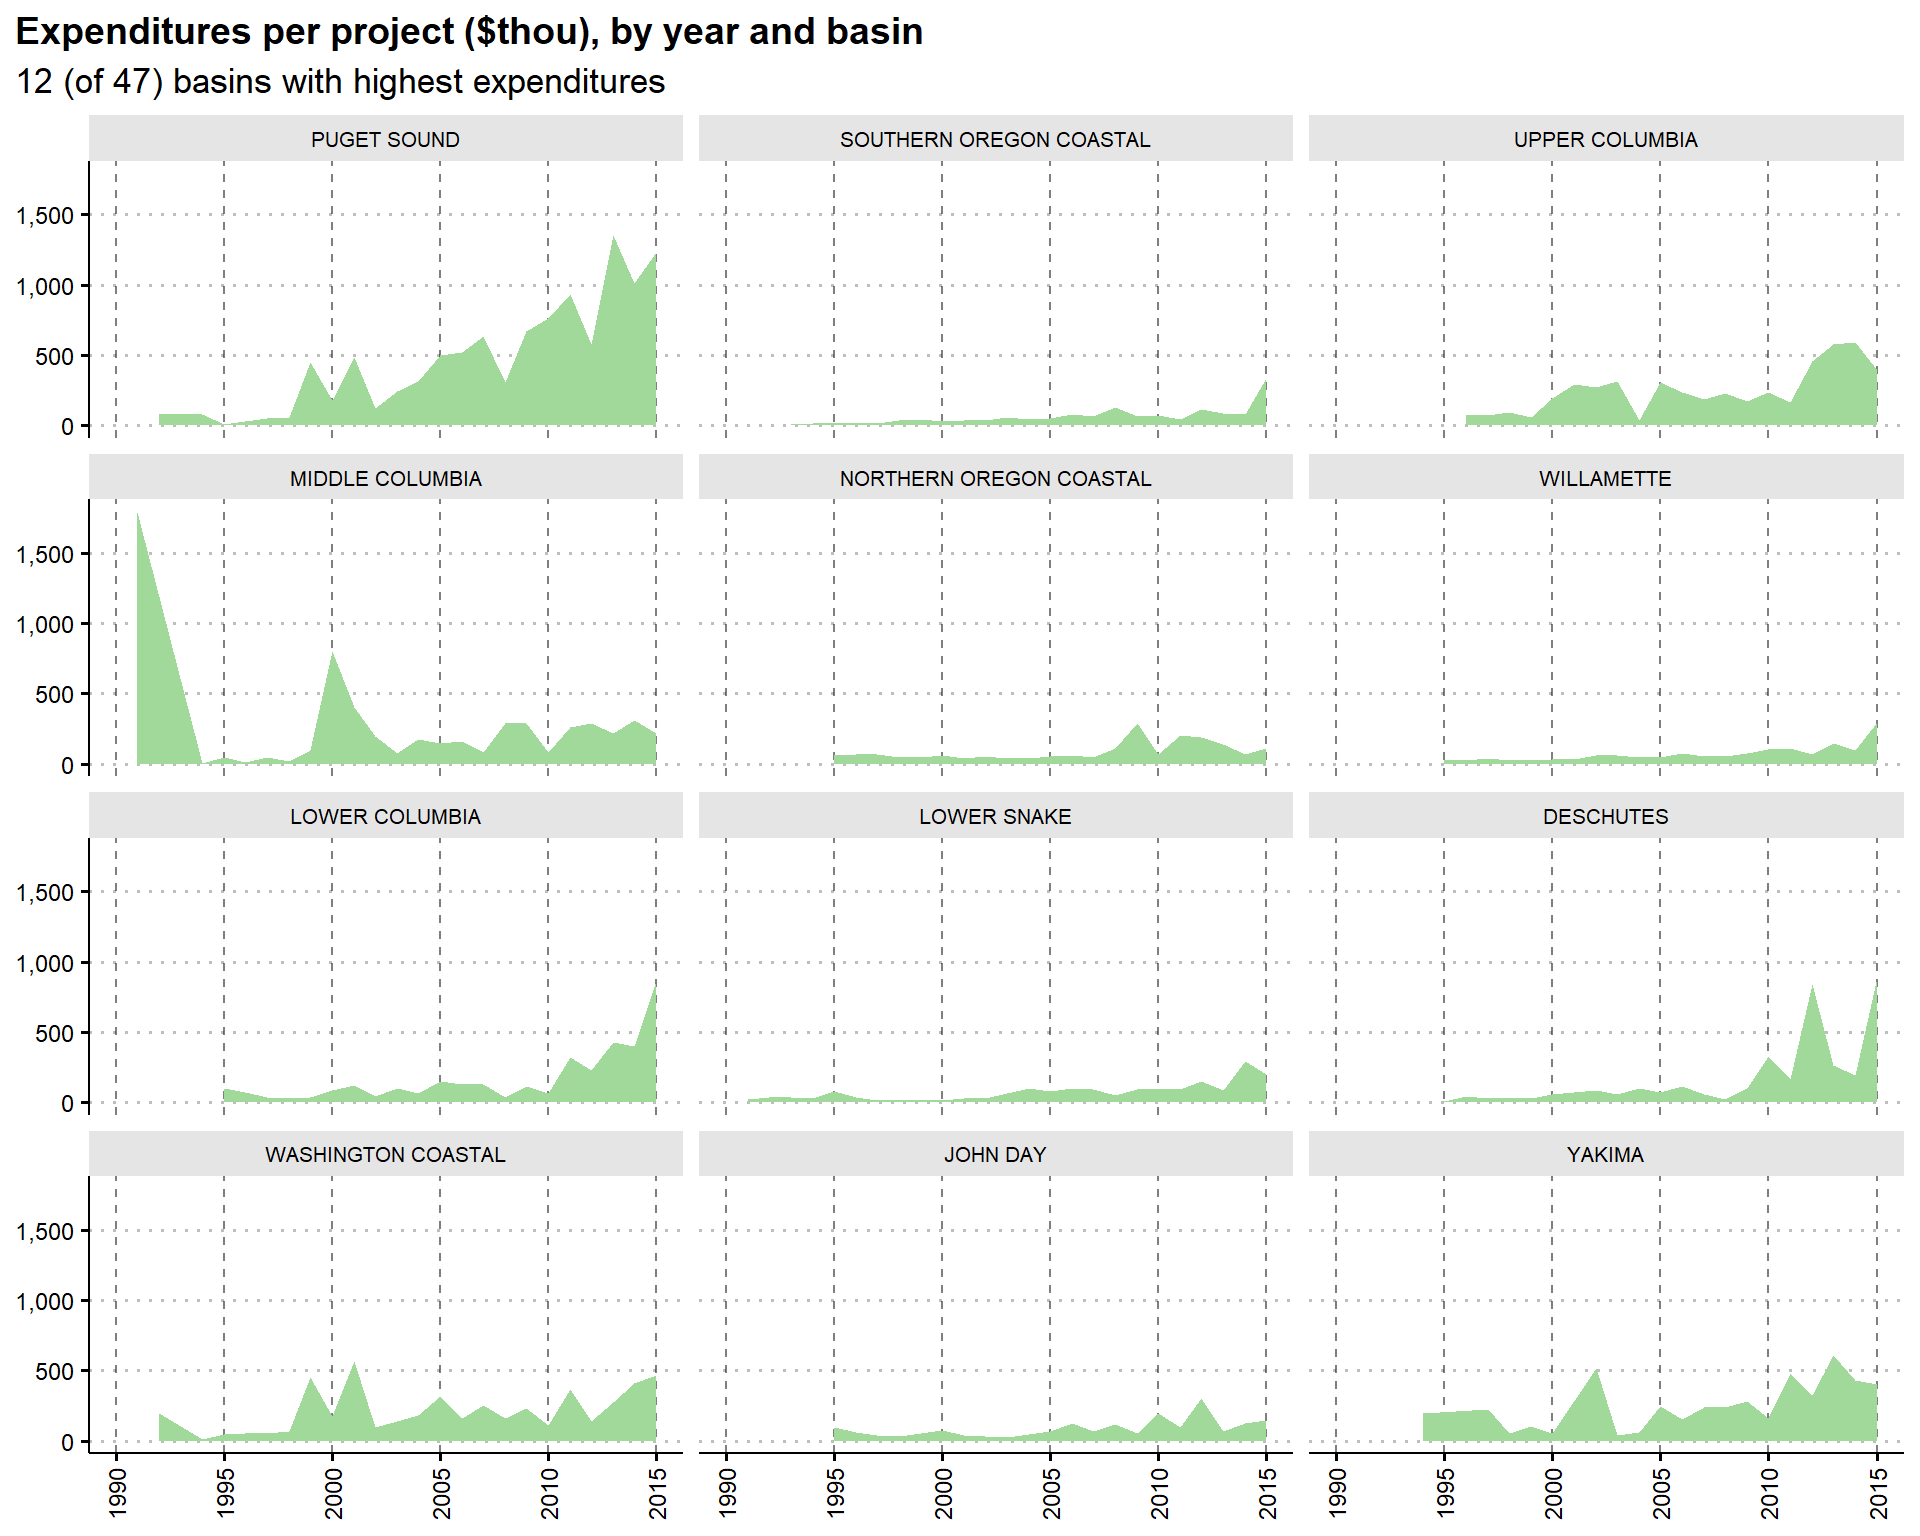
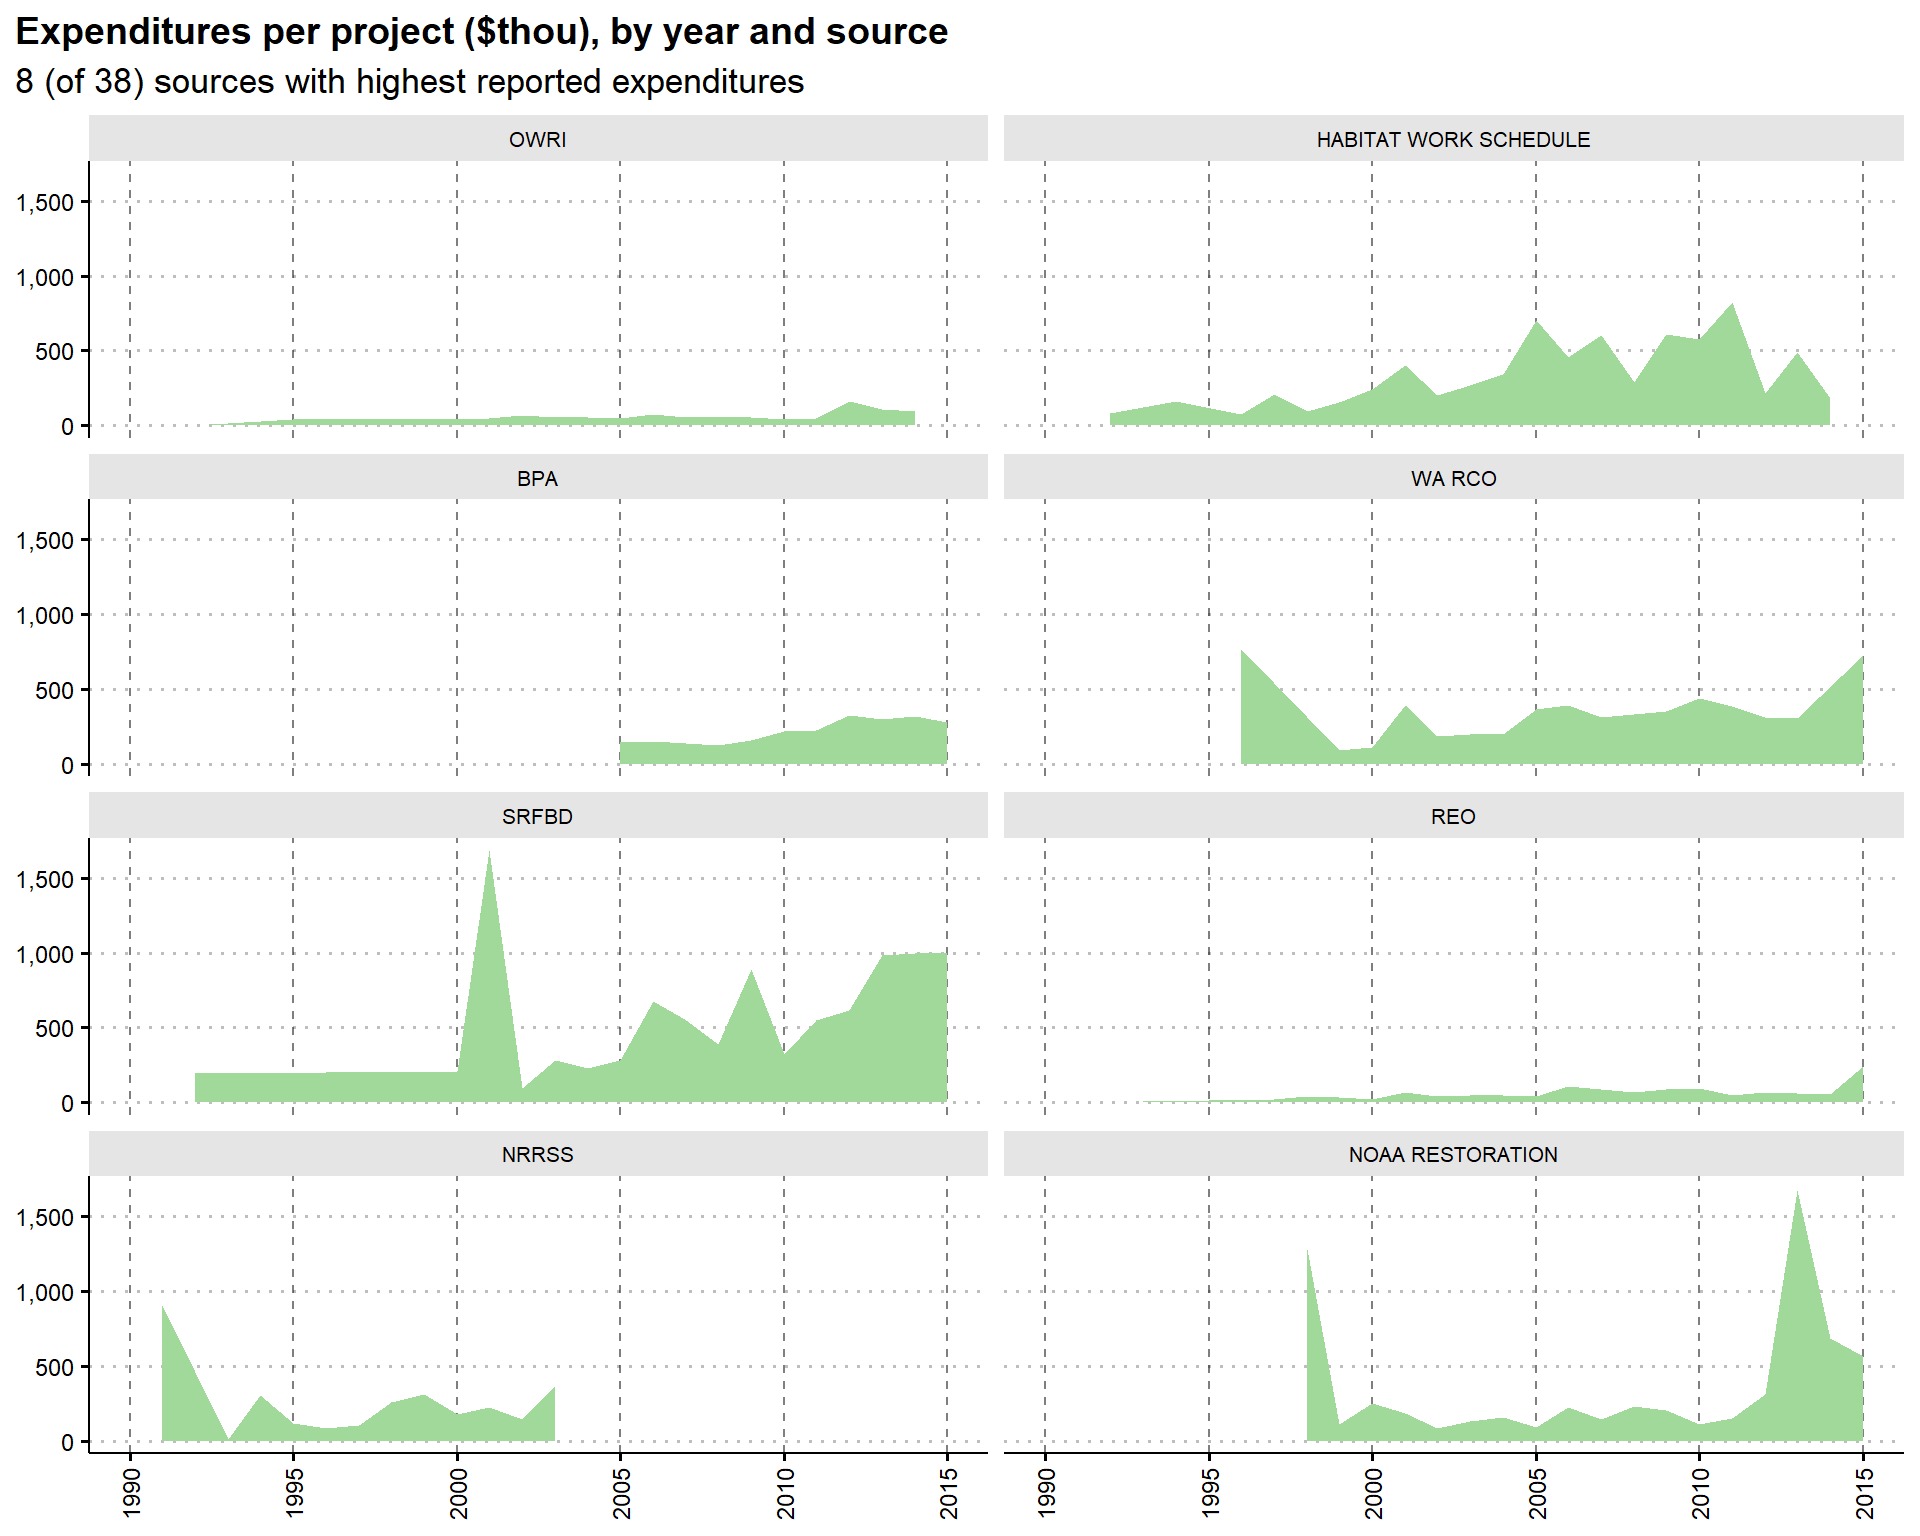
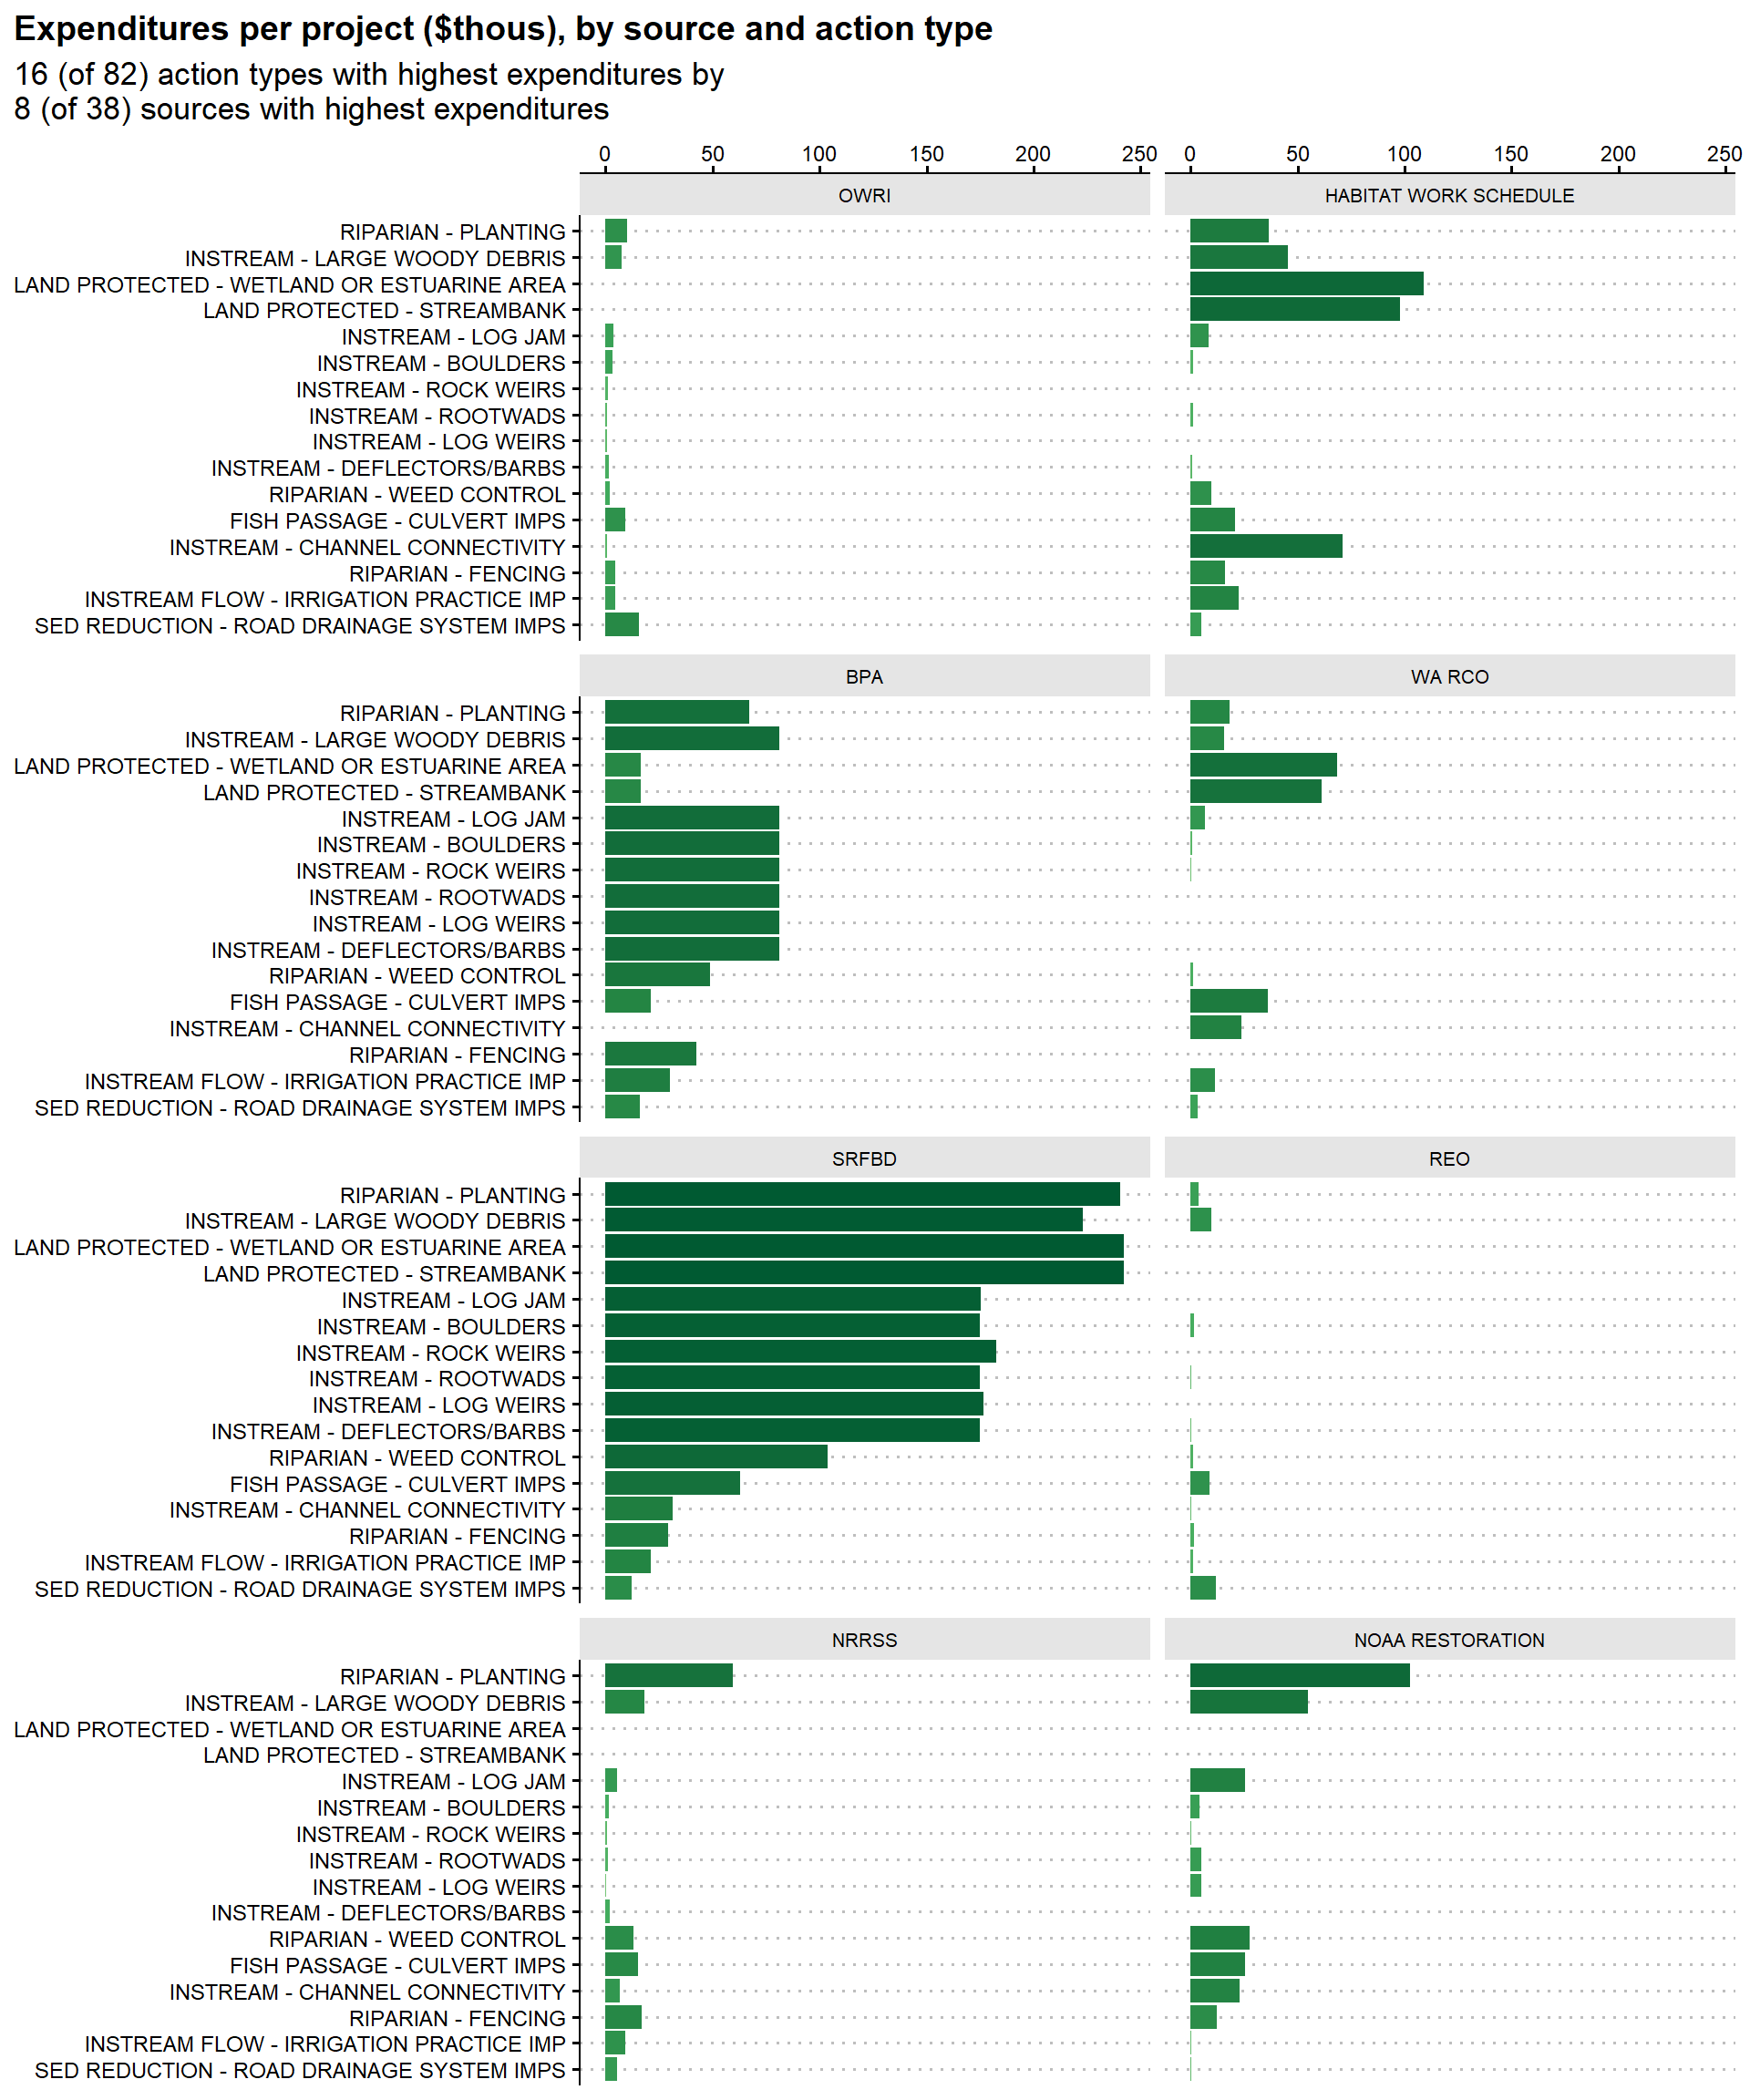
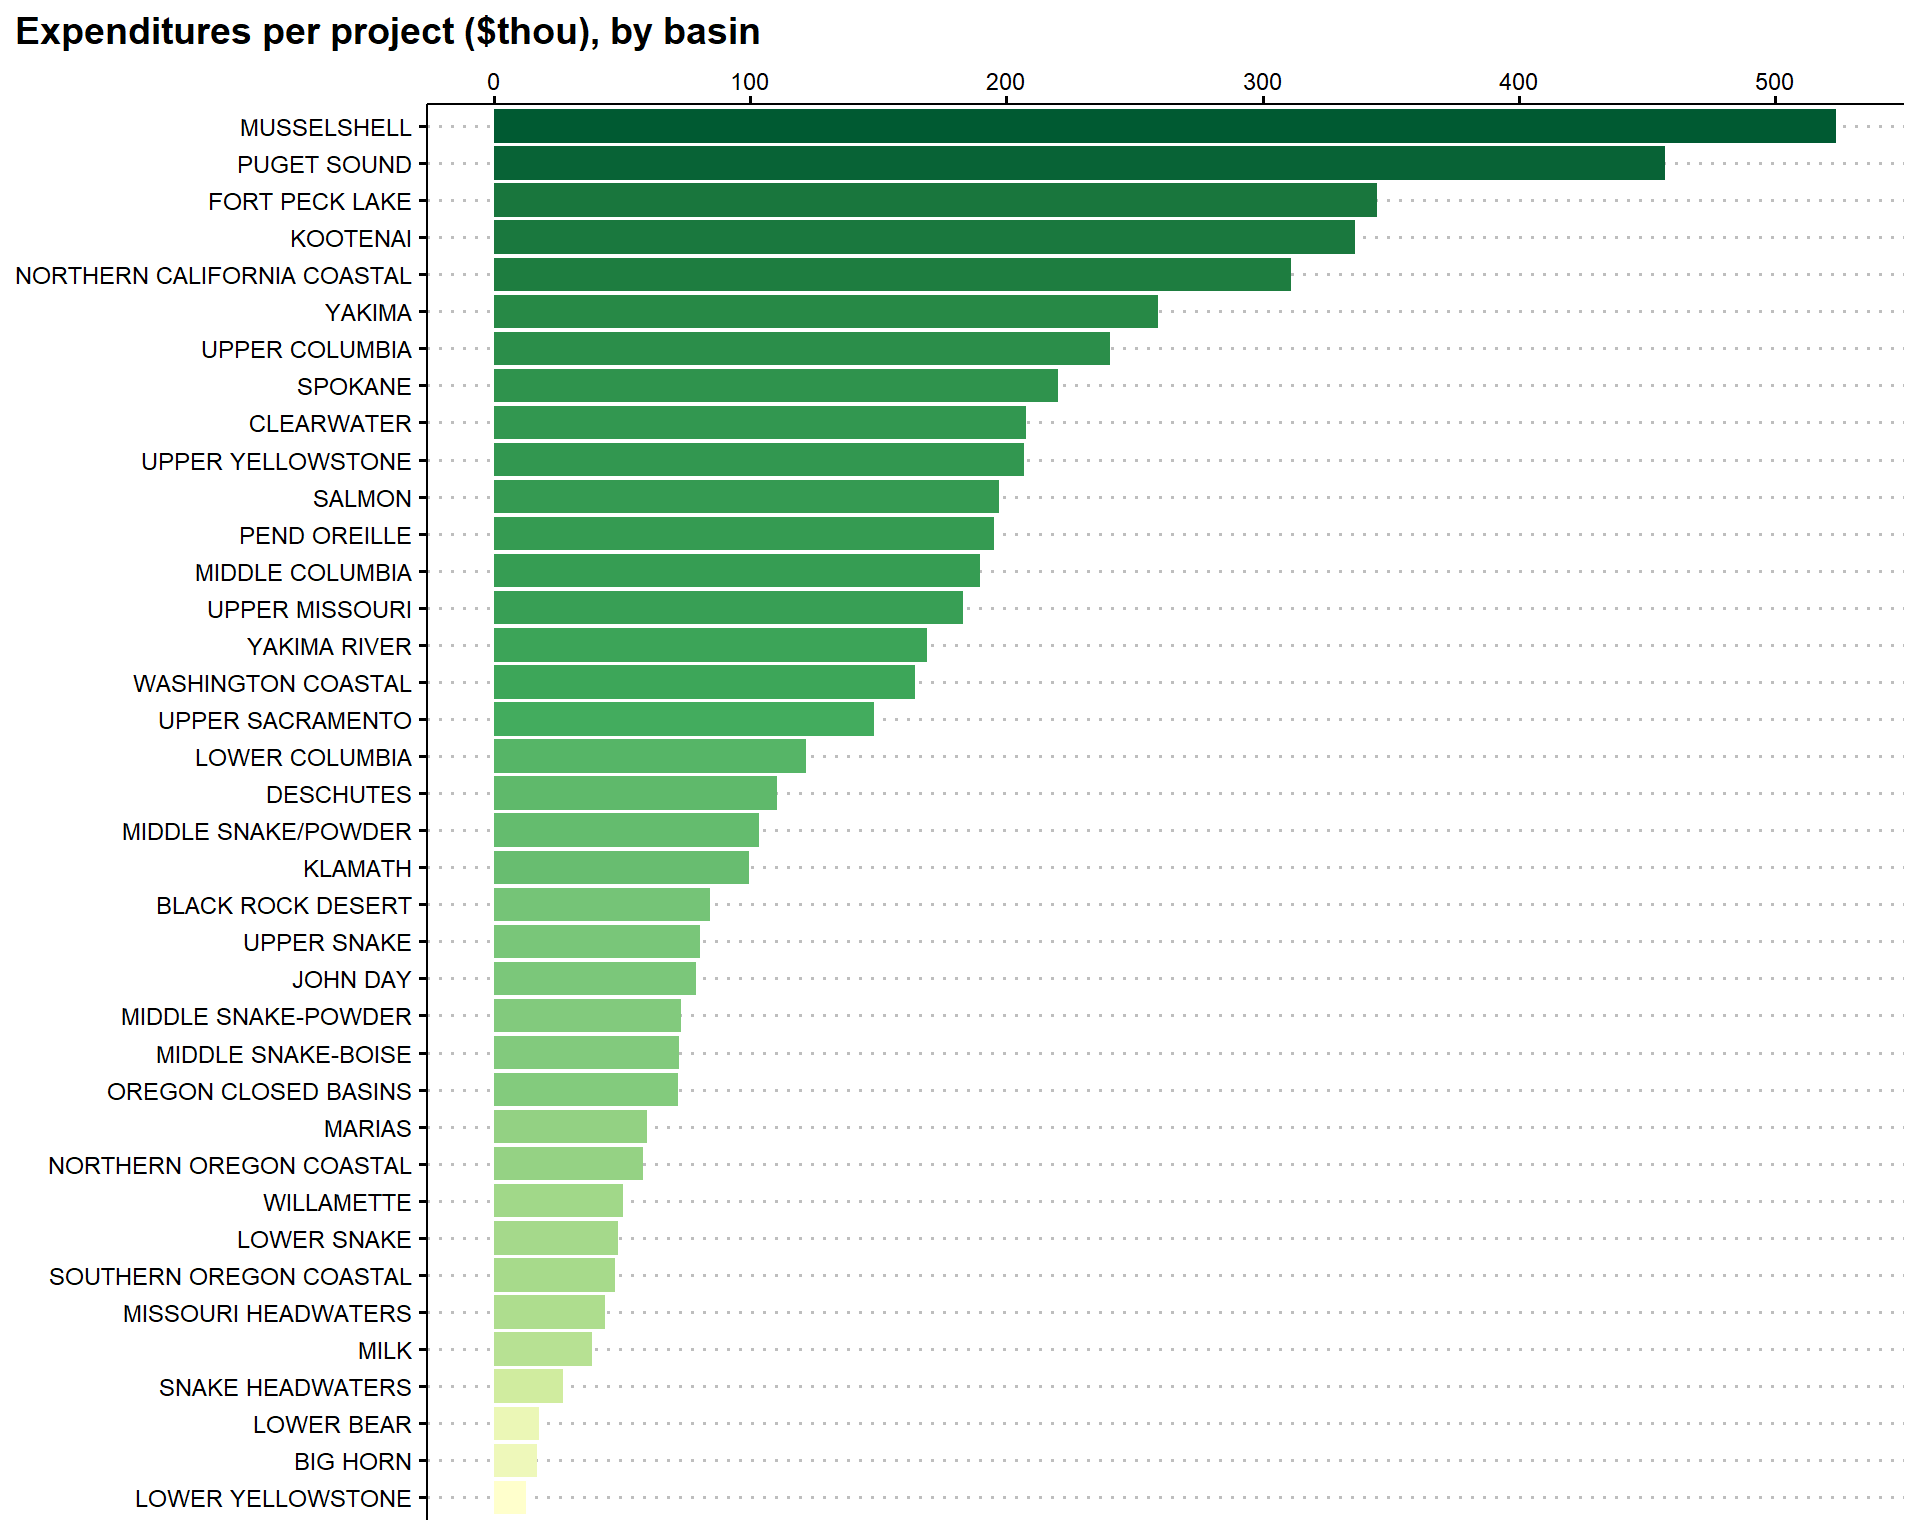
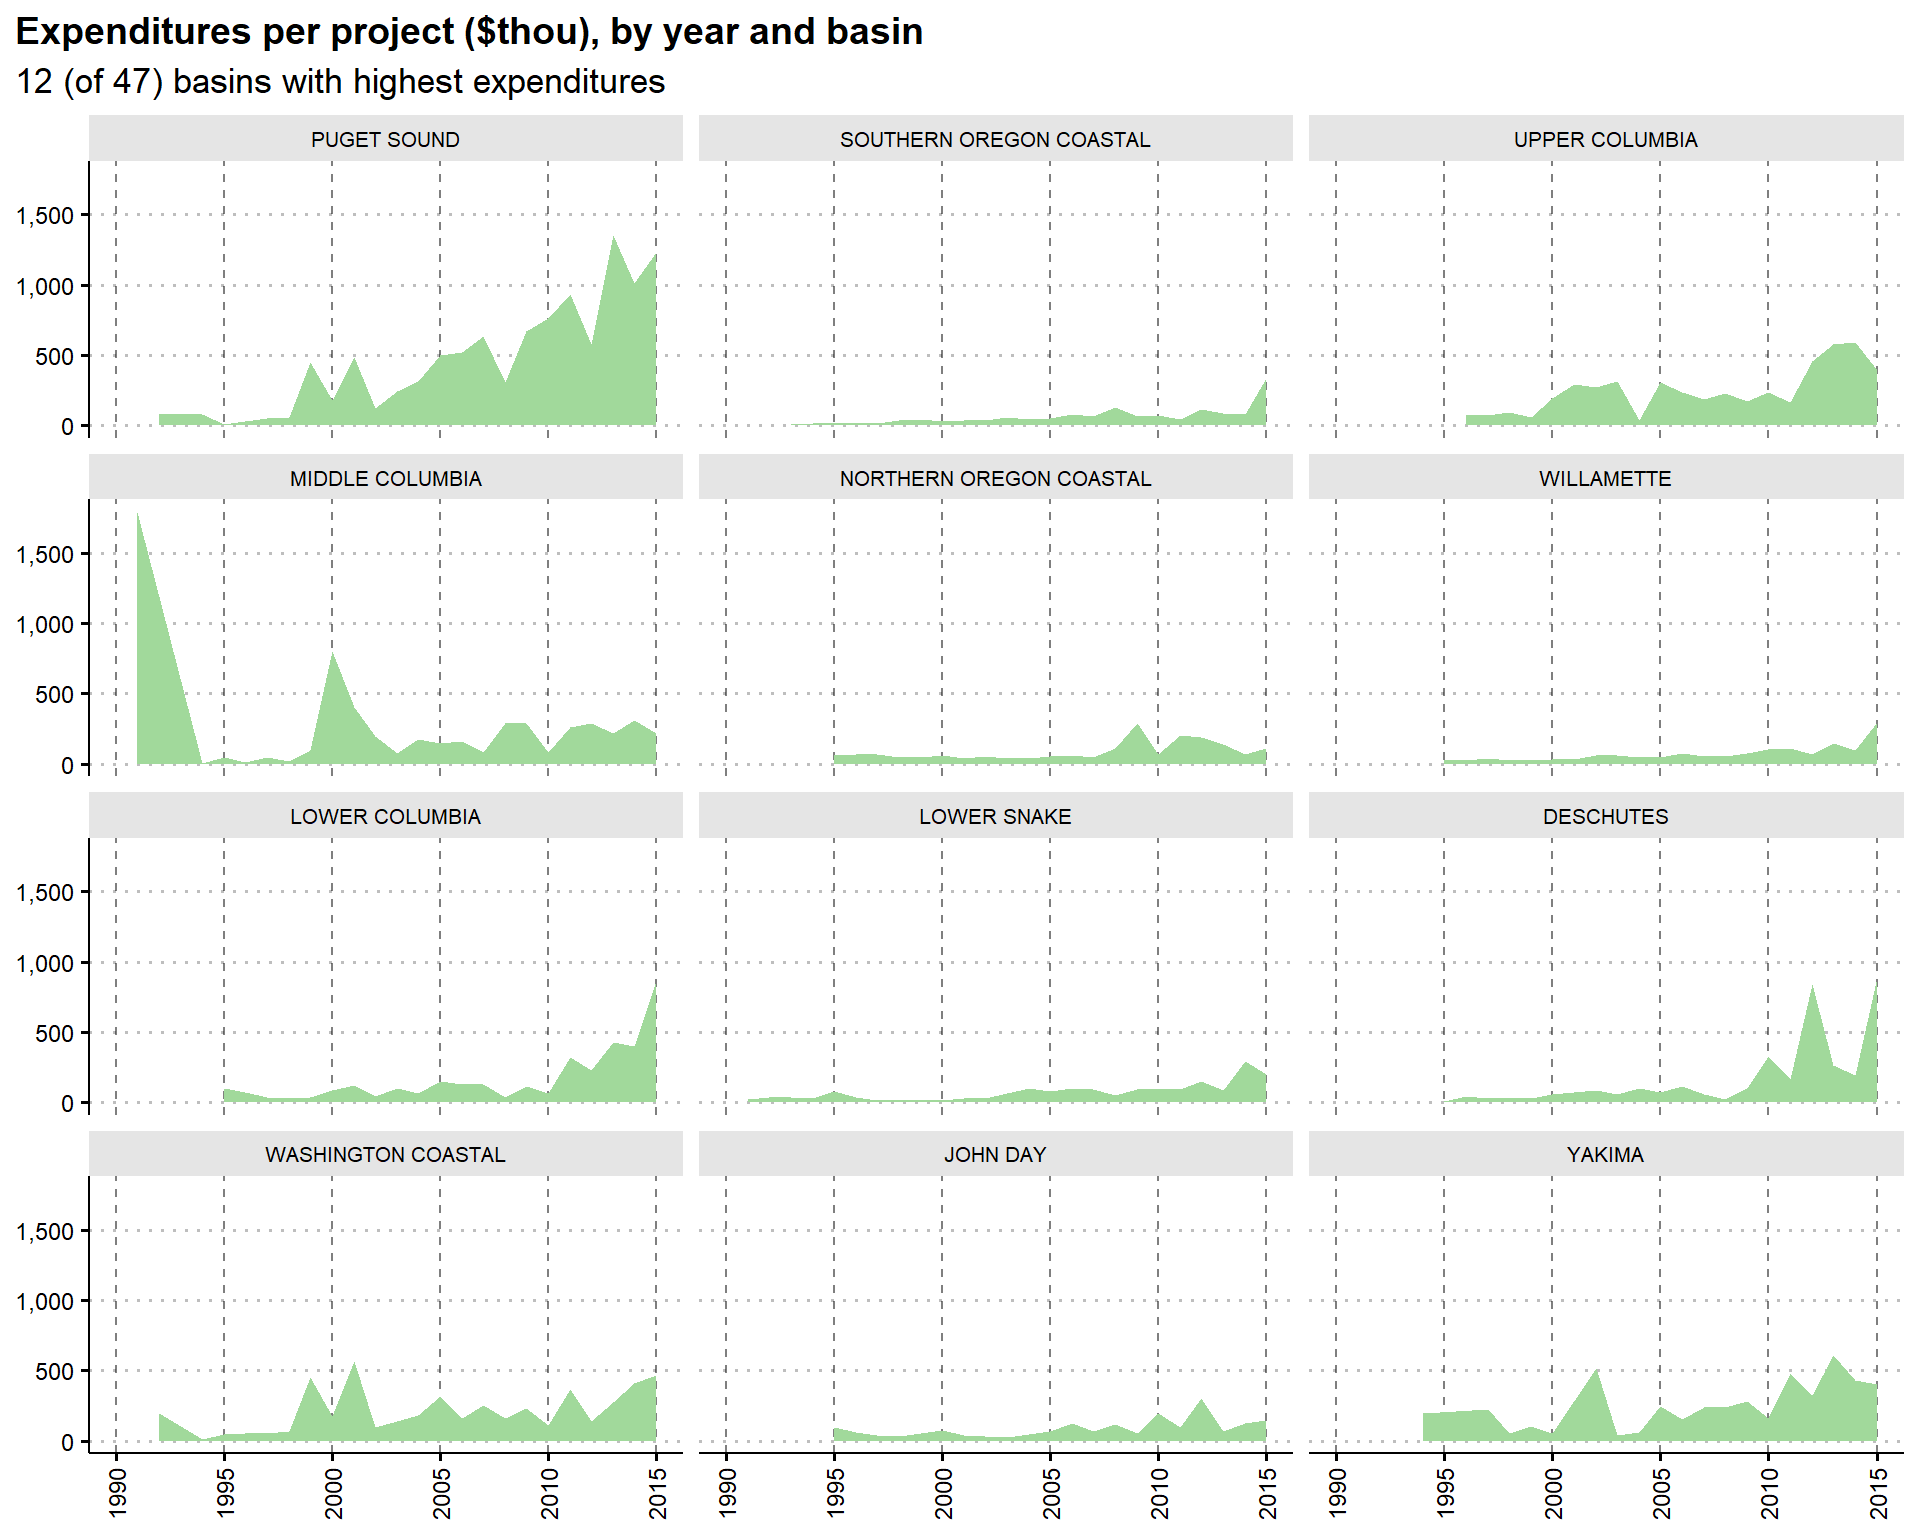
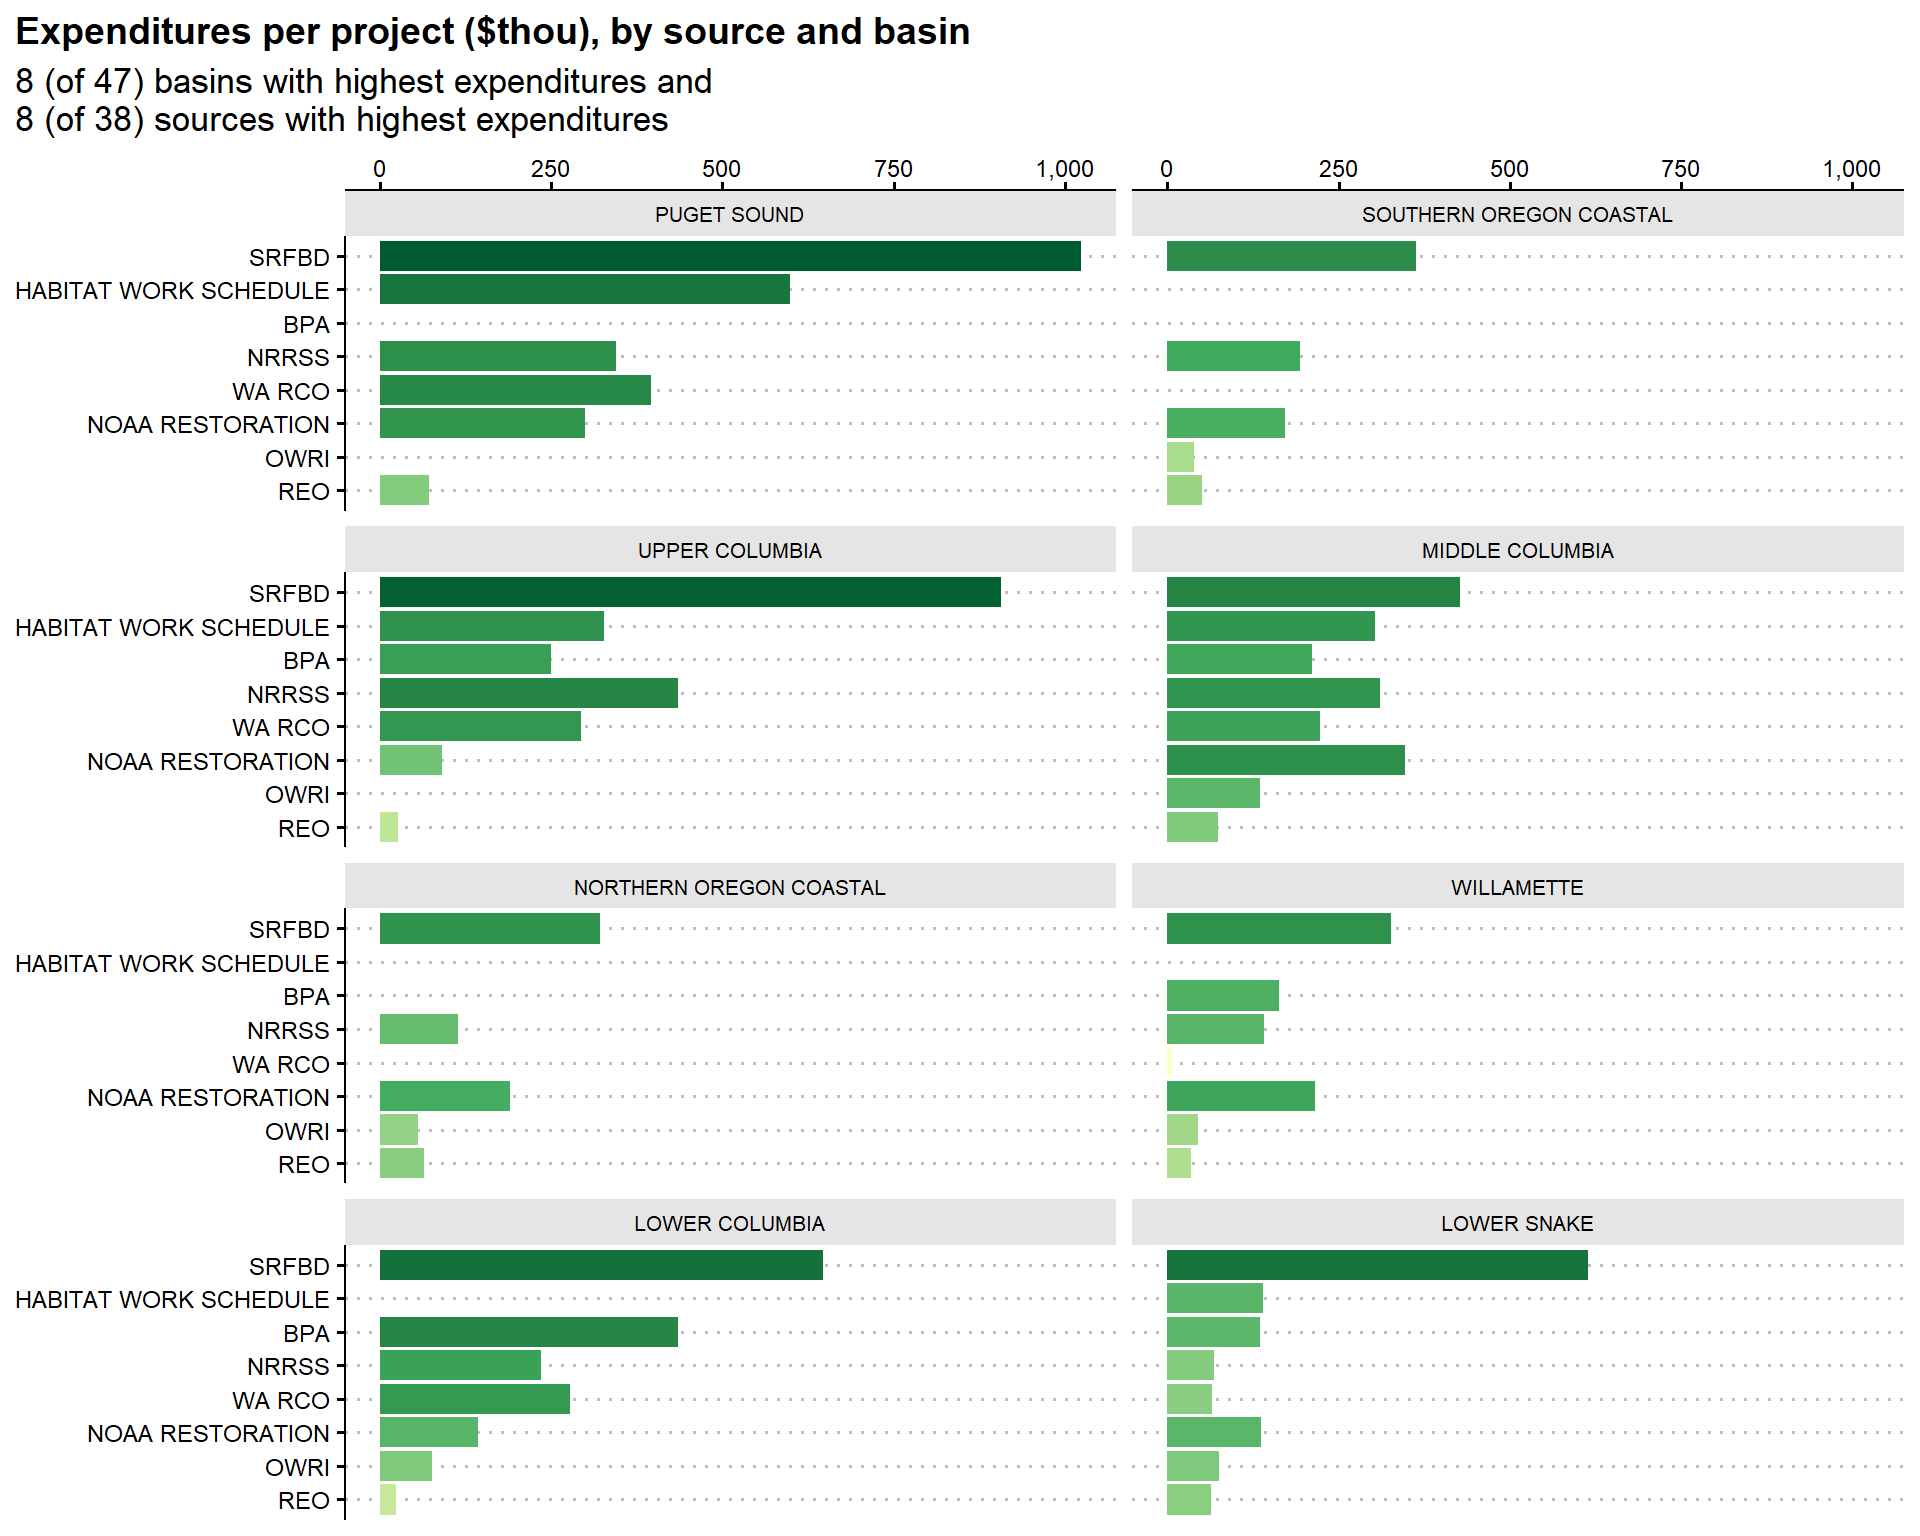
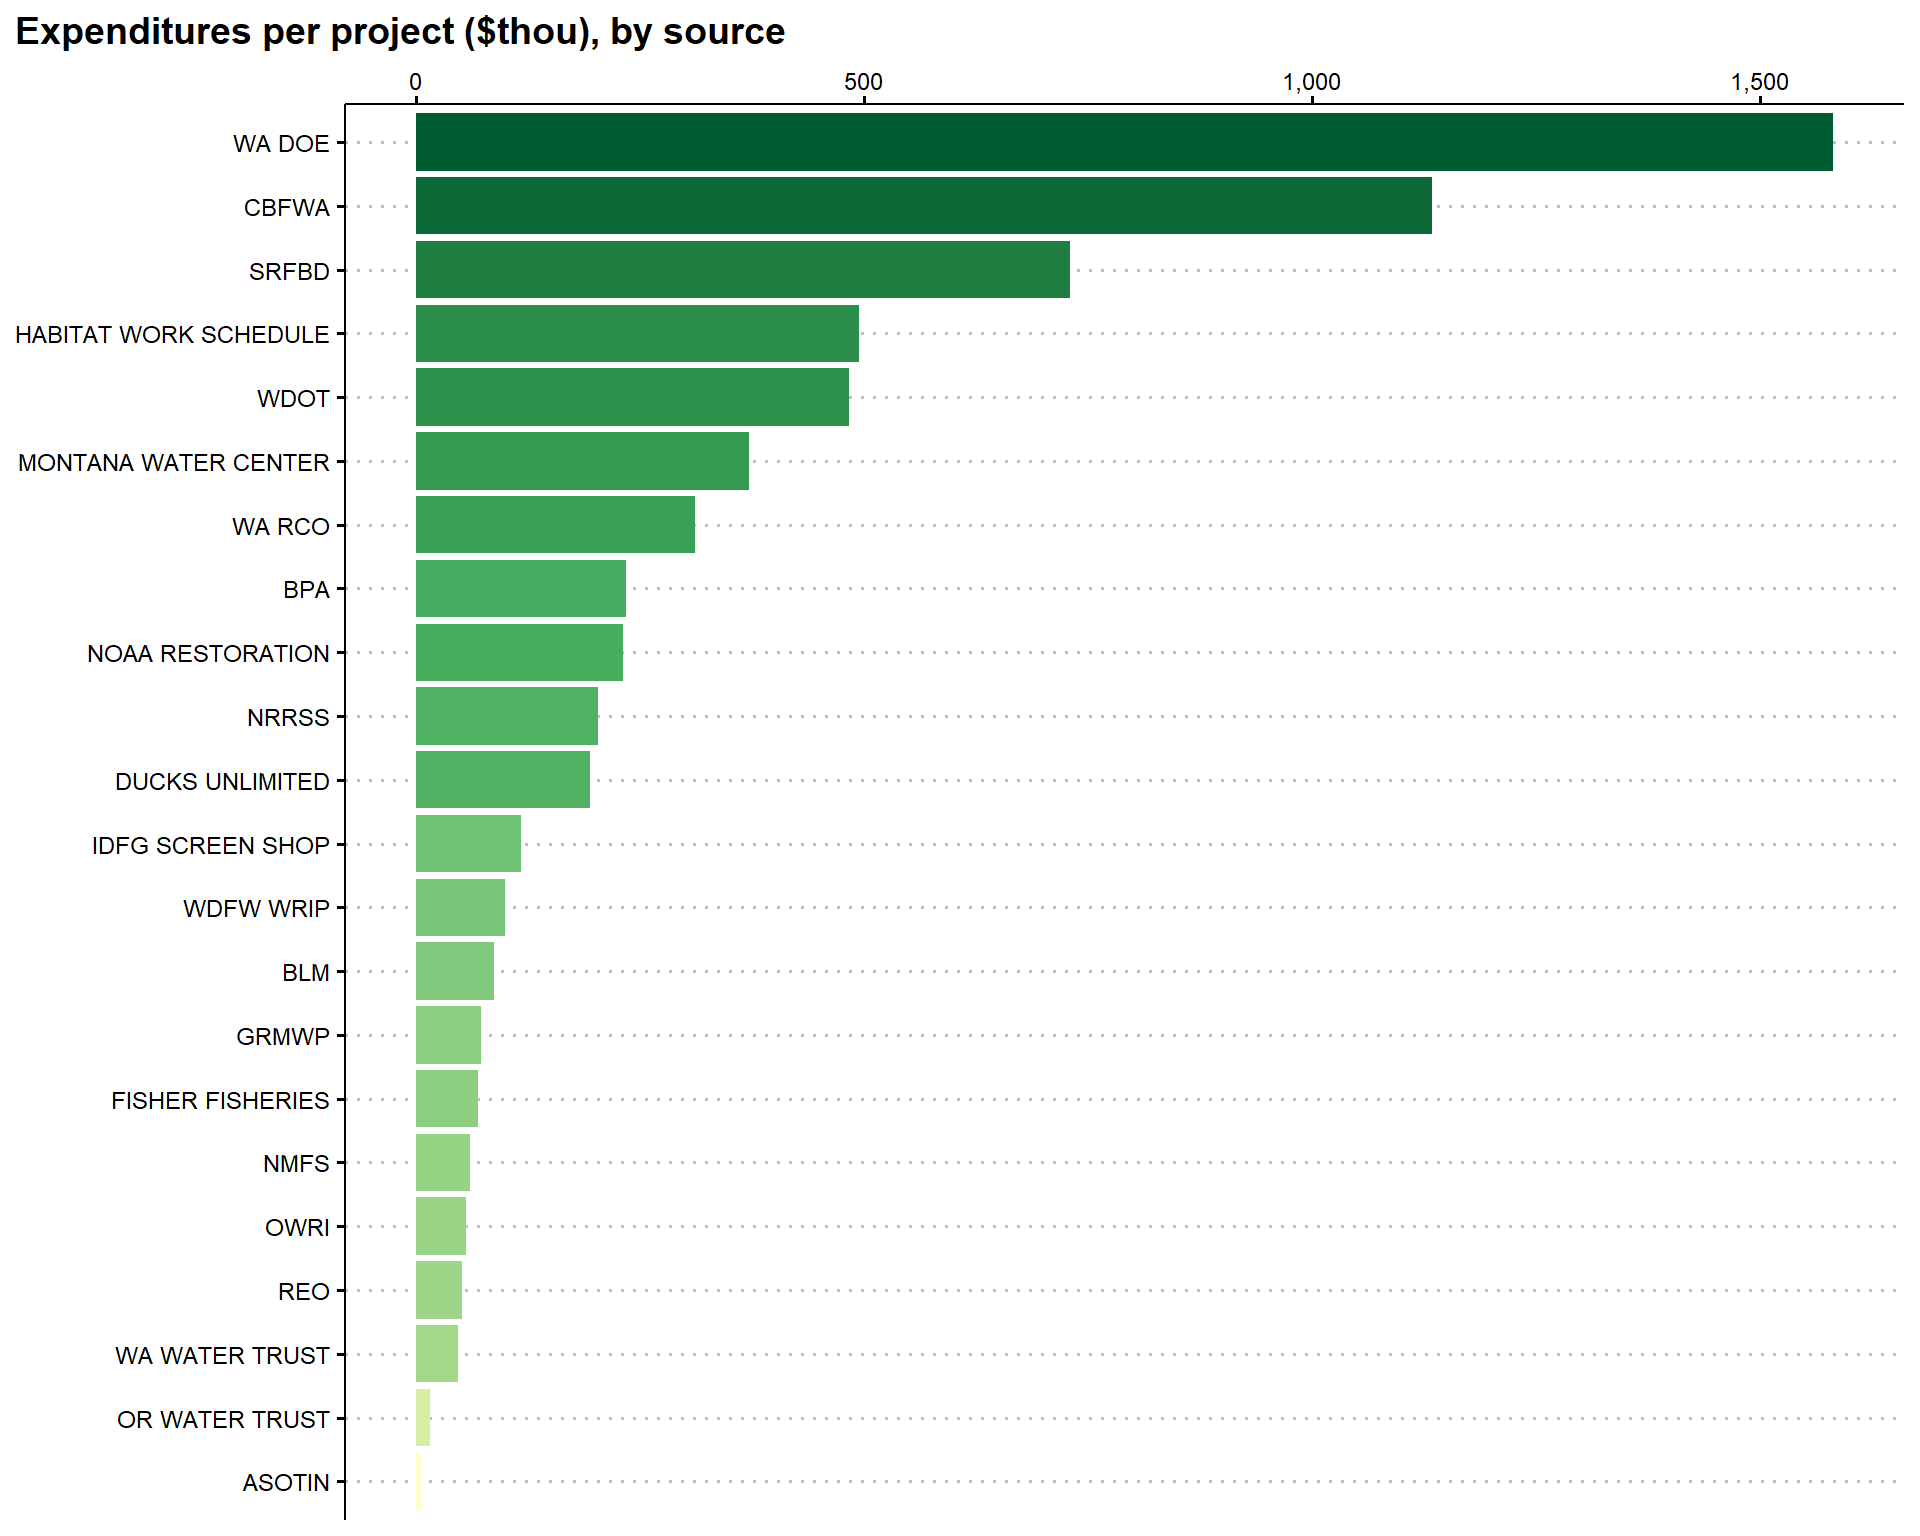
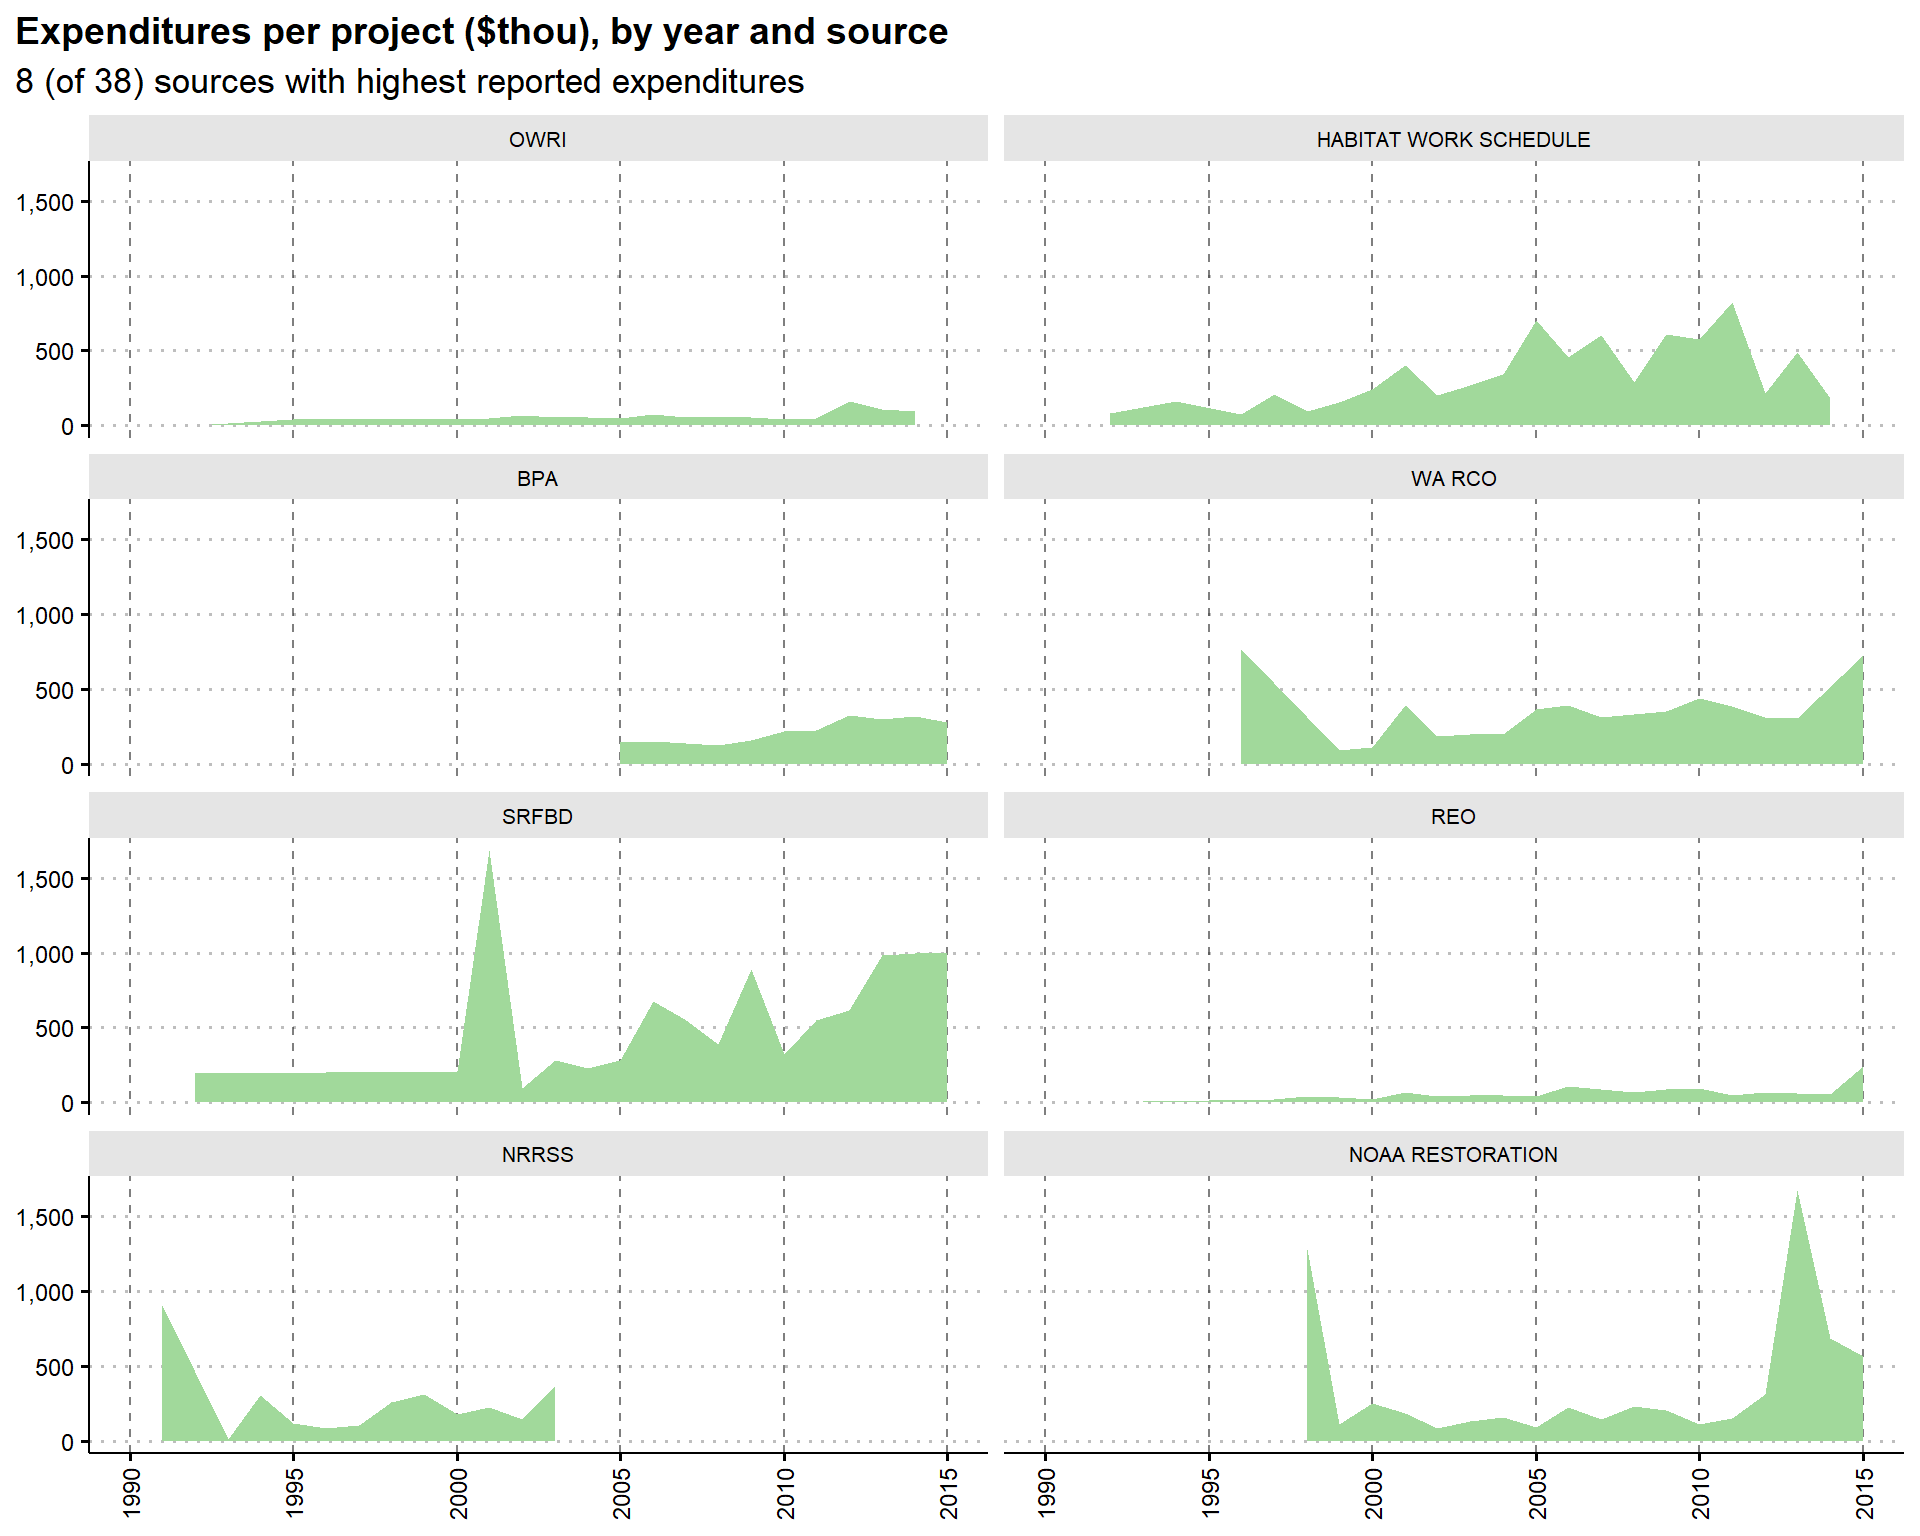
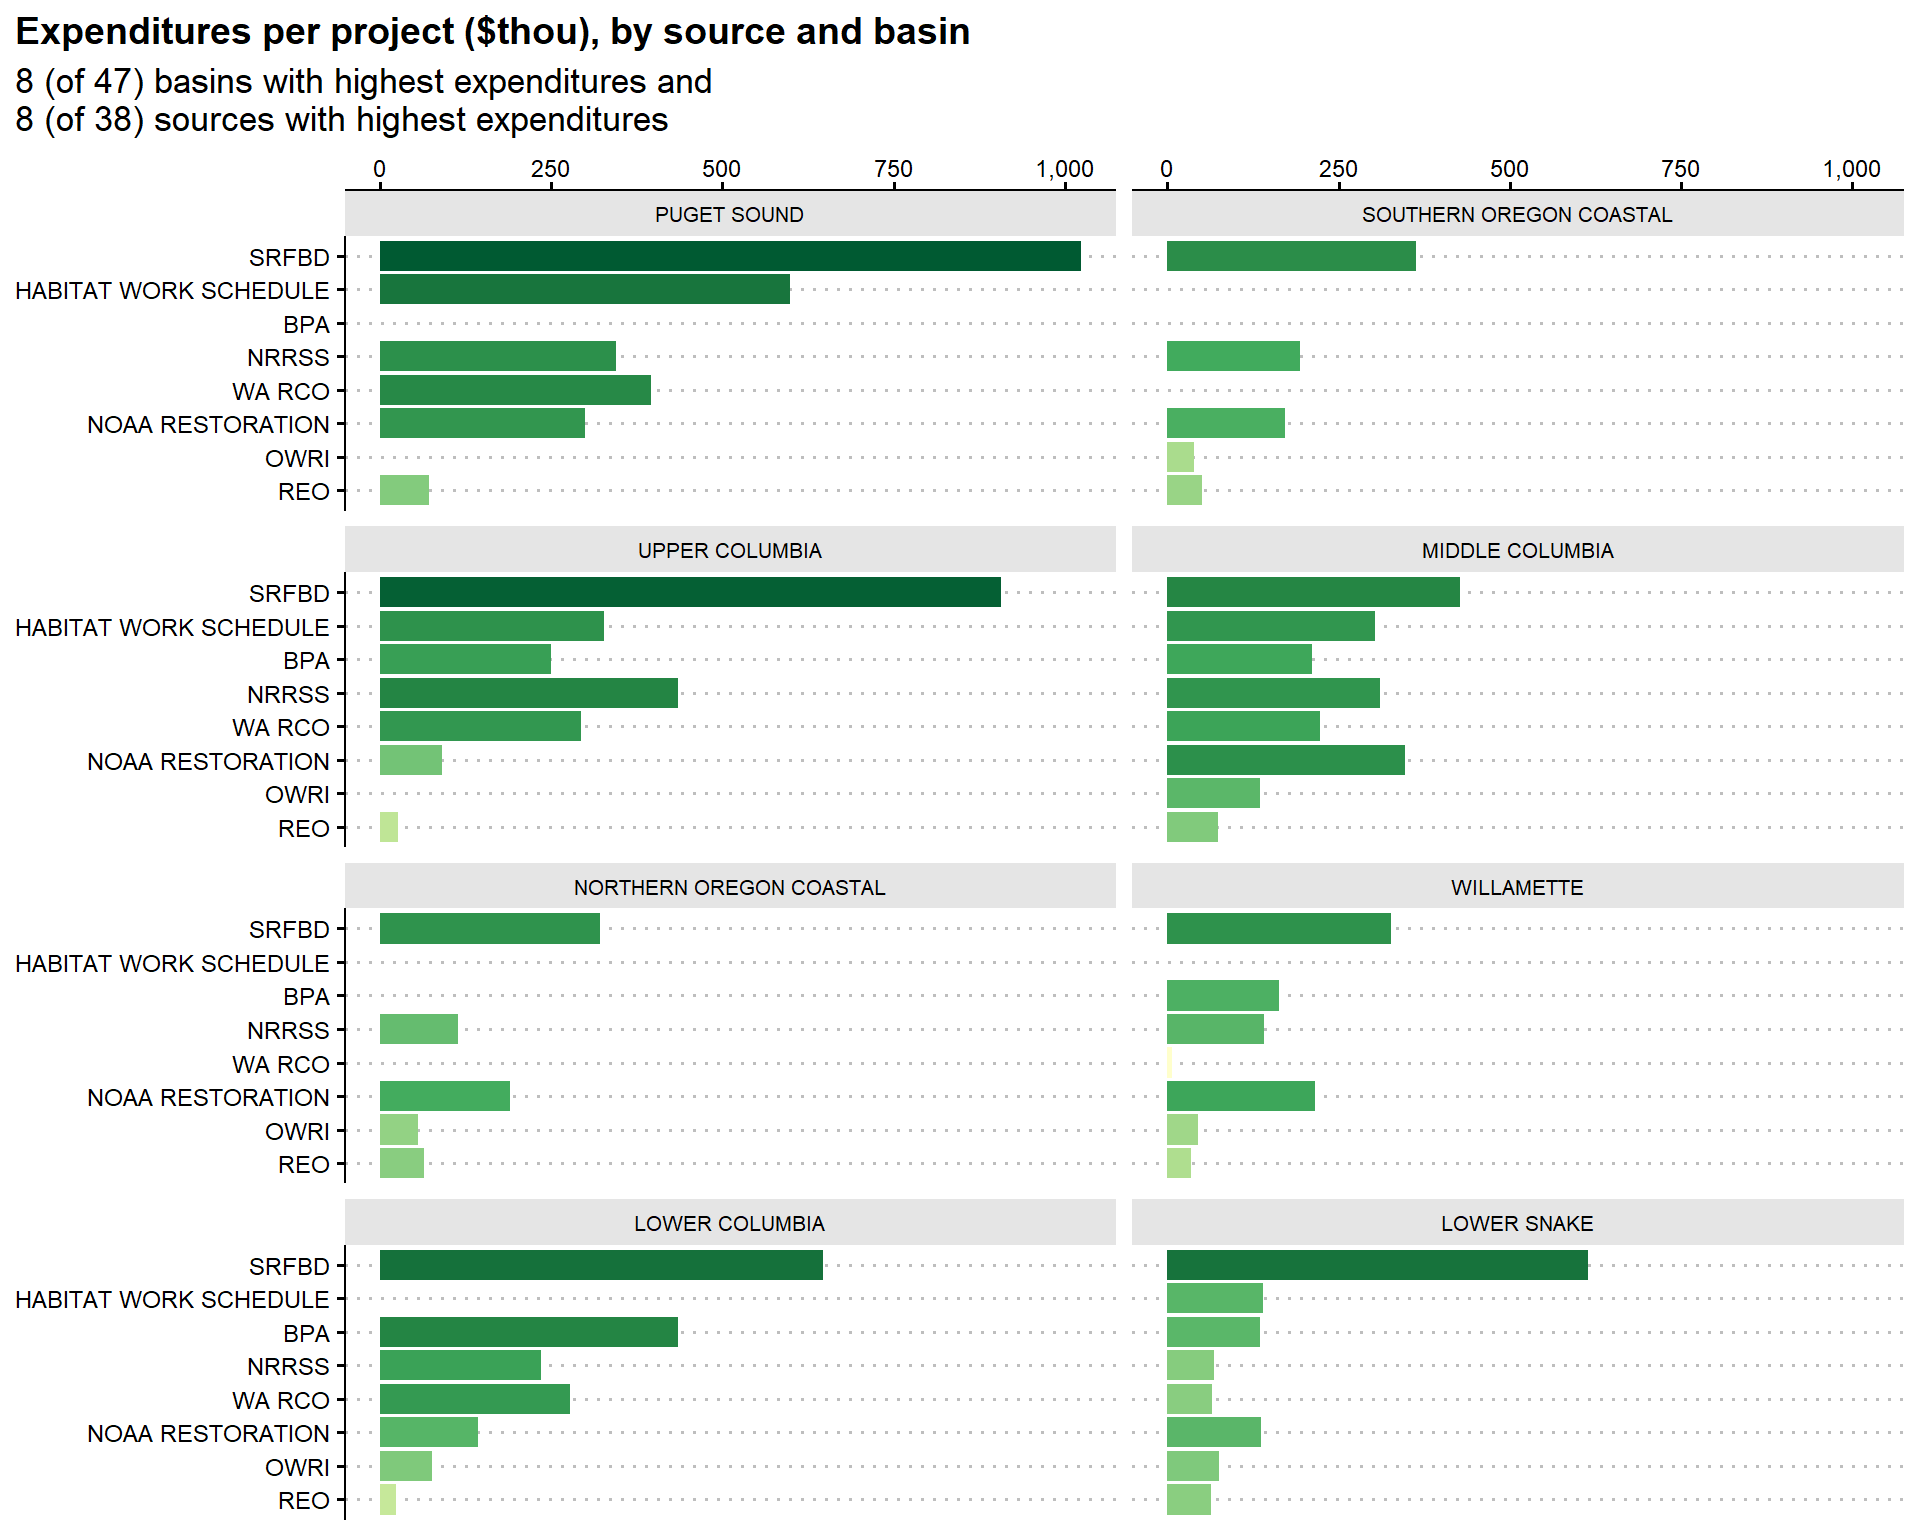
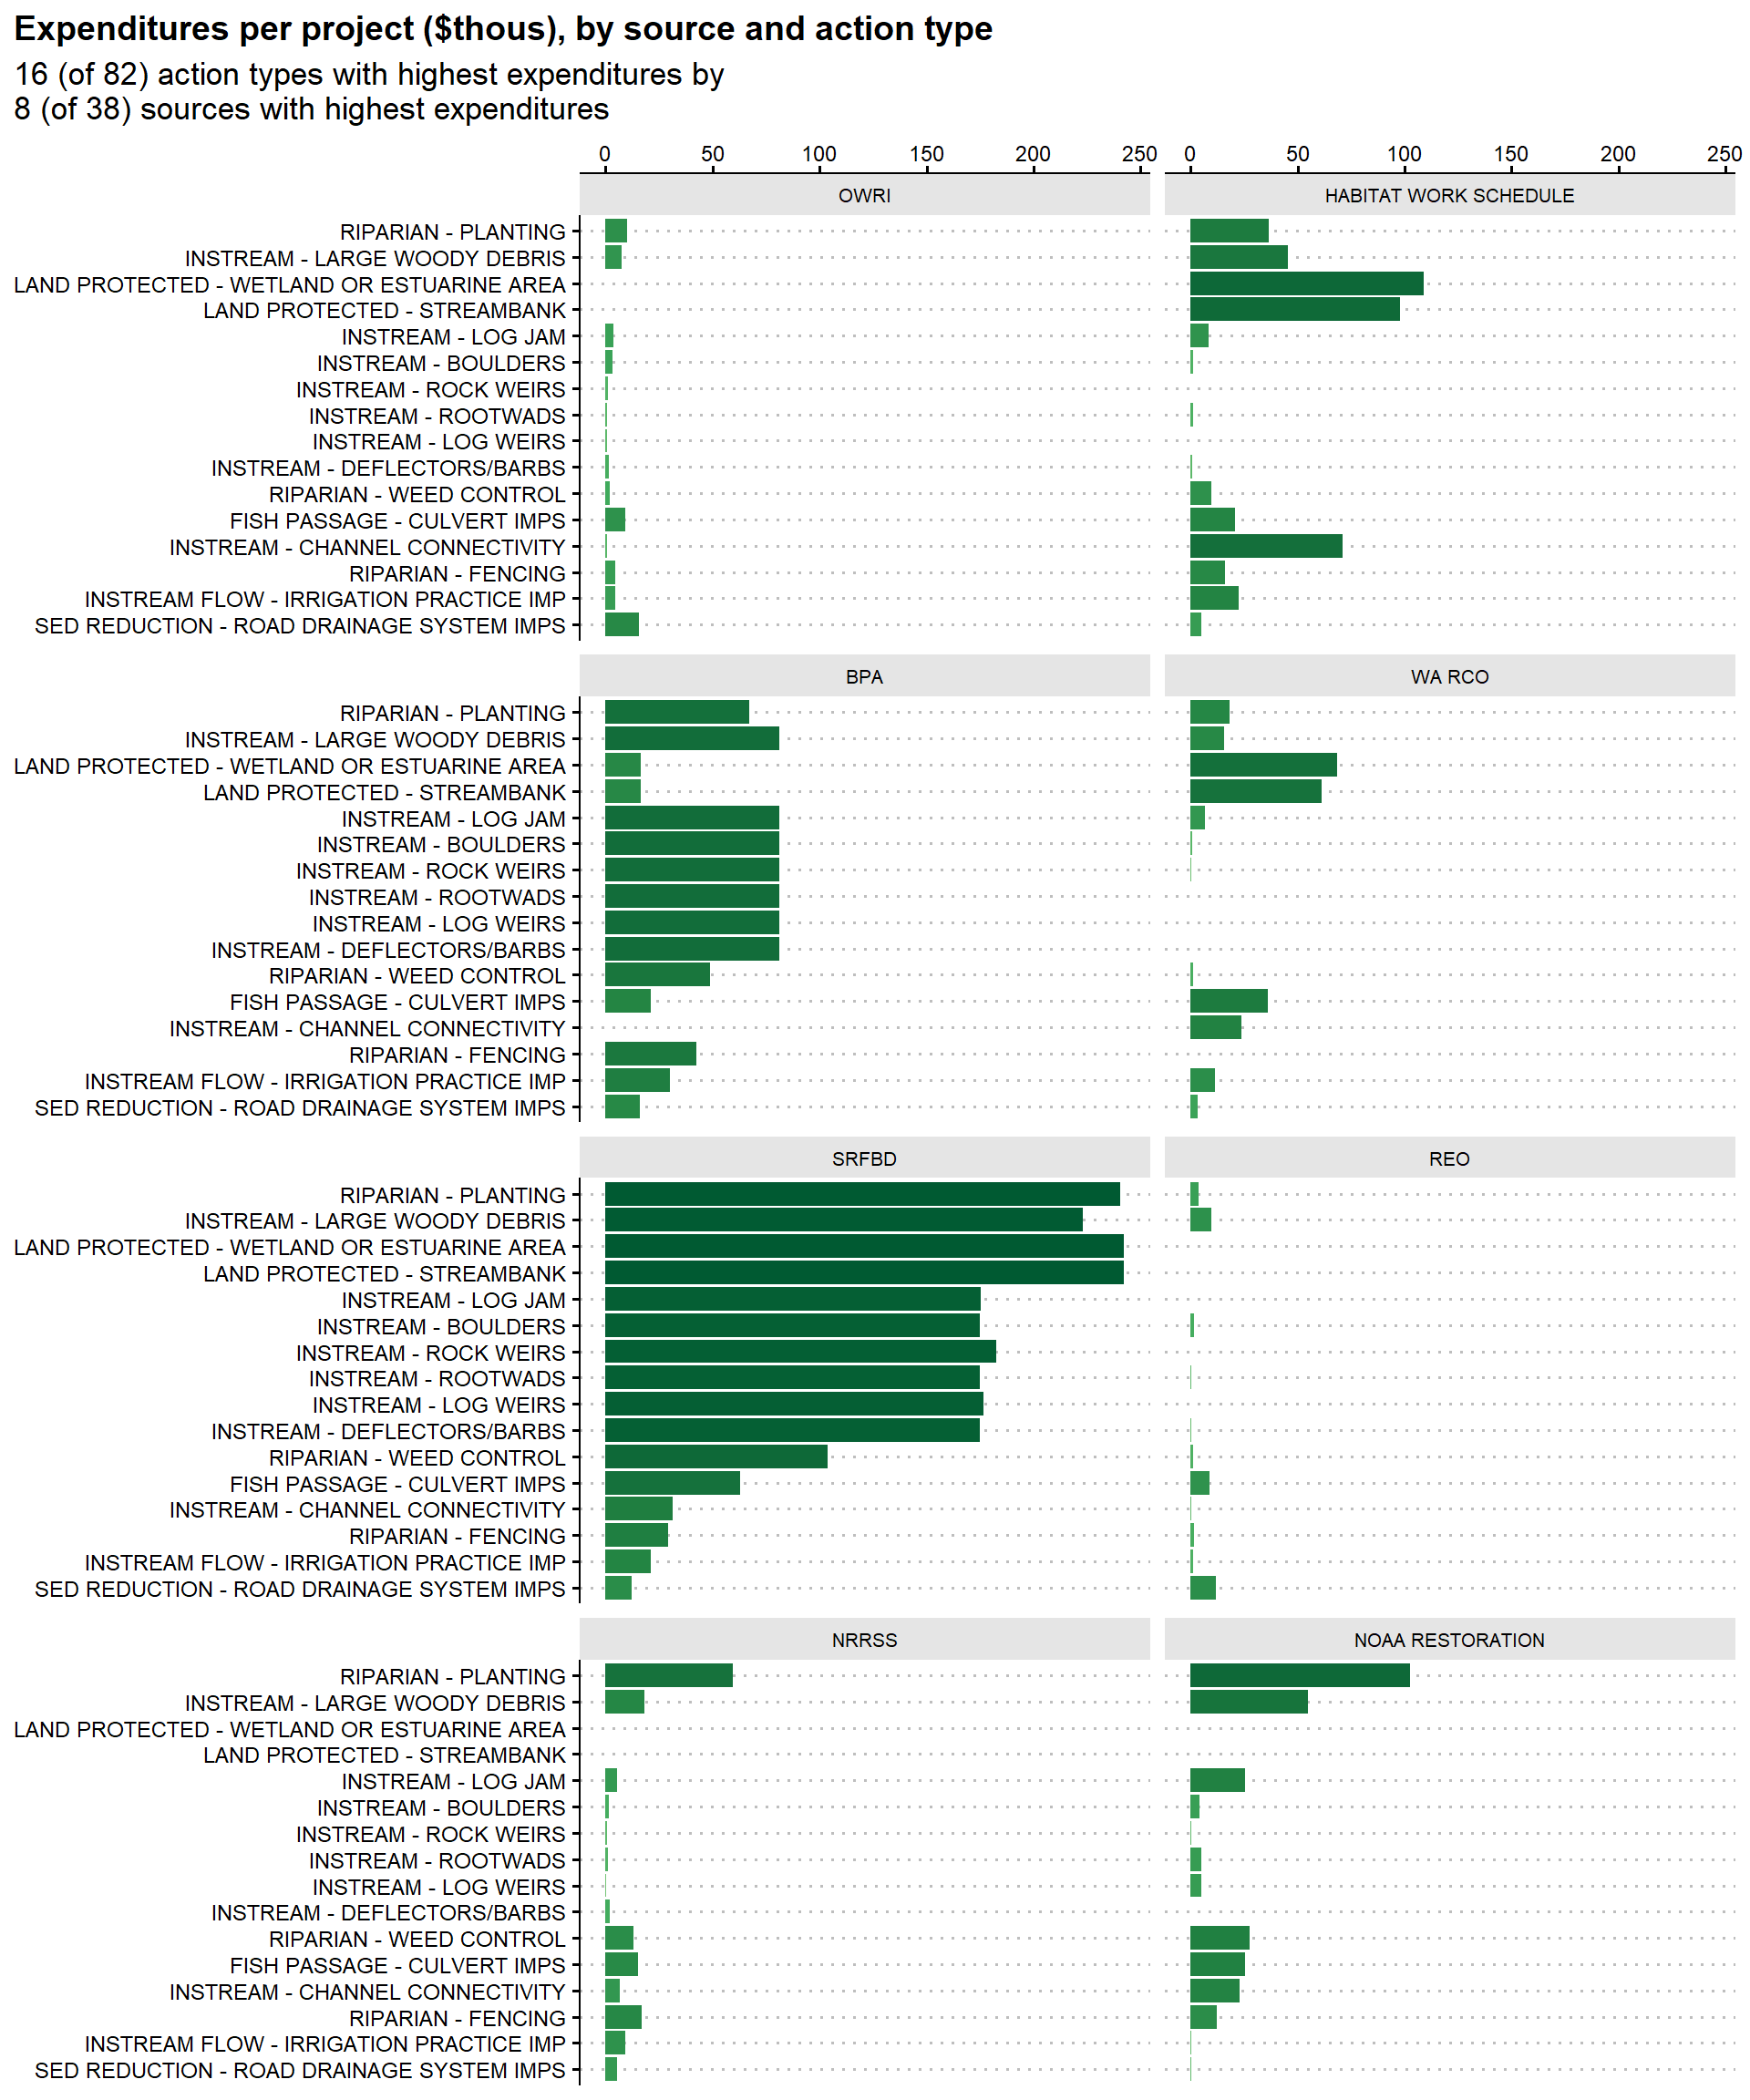
These figures represent expenditures per project with reported costs.
By Year
By Action Type
Observation: Over $250mill has been spent on culvert improvement projects, making it the action with the third highest associated expenditures. However, per project costs for these projects is ranked much lower. This spending is spread concentrated along the western side of the Cascades (Puget Sound, Oregon Coastal, Willamette).
By Basin
By Reporting Source
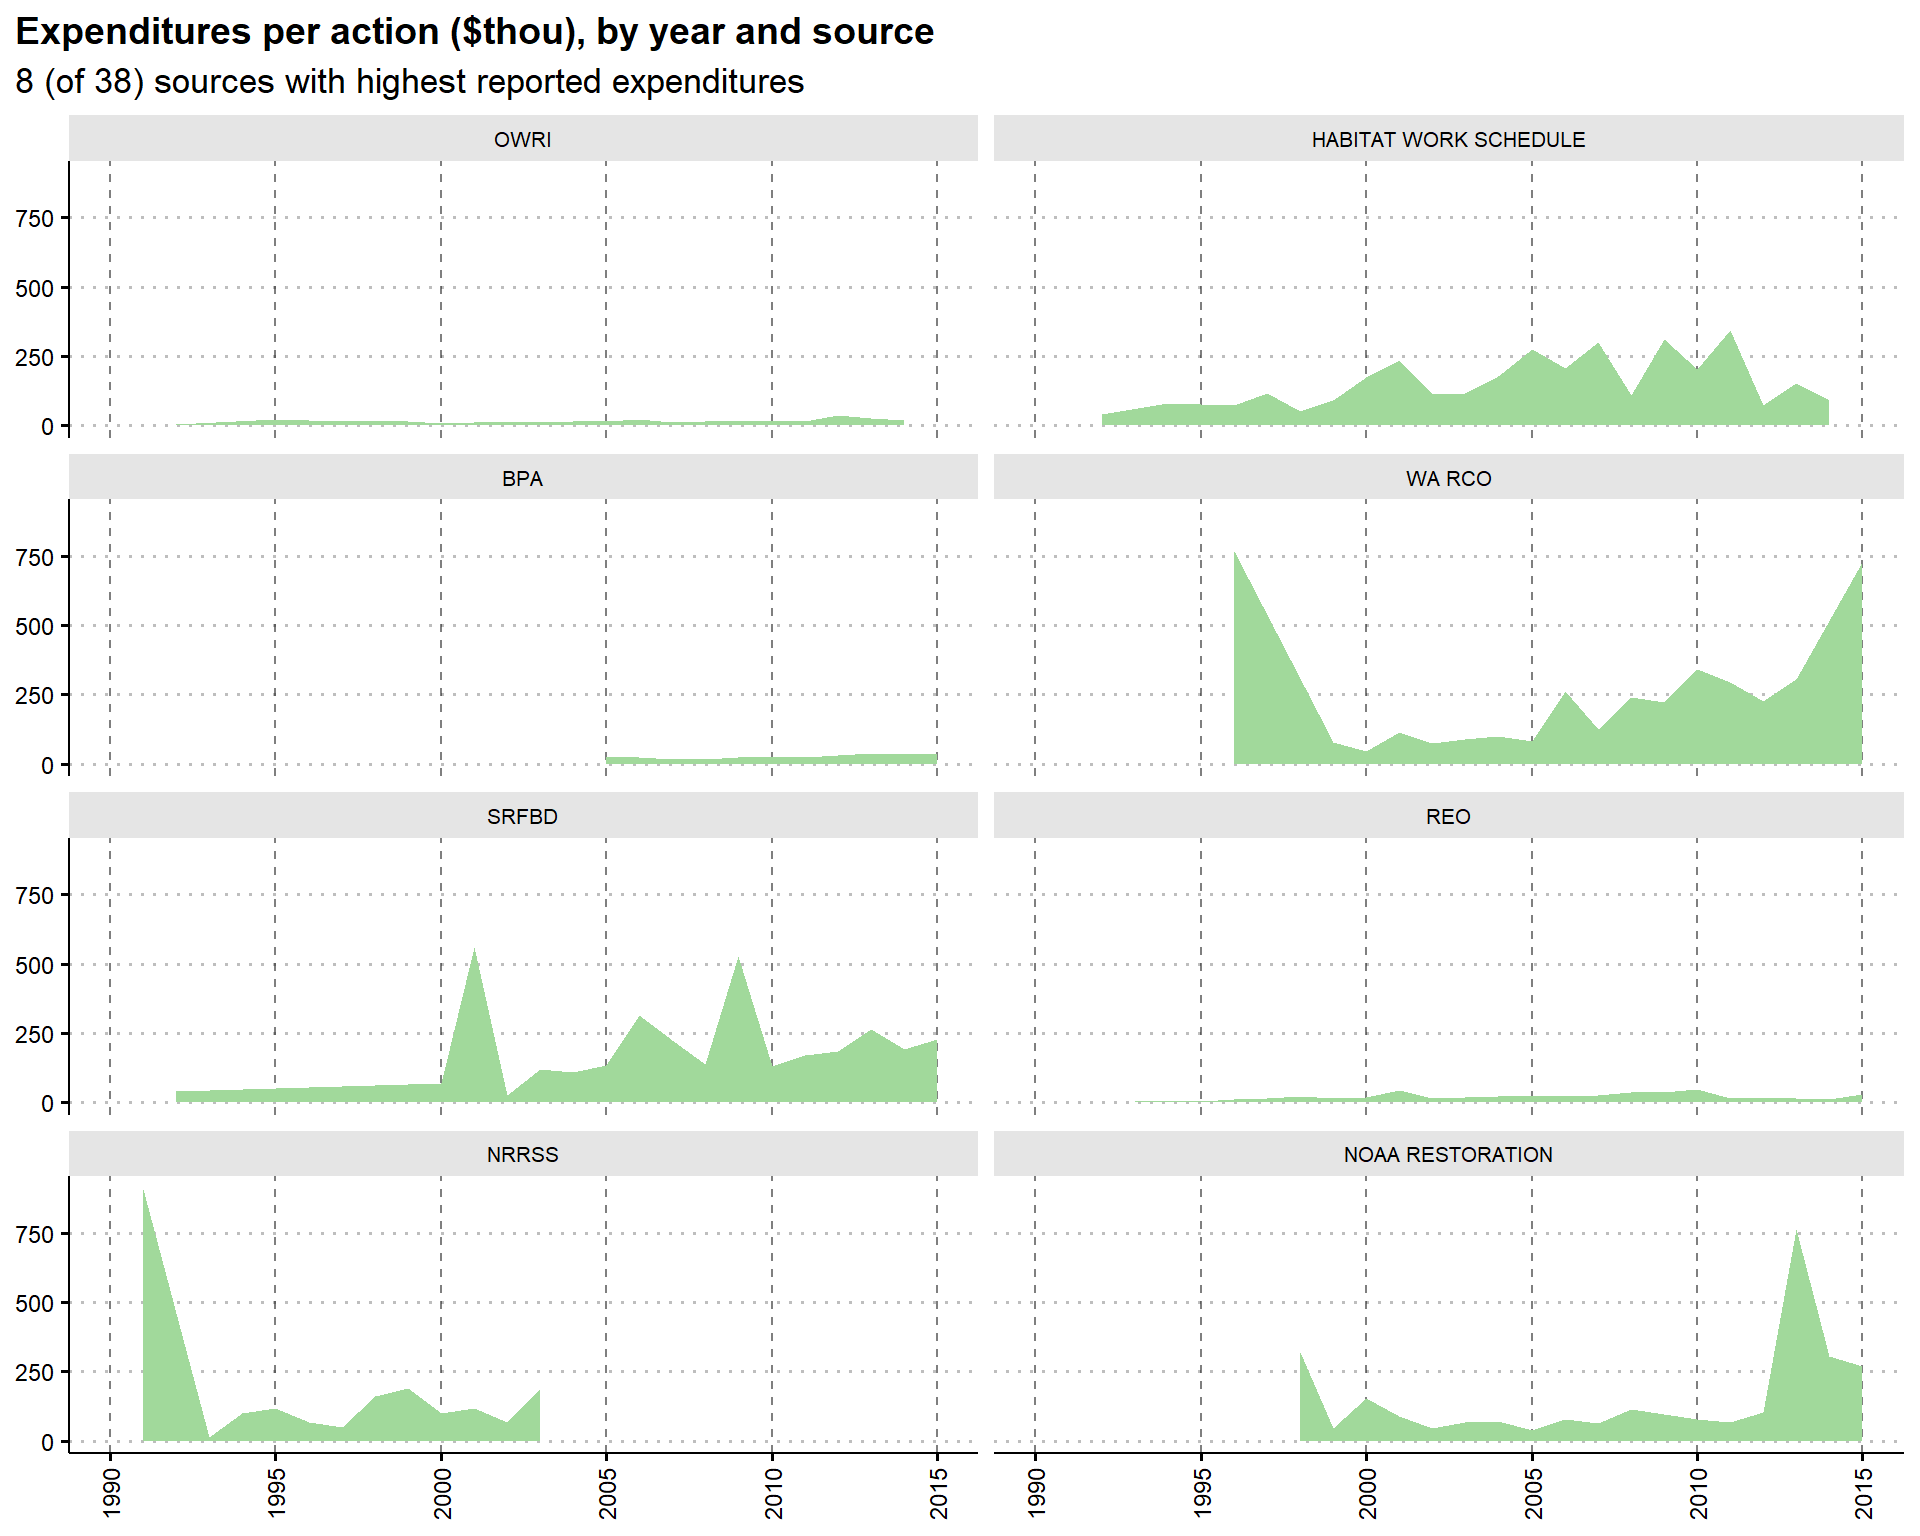
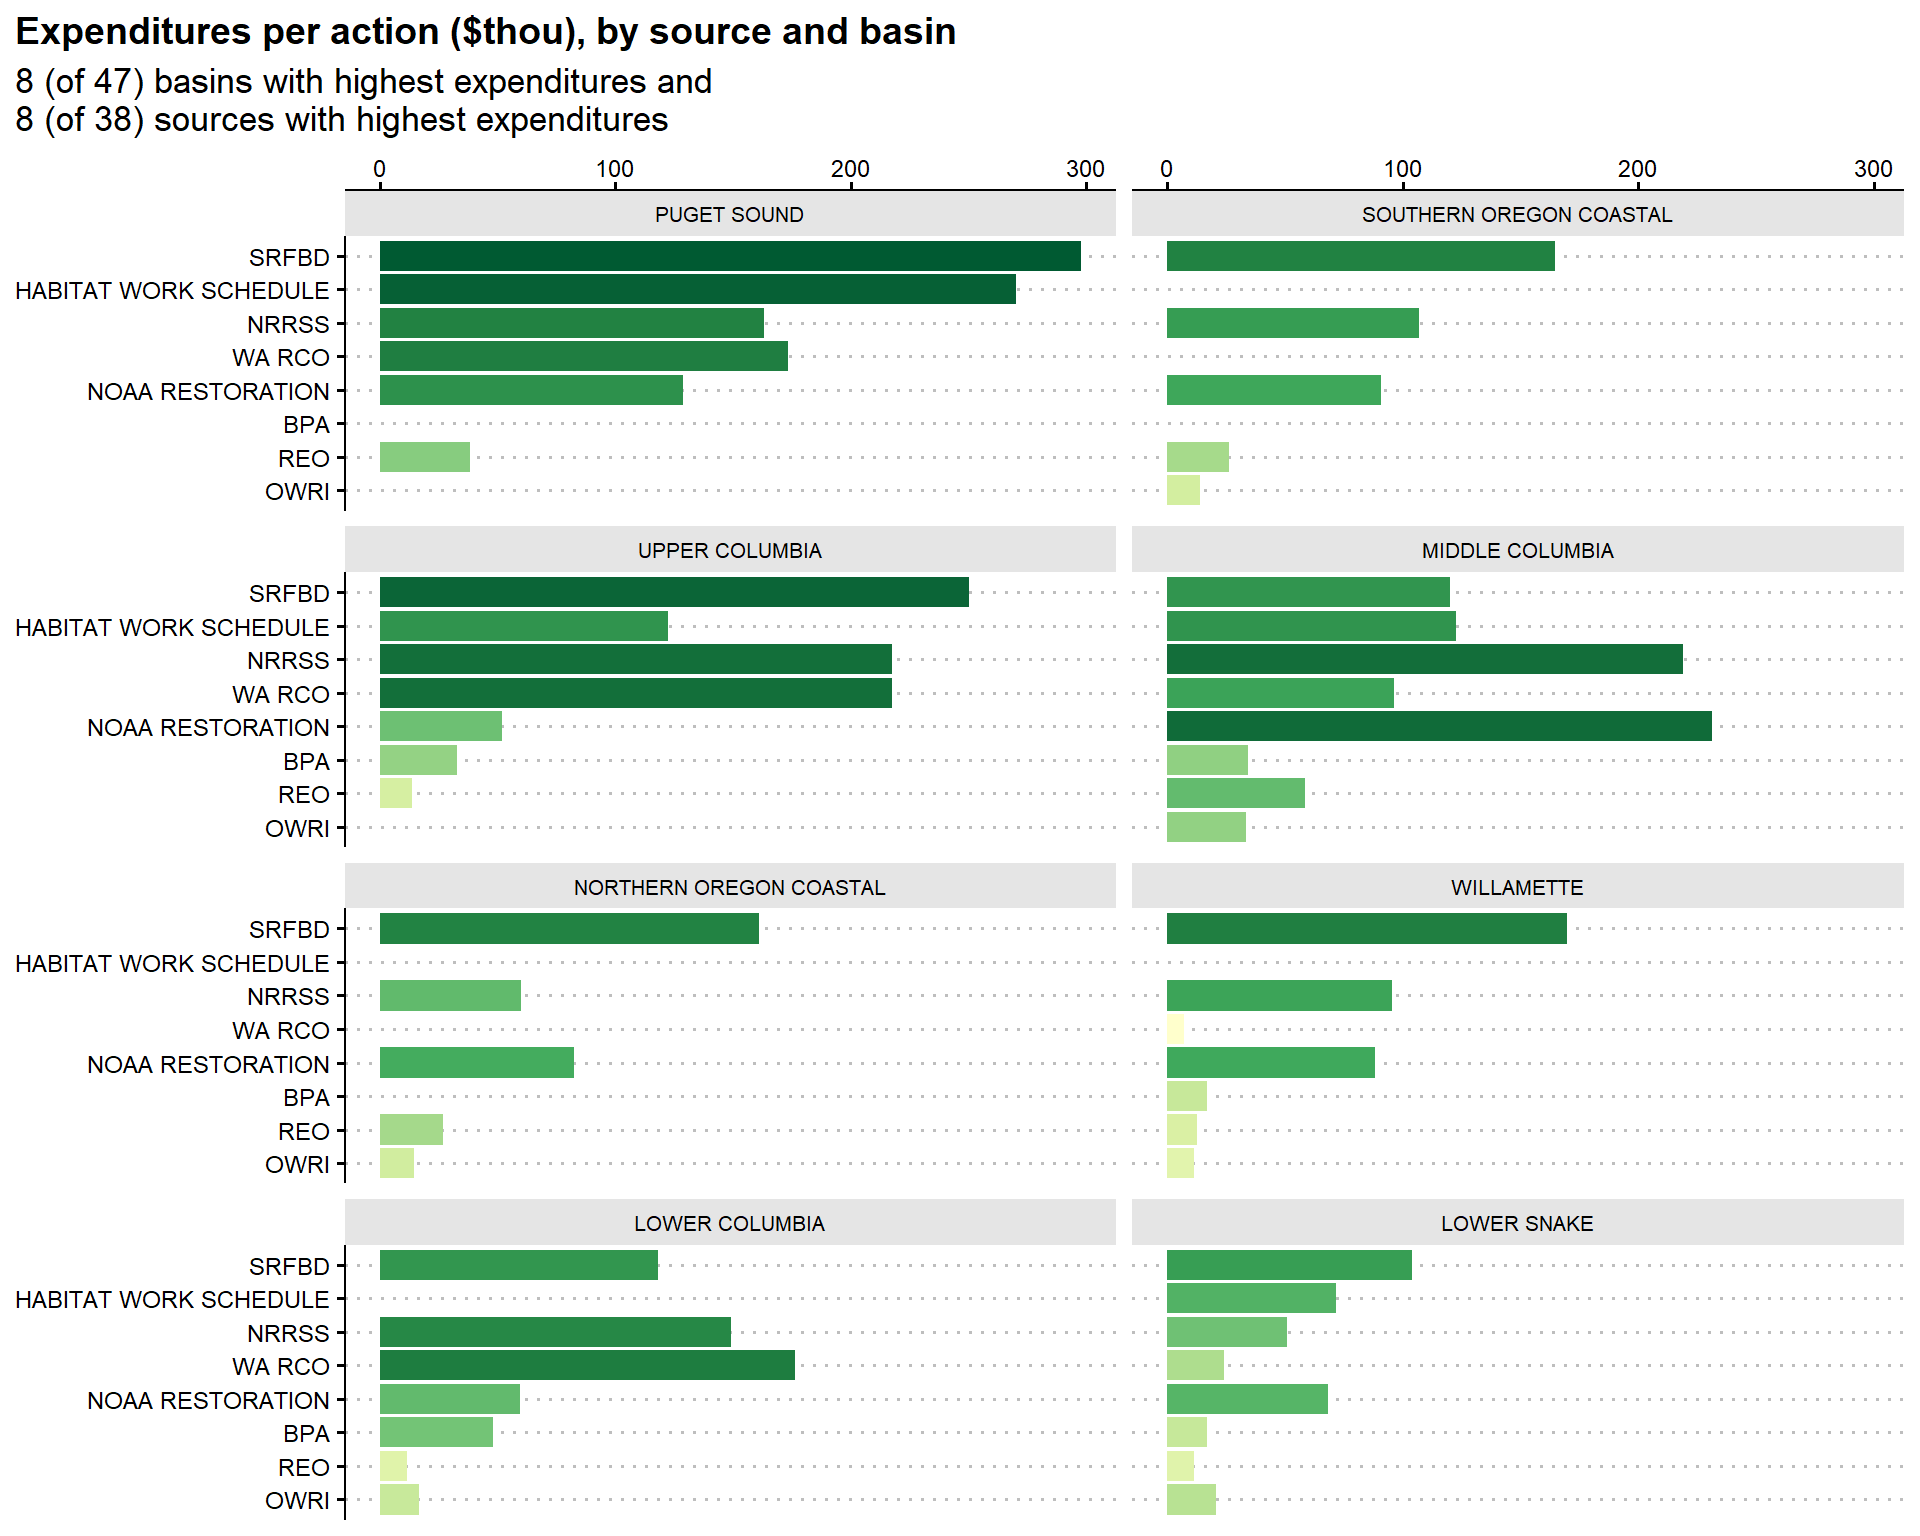
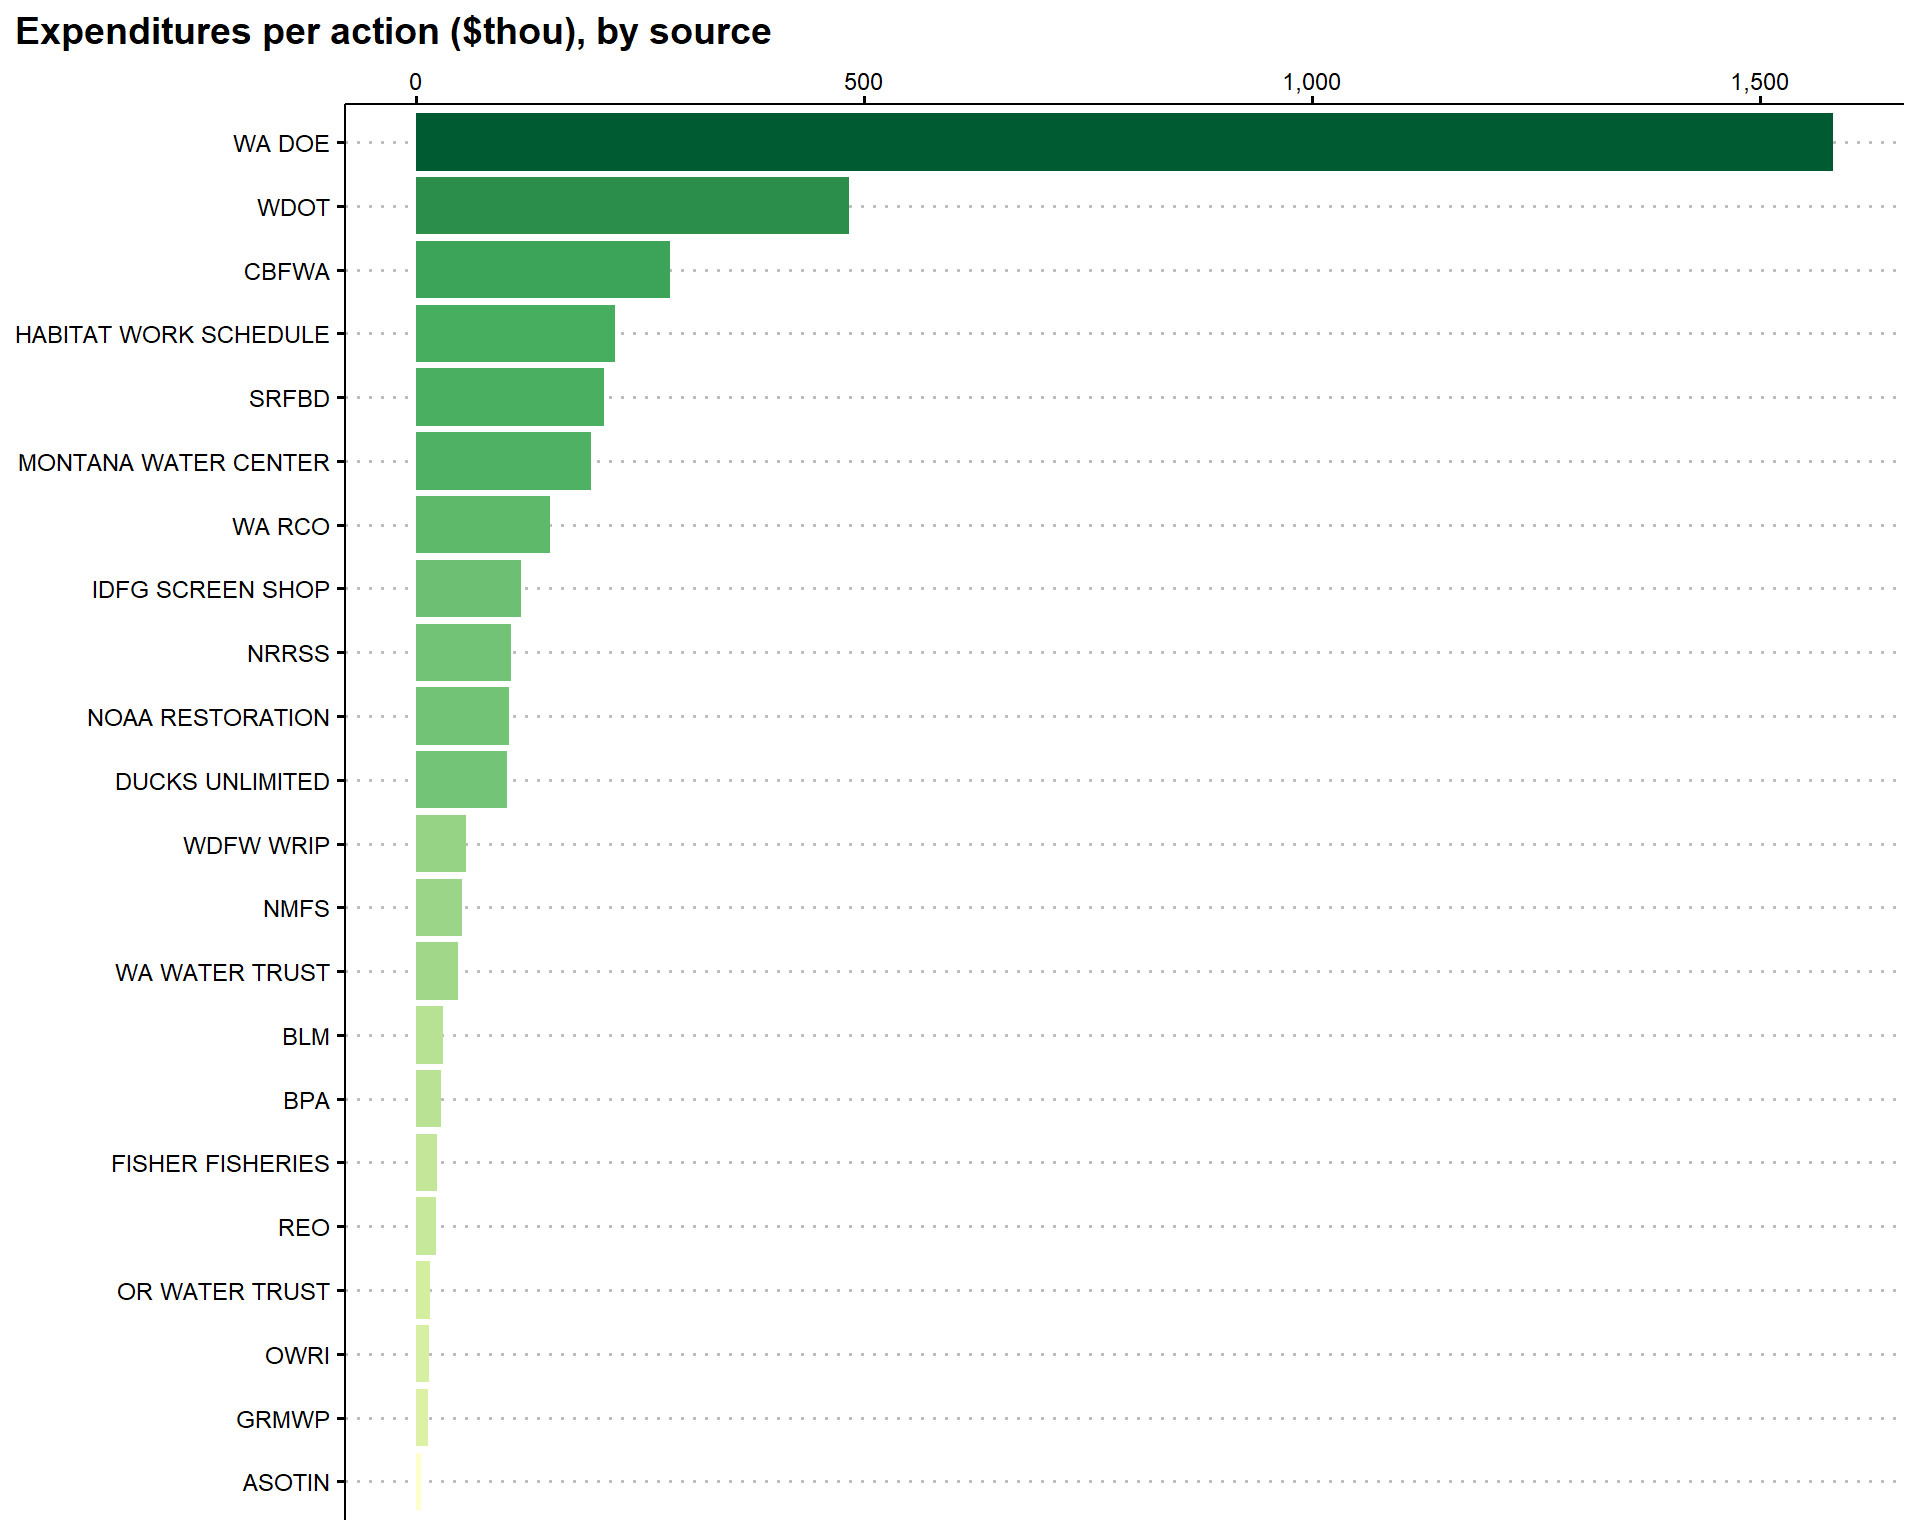
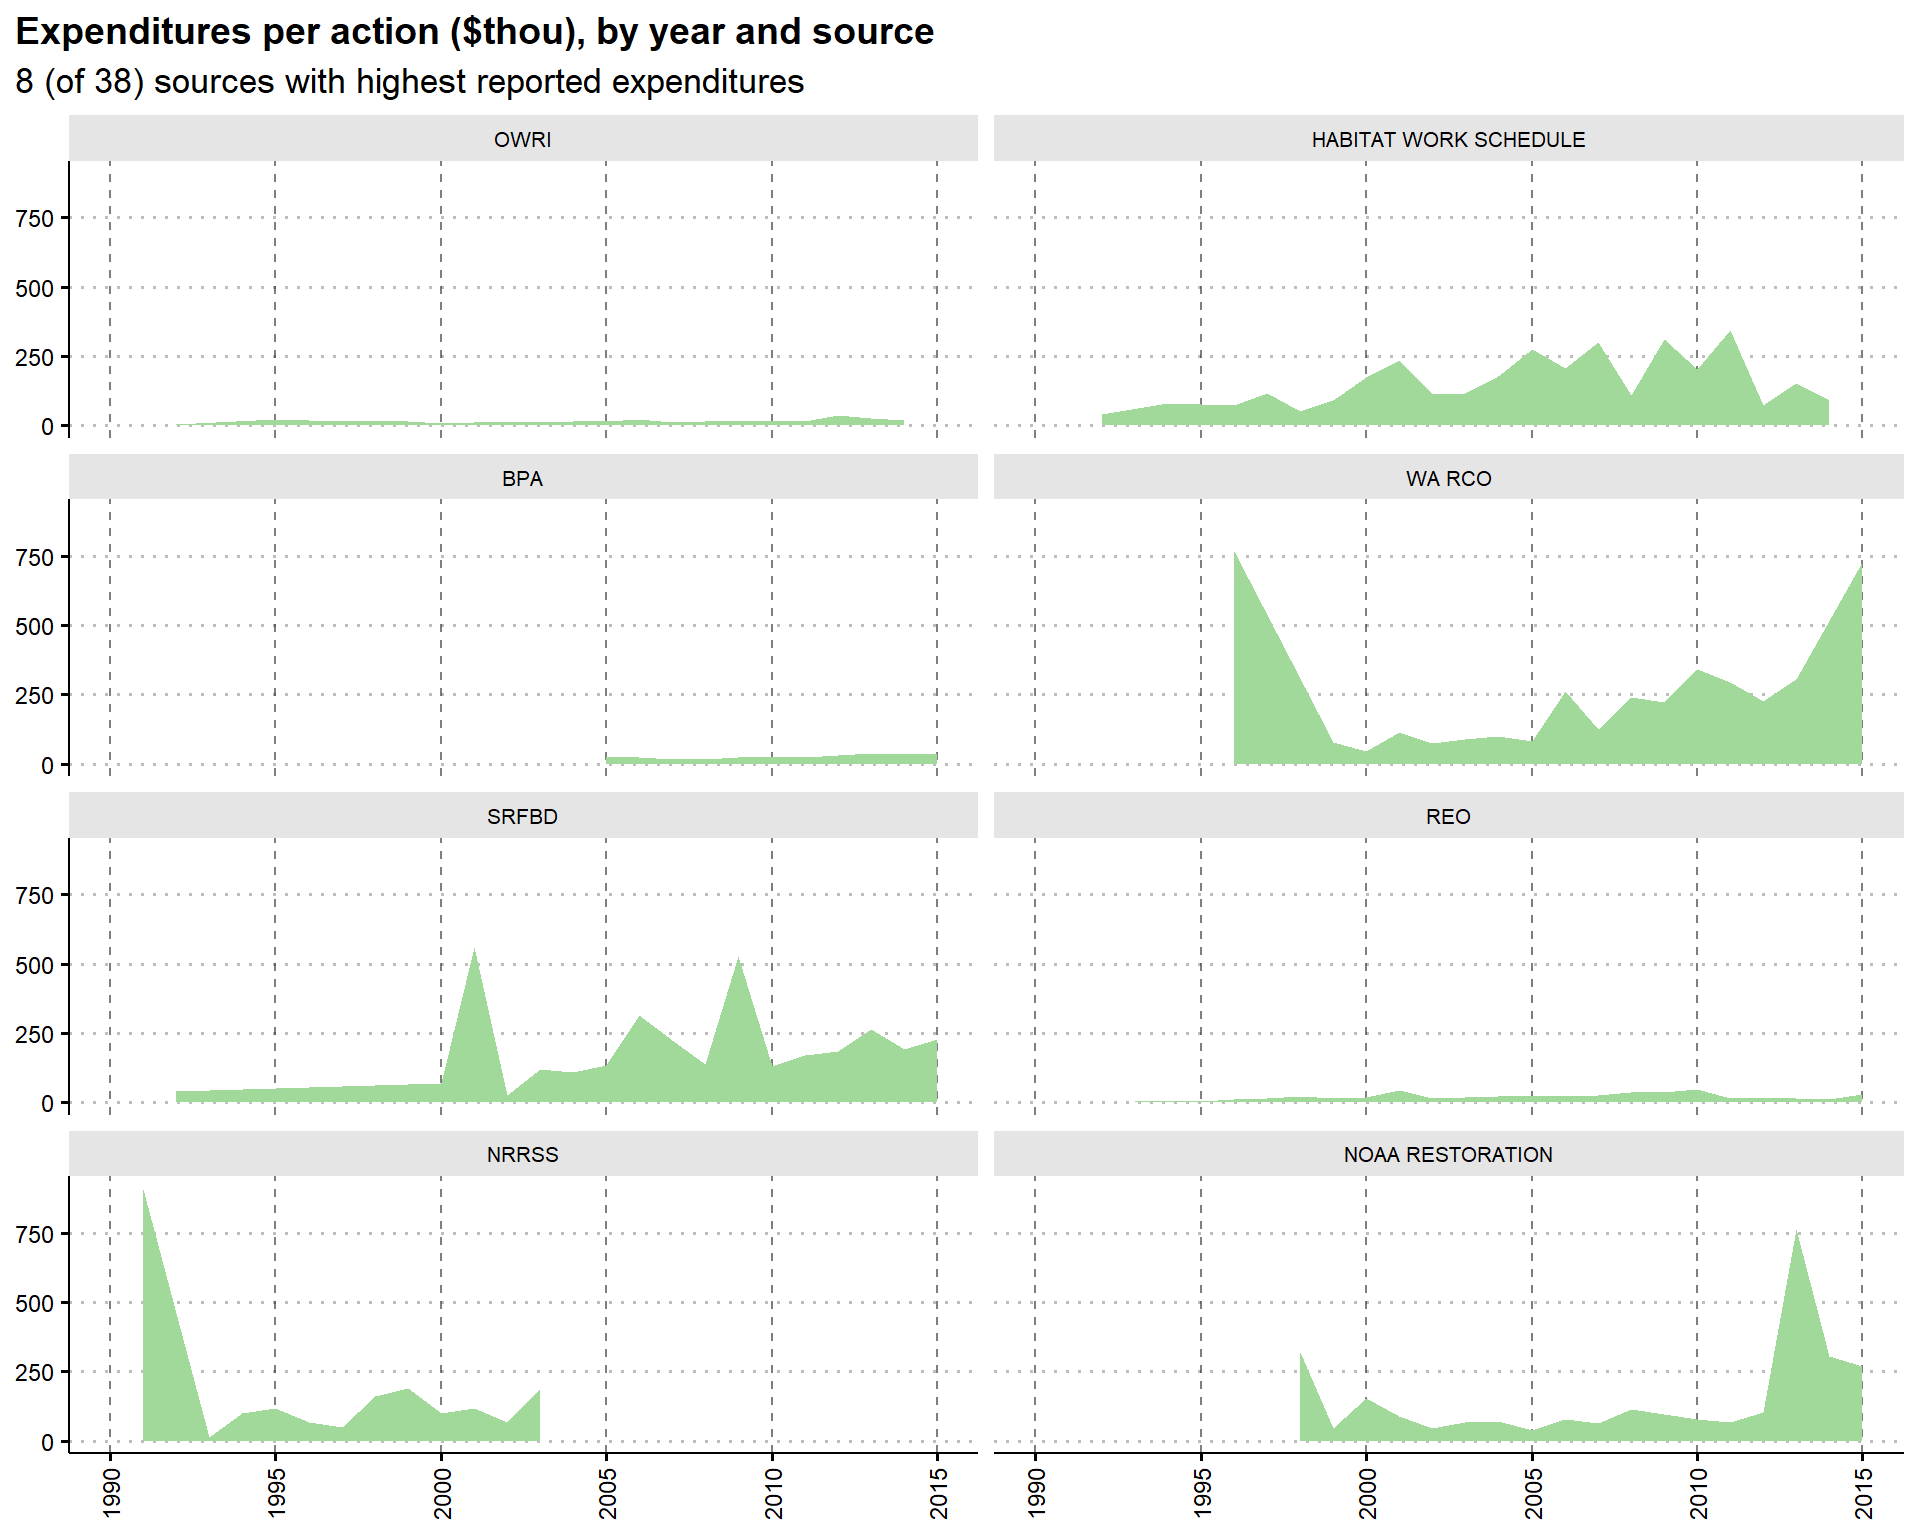
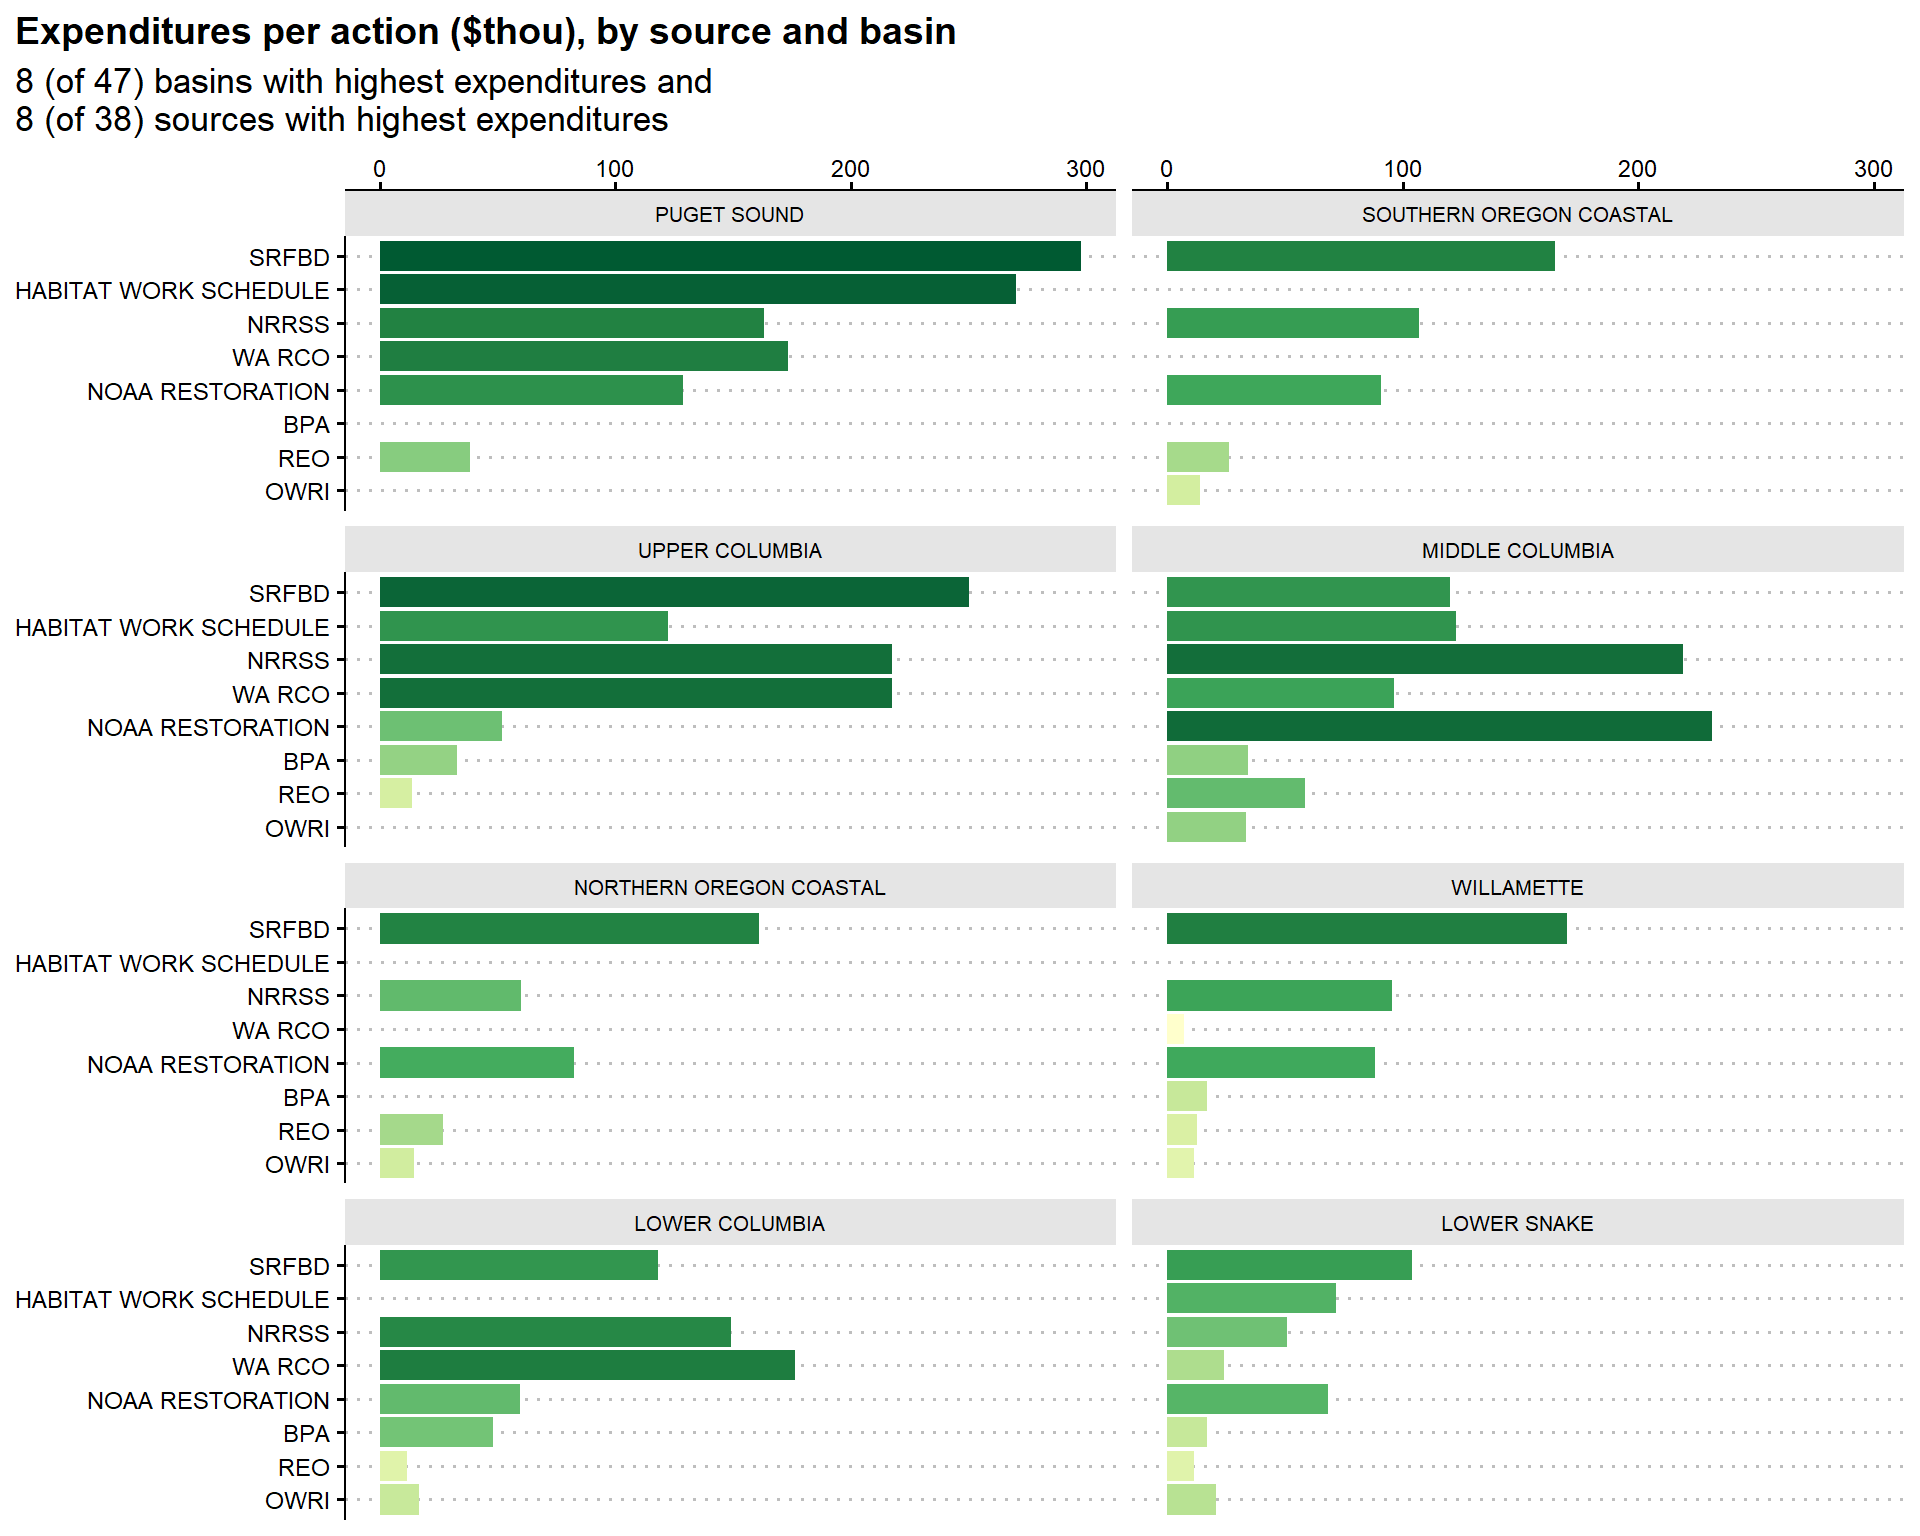
Observation: OWRI, which reports the bulk of the Oregon projects, consistently reports very low per project and per action costs. This may be because they do not report land acquisitions, which are the most expensive actions. OWRI also reports a disproportionate number of road drainage projects, which might drive down their costs. They also may just be computing their costs differently than other groups. But this is a red flag for directly comparing OWRI-reported projects to others.
Per Action
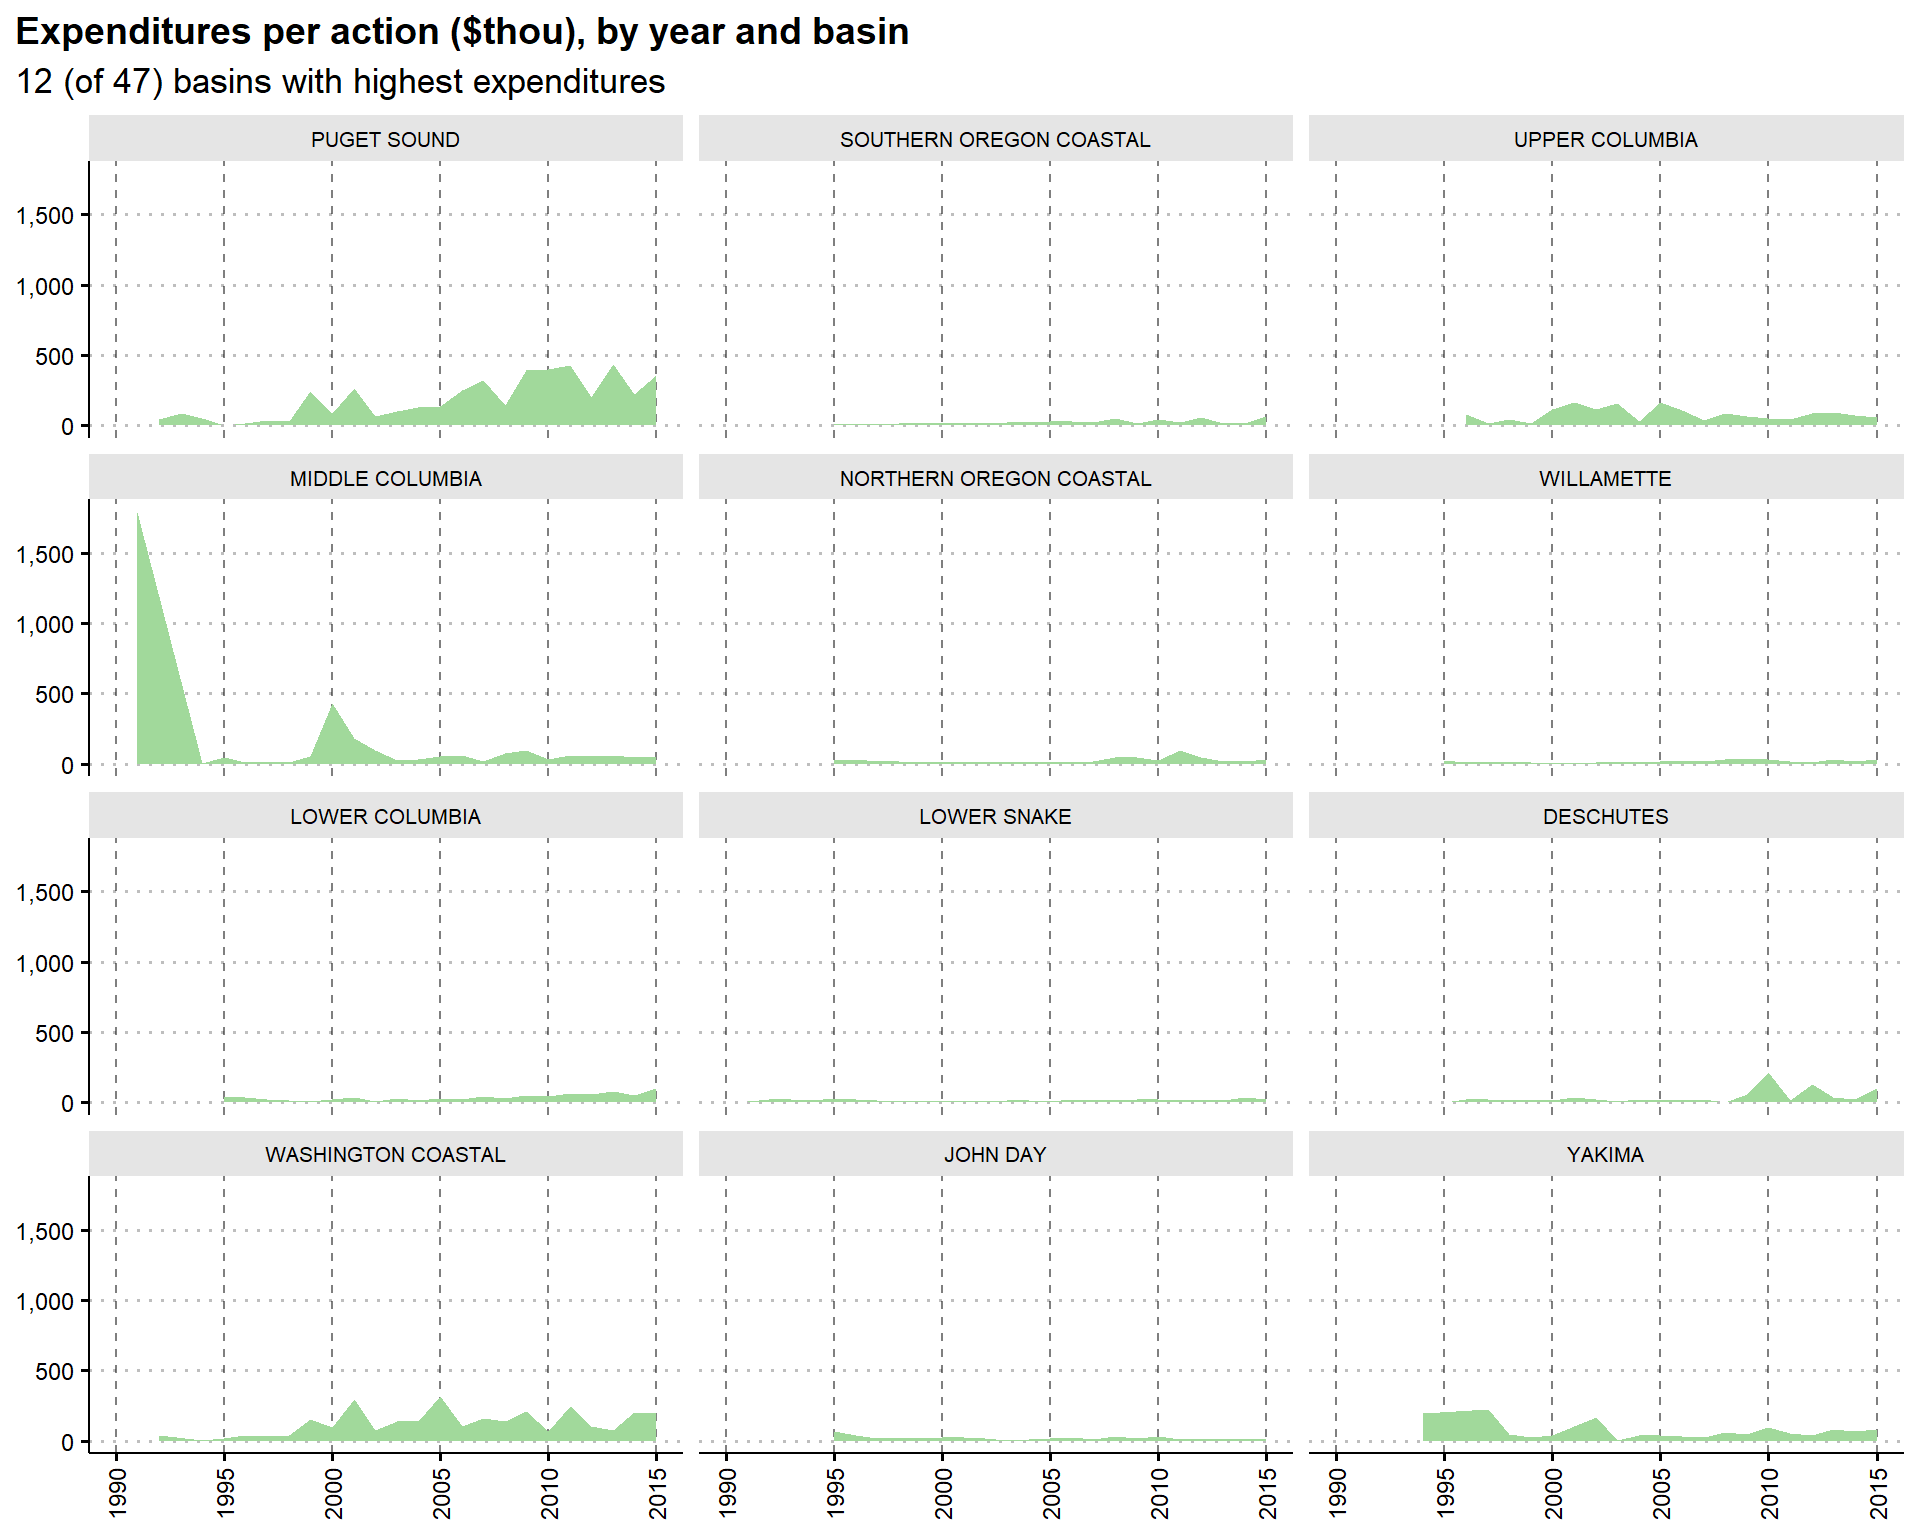
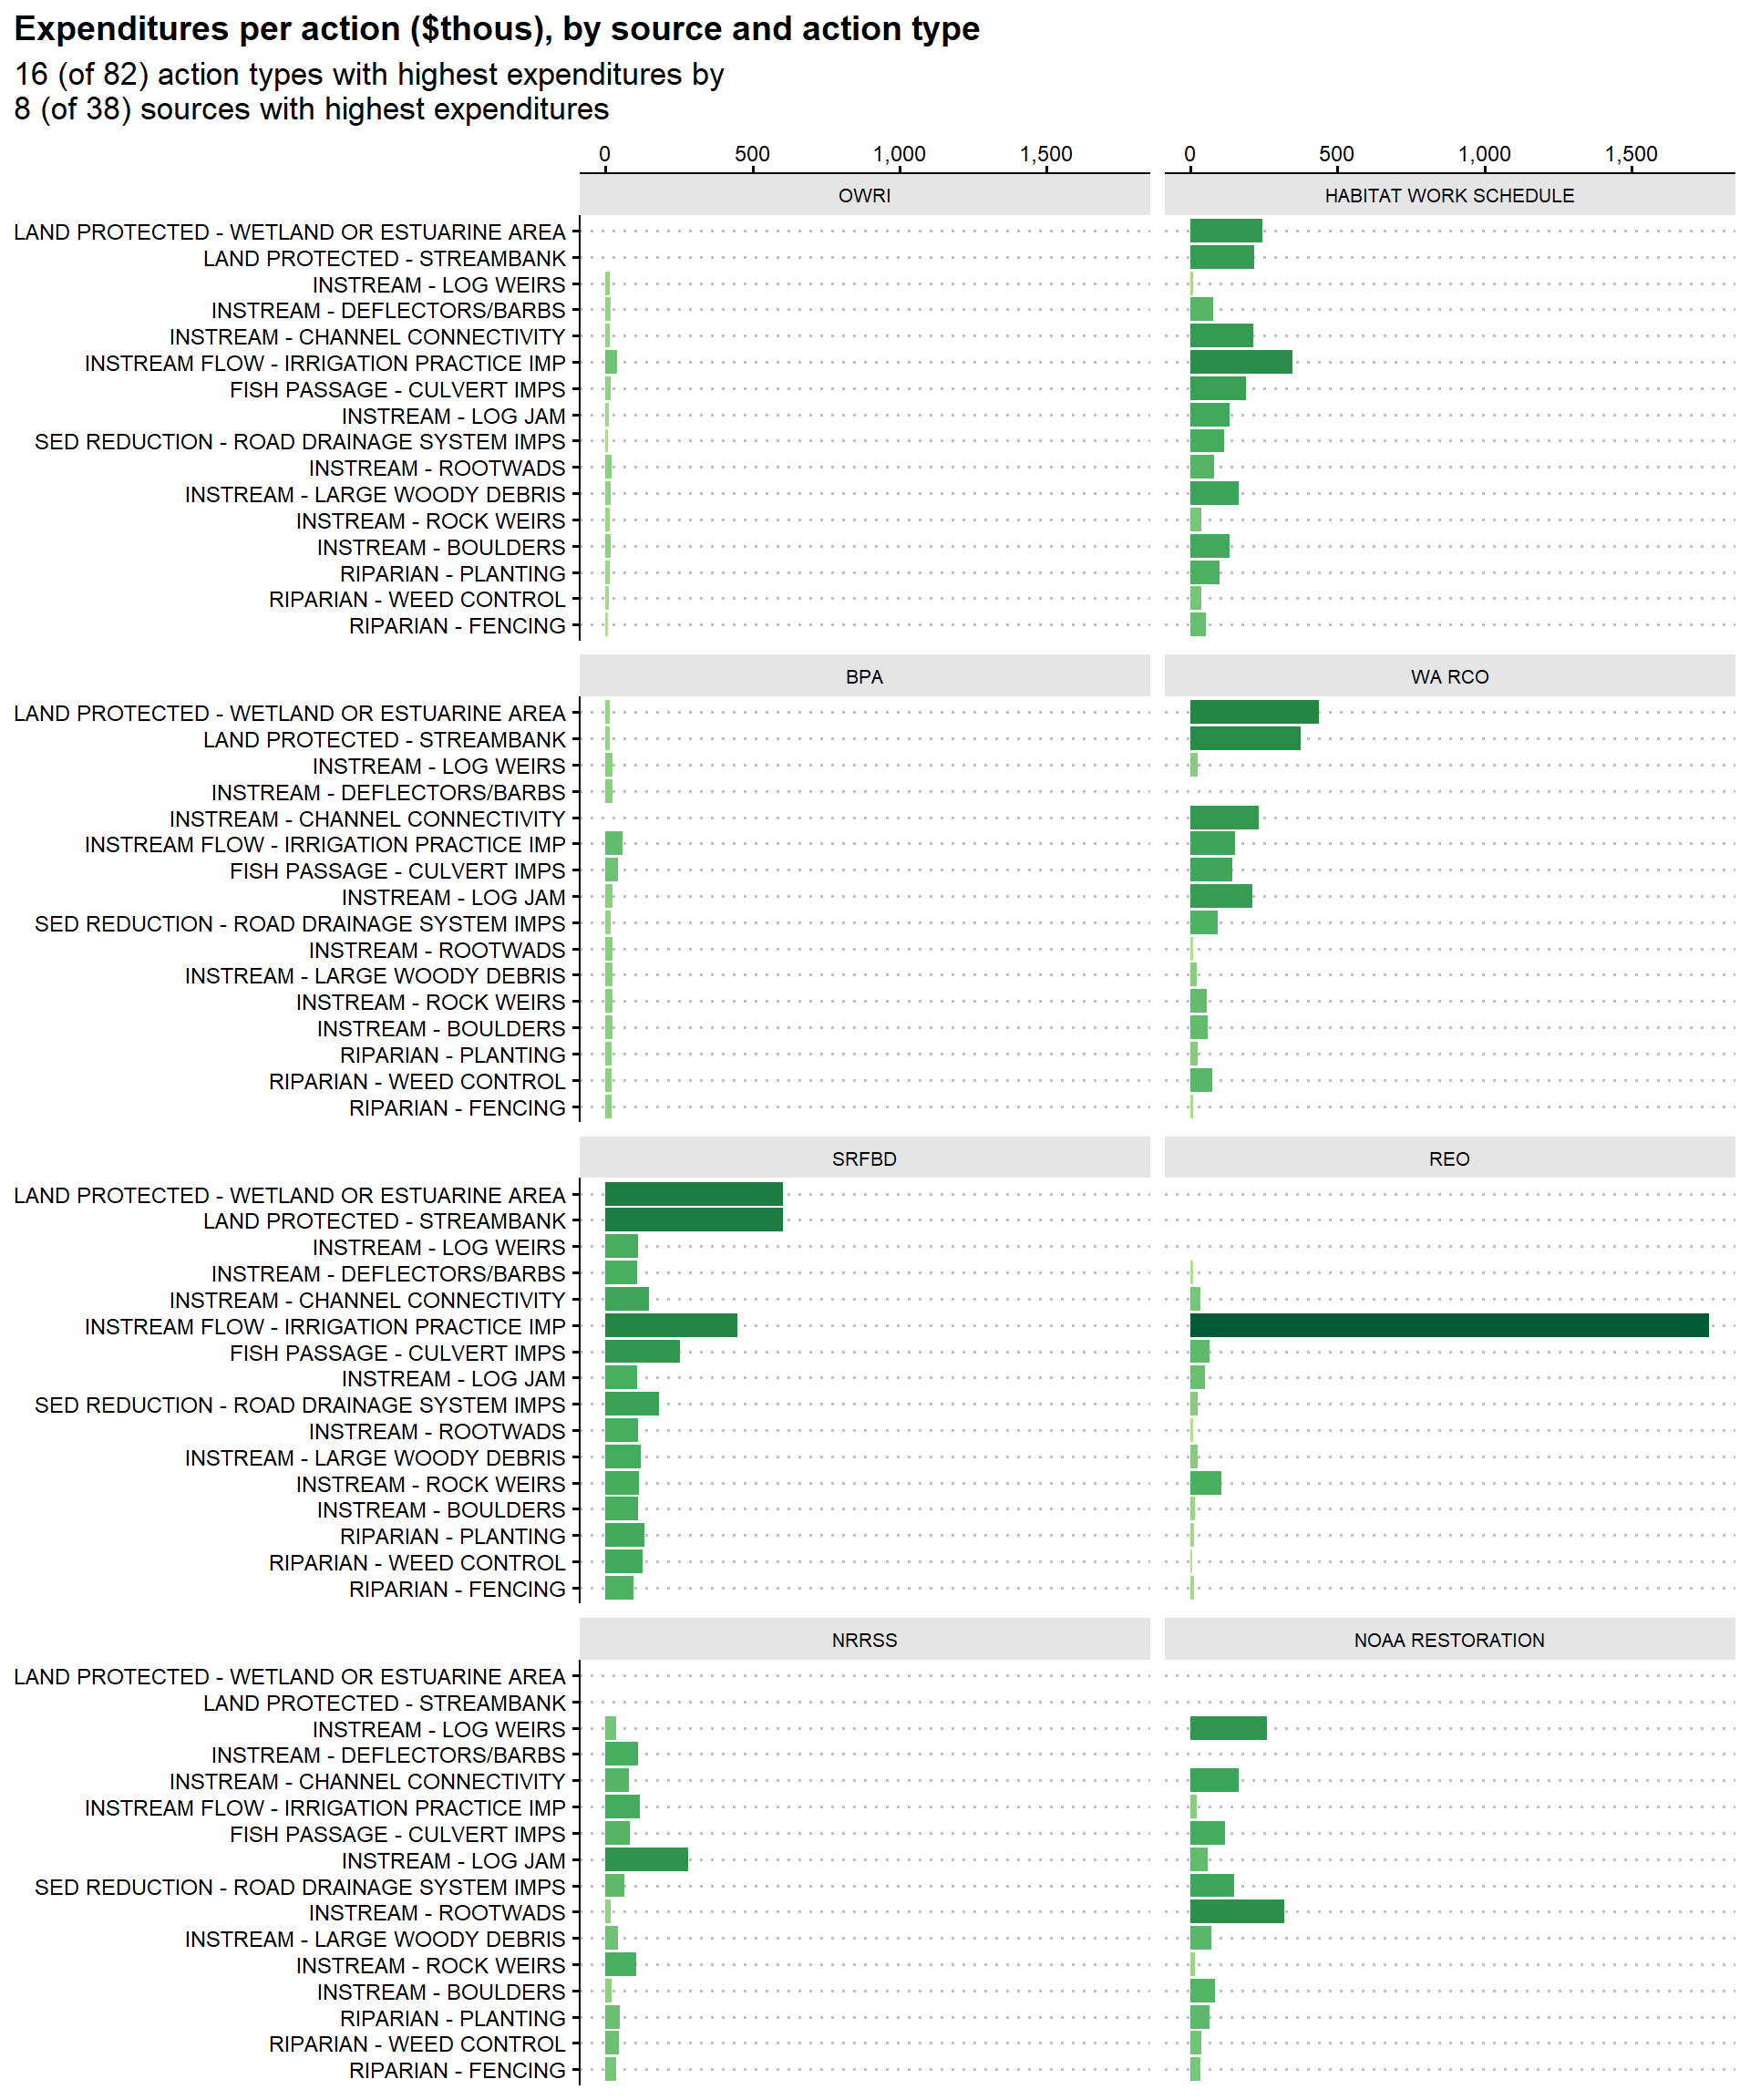
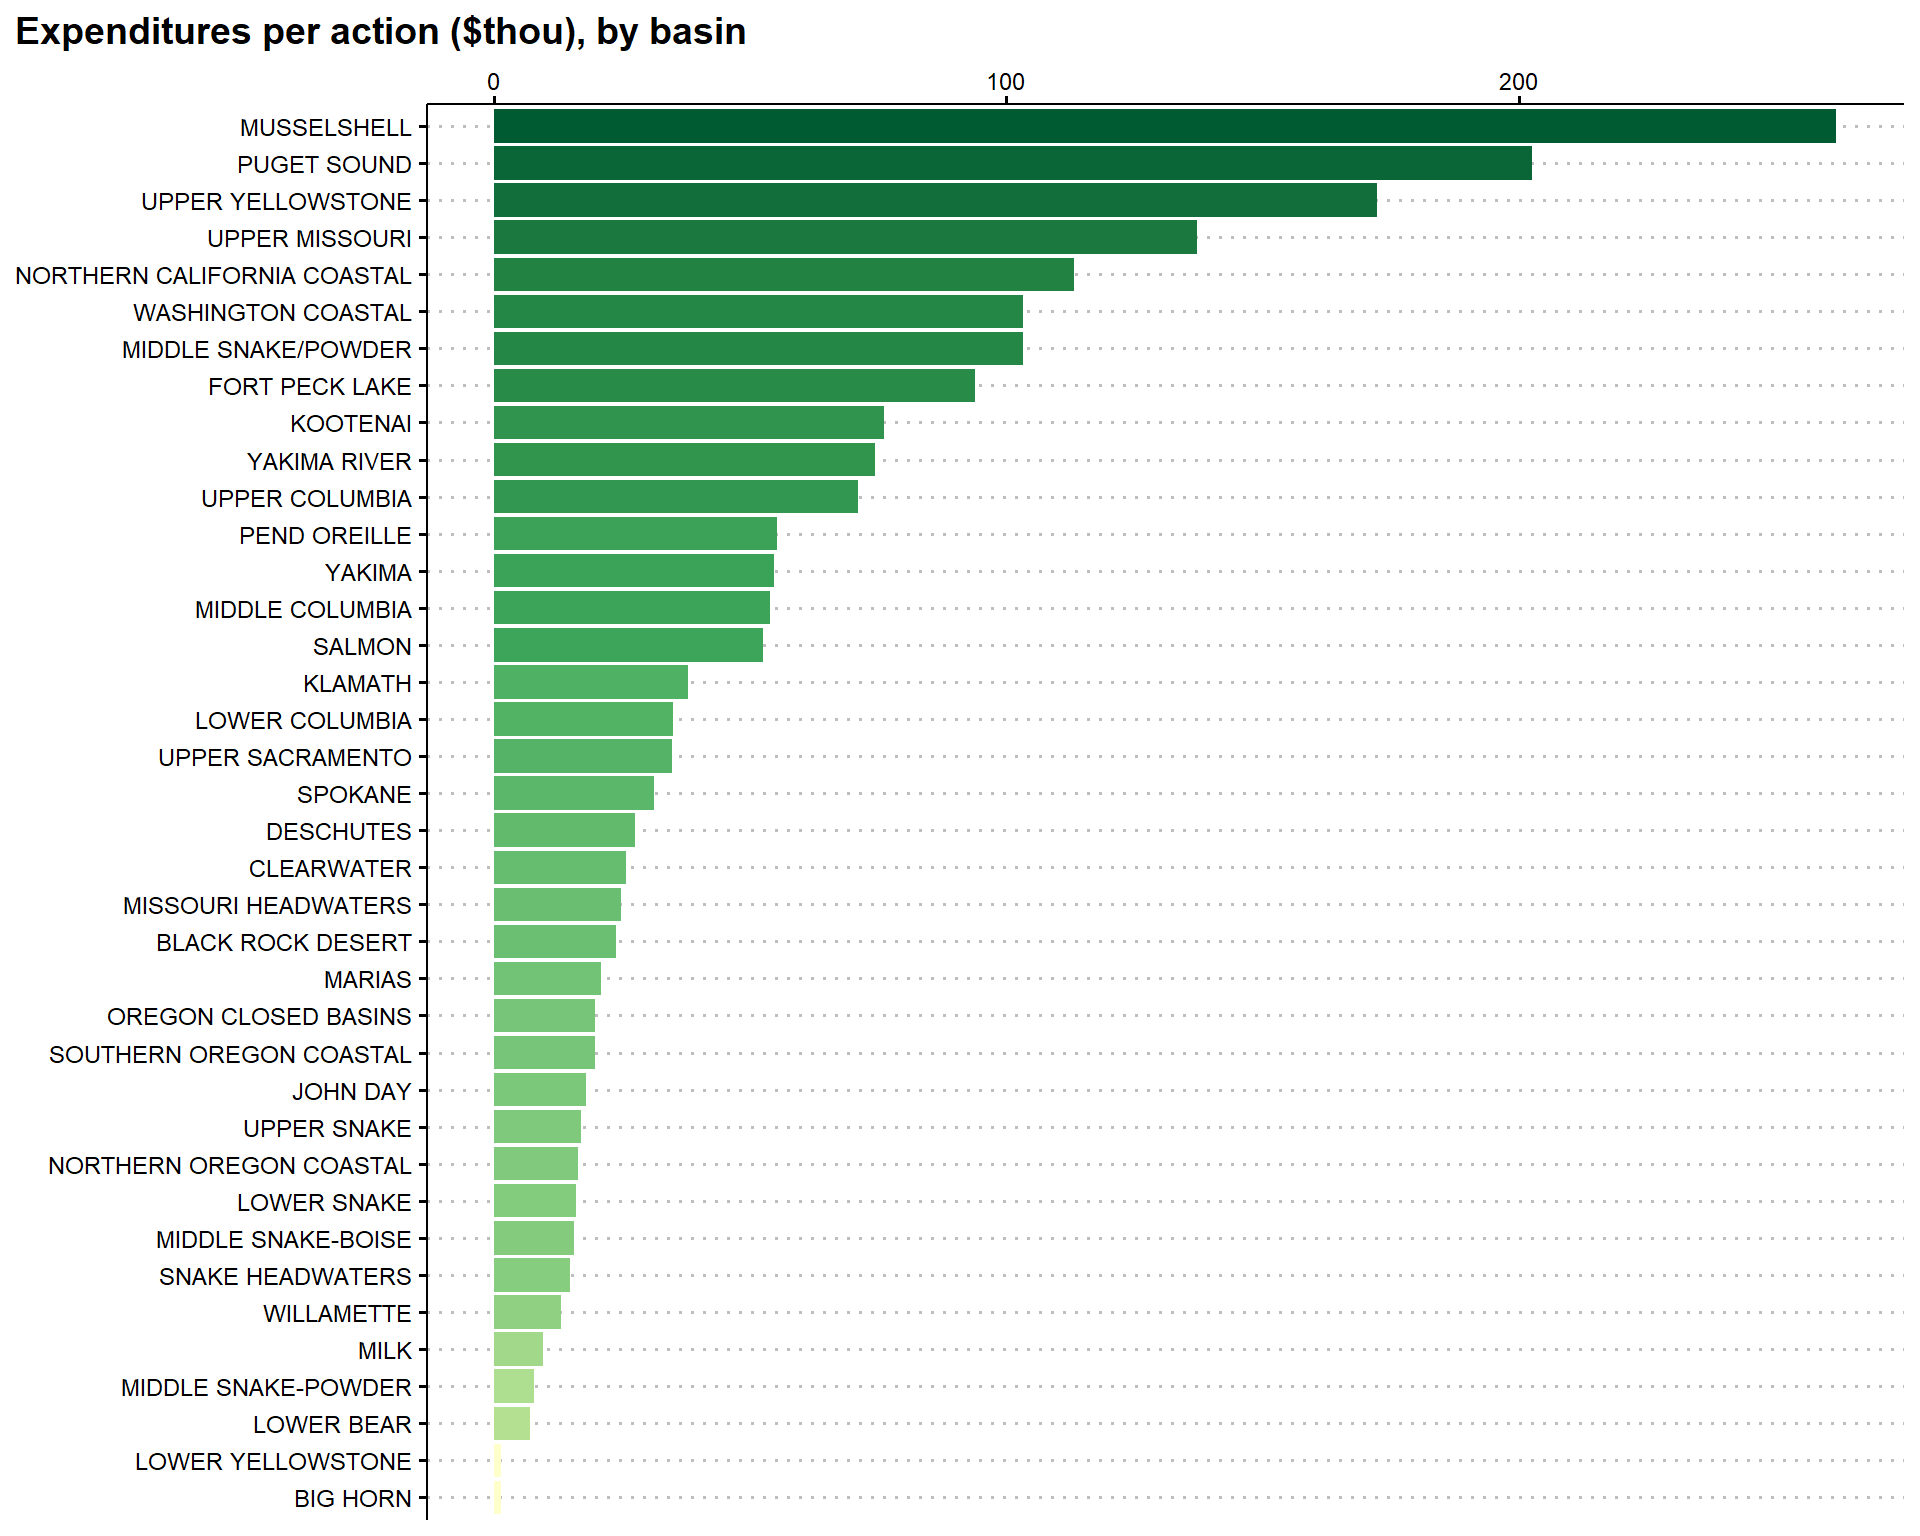
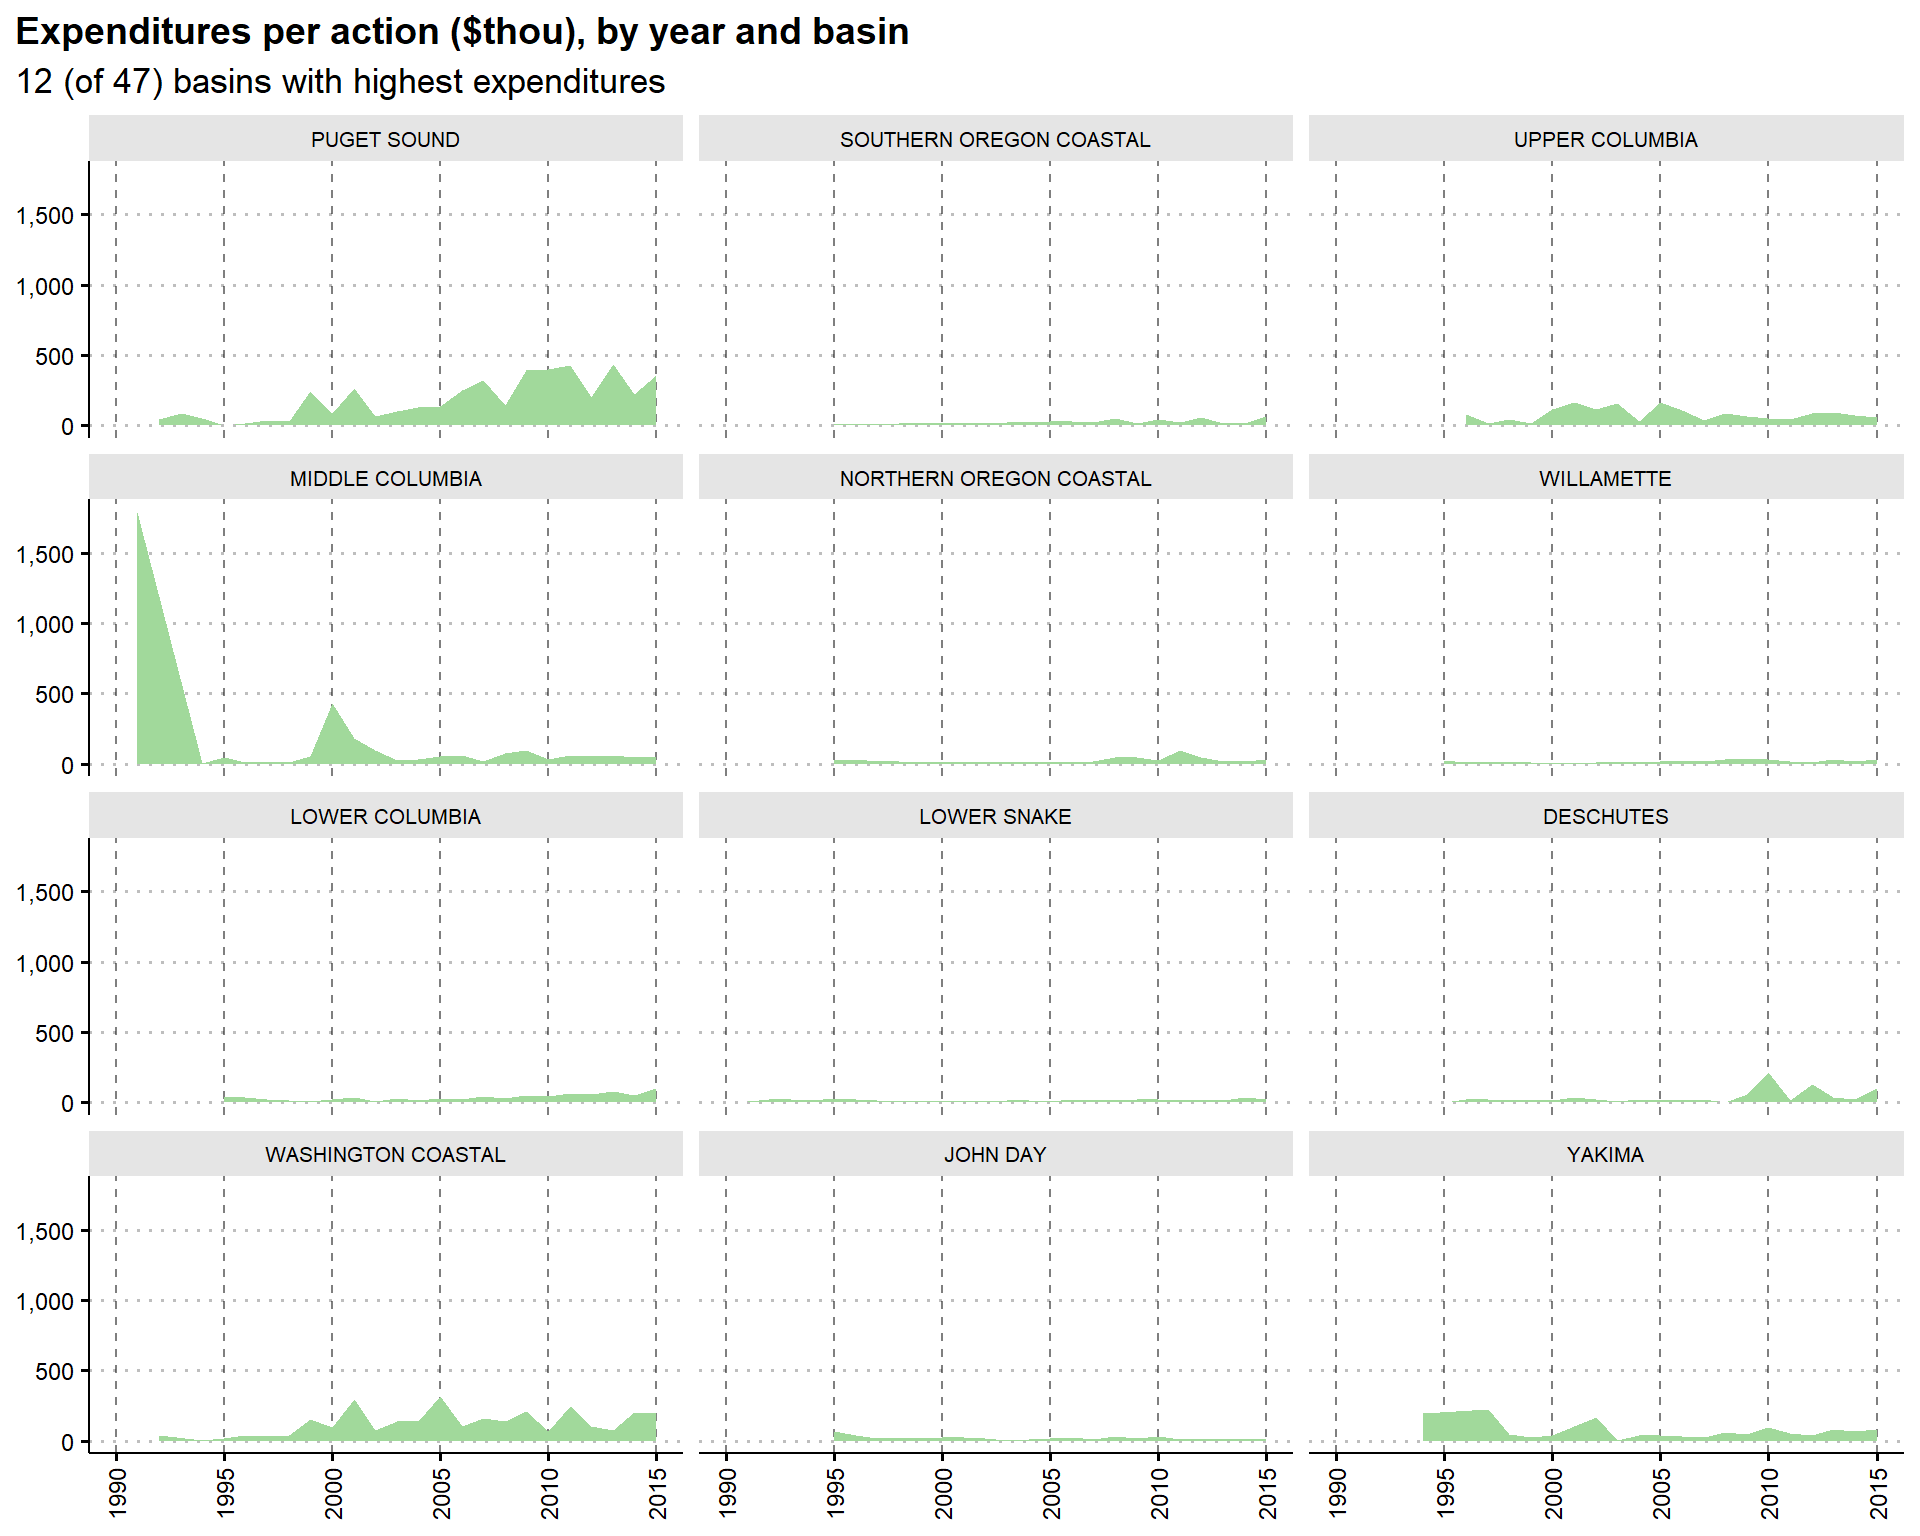
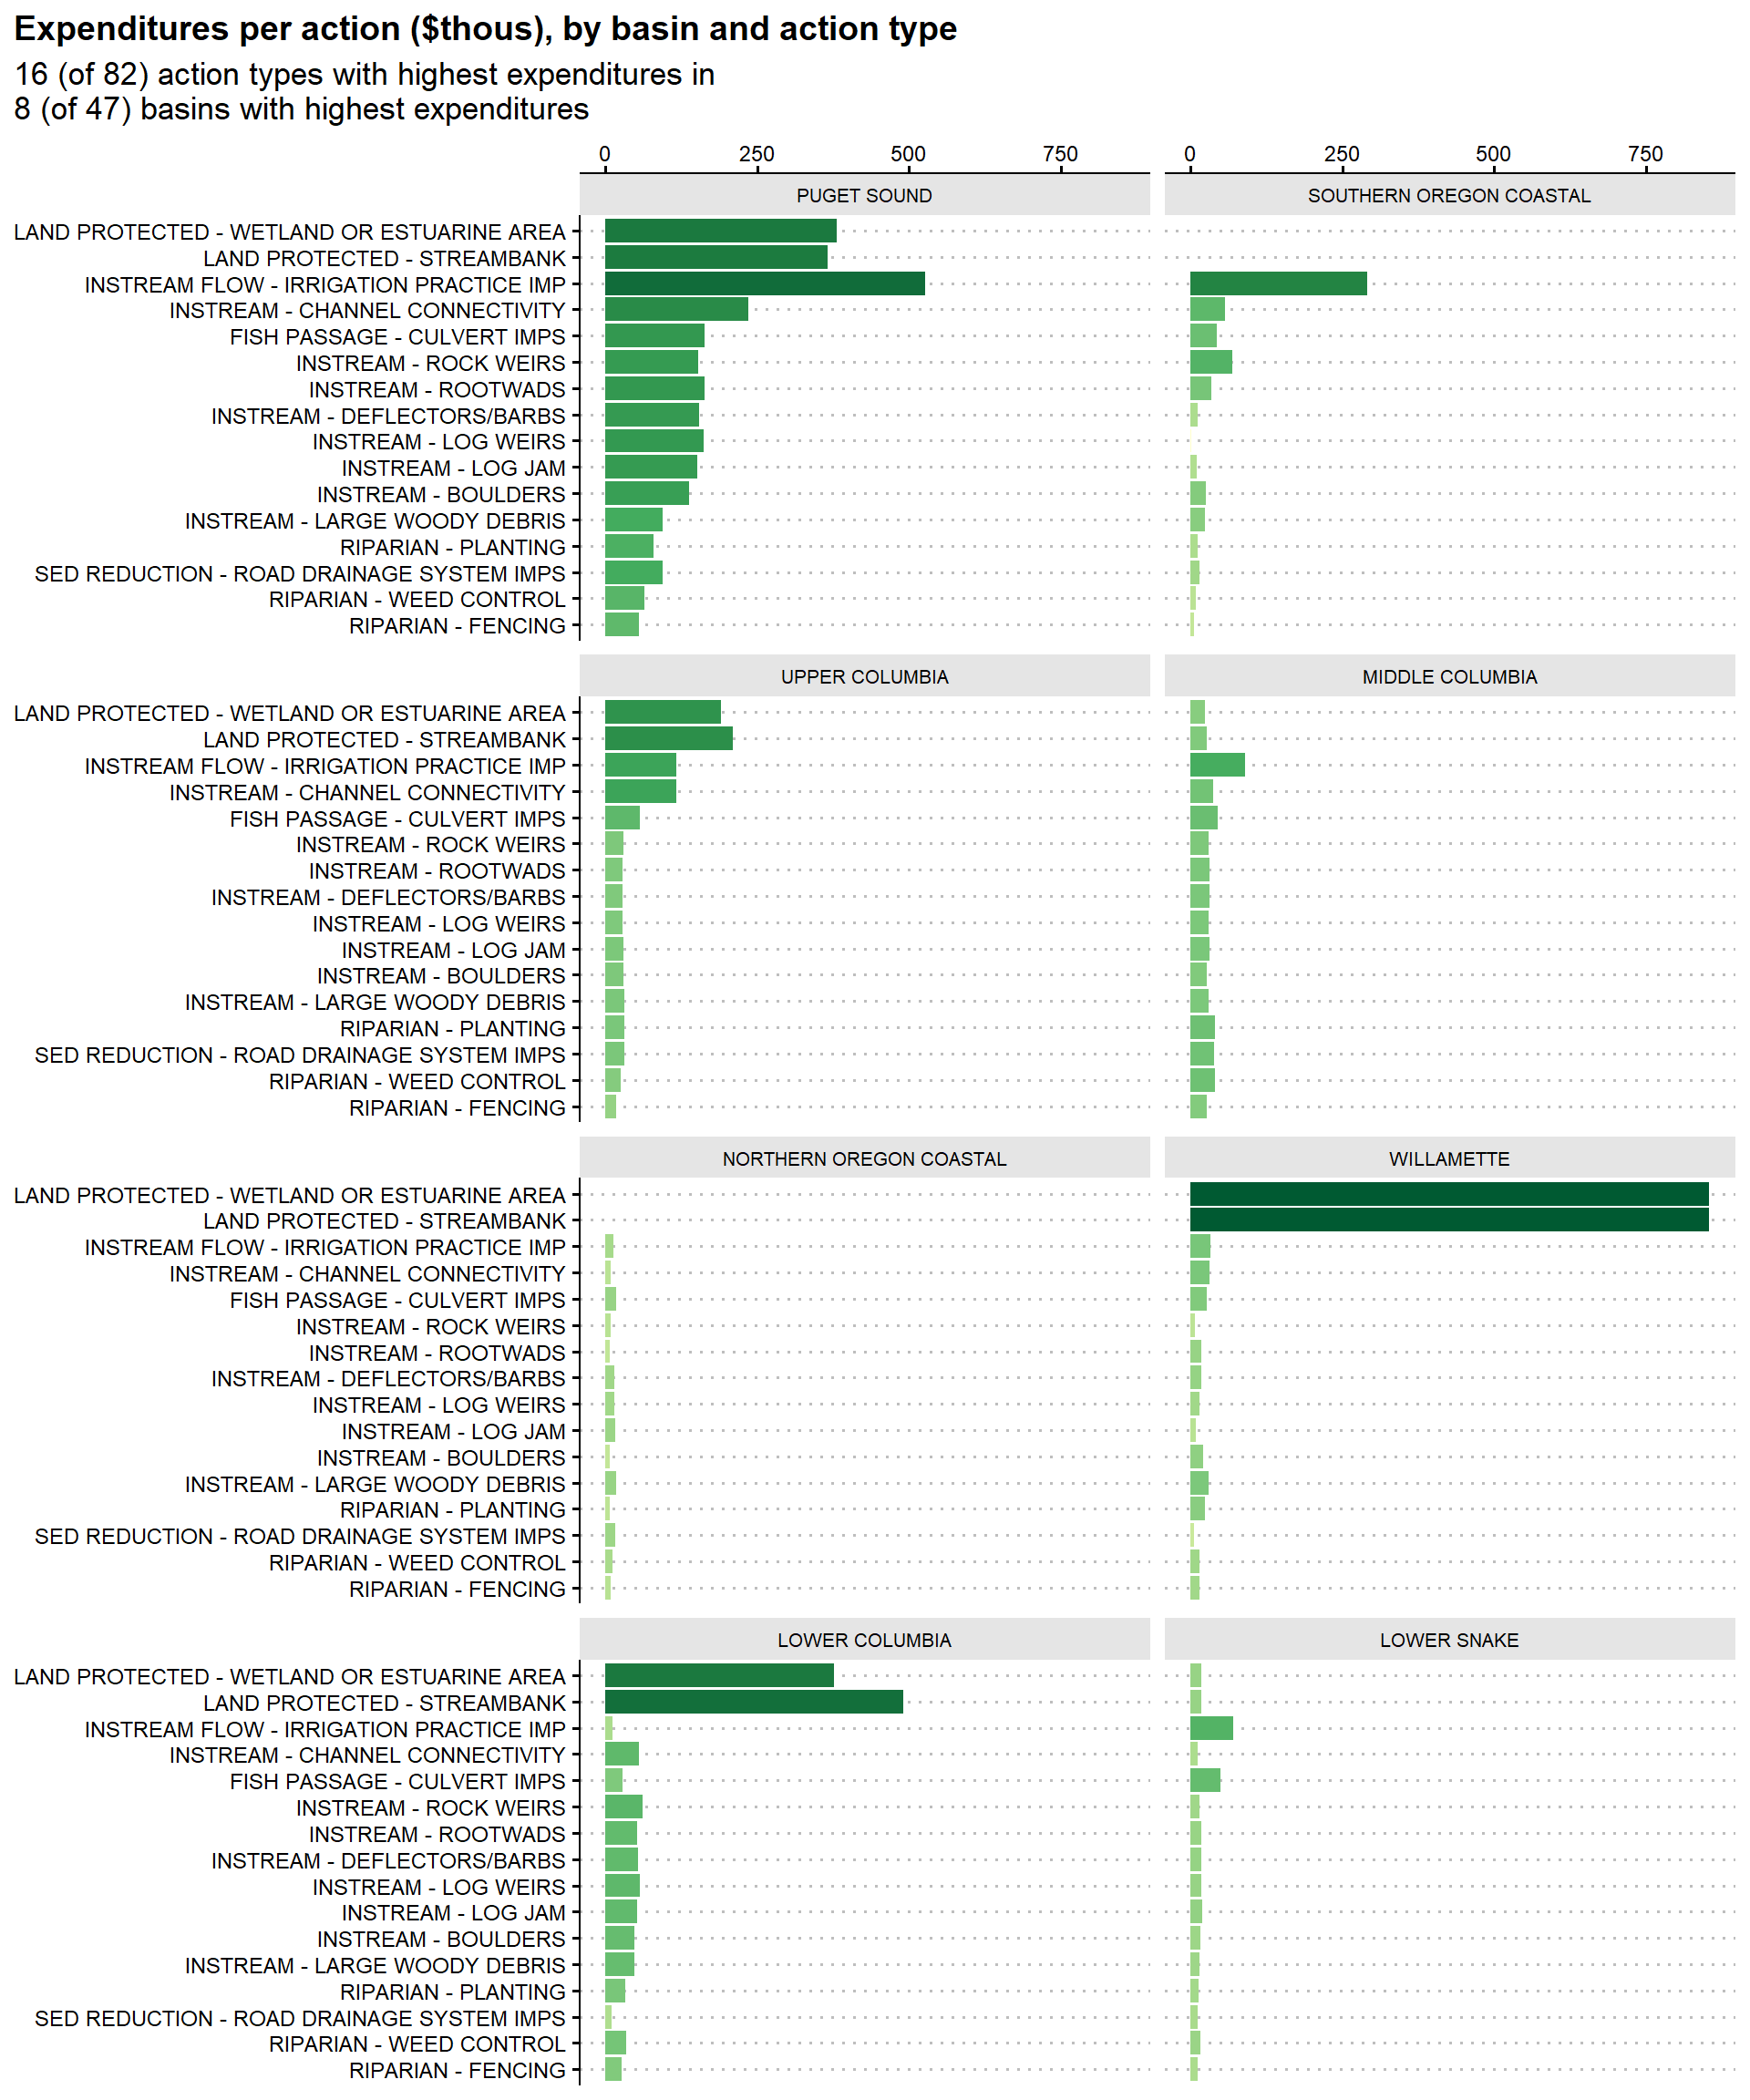
Note: These figures represent expenditures per action for projects with reported costs.
By Year
By Action Type
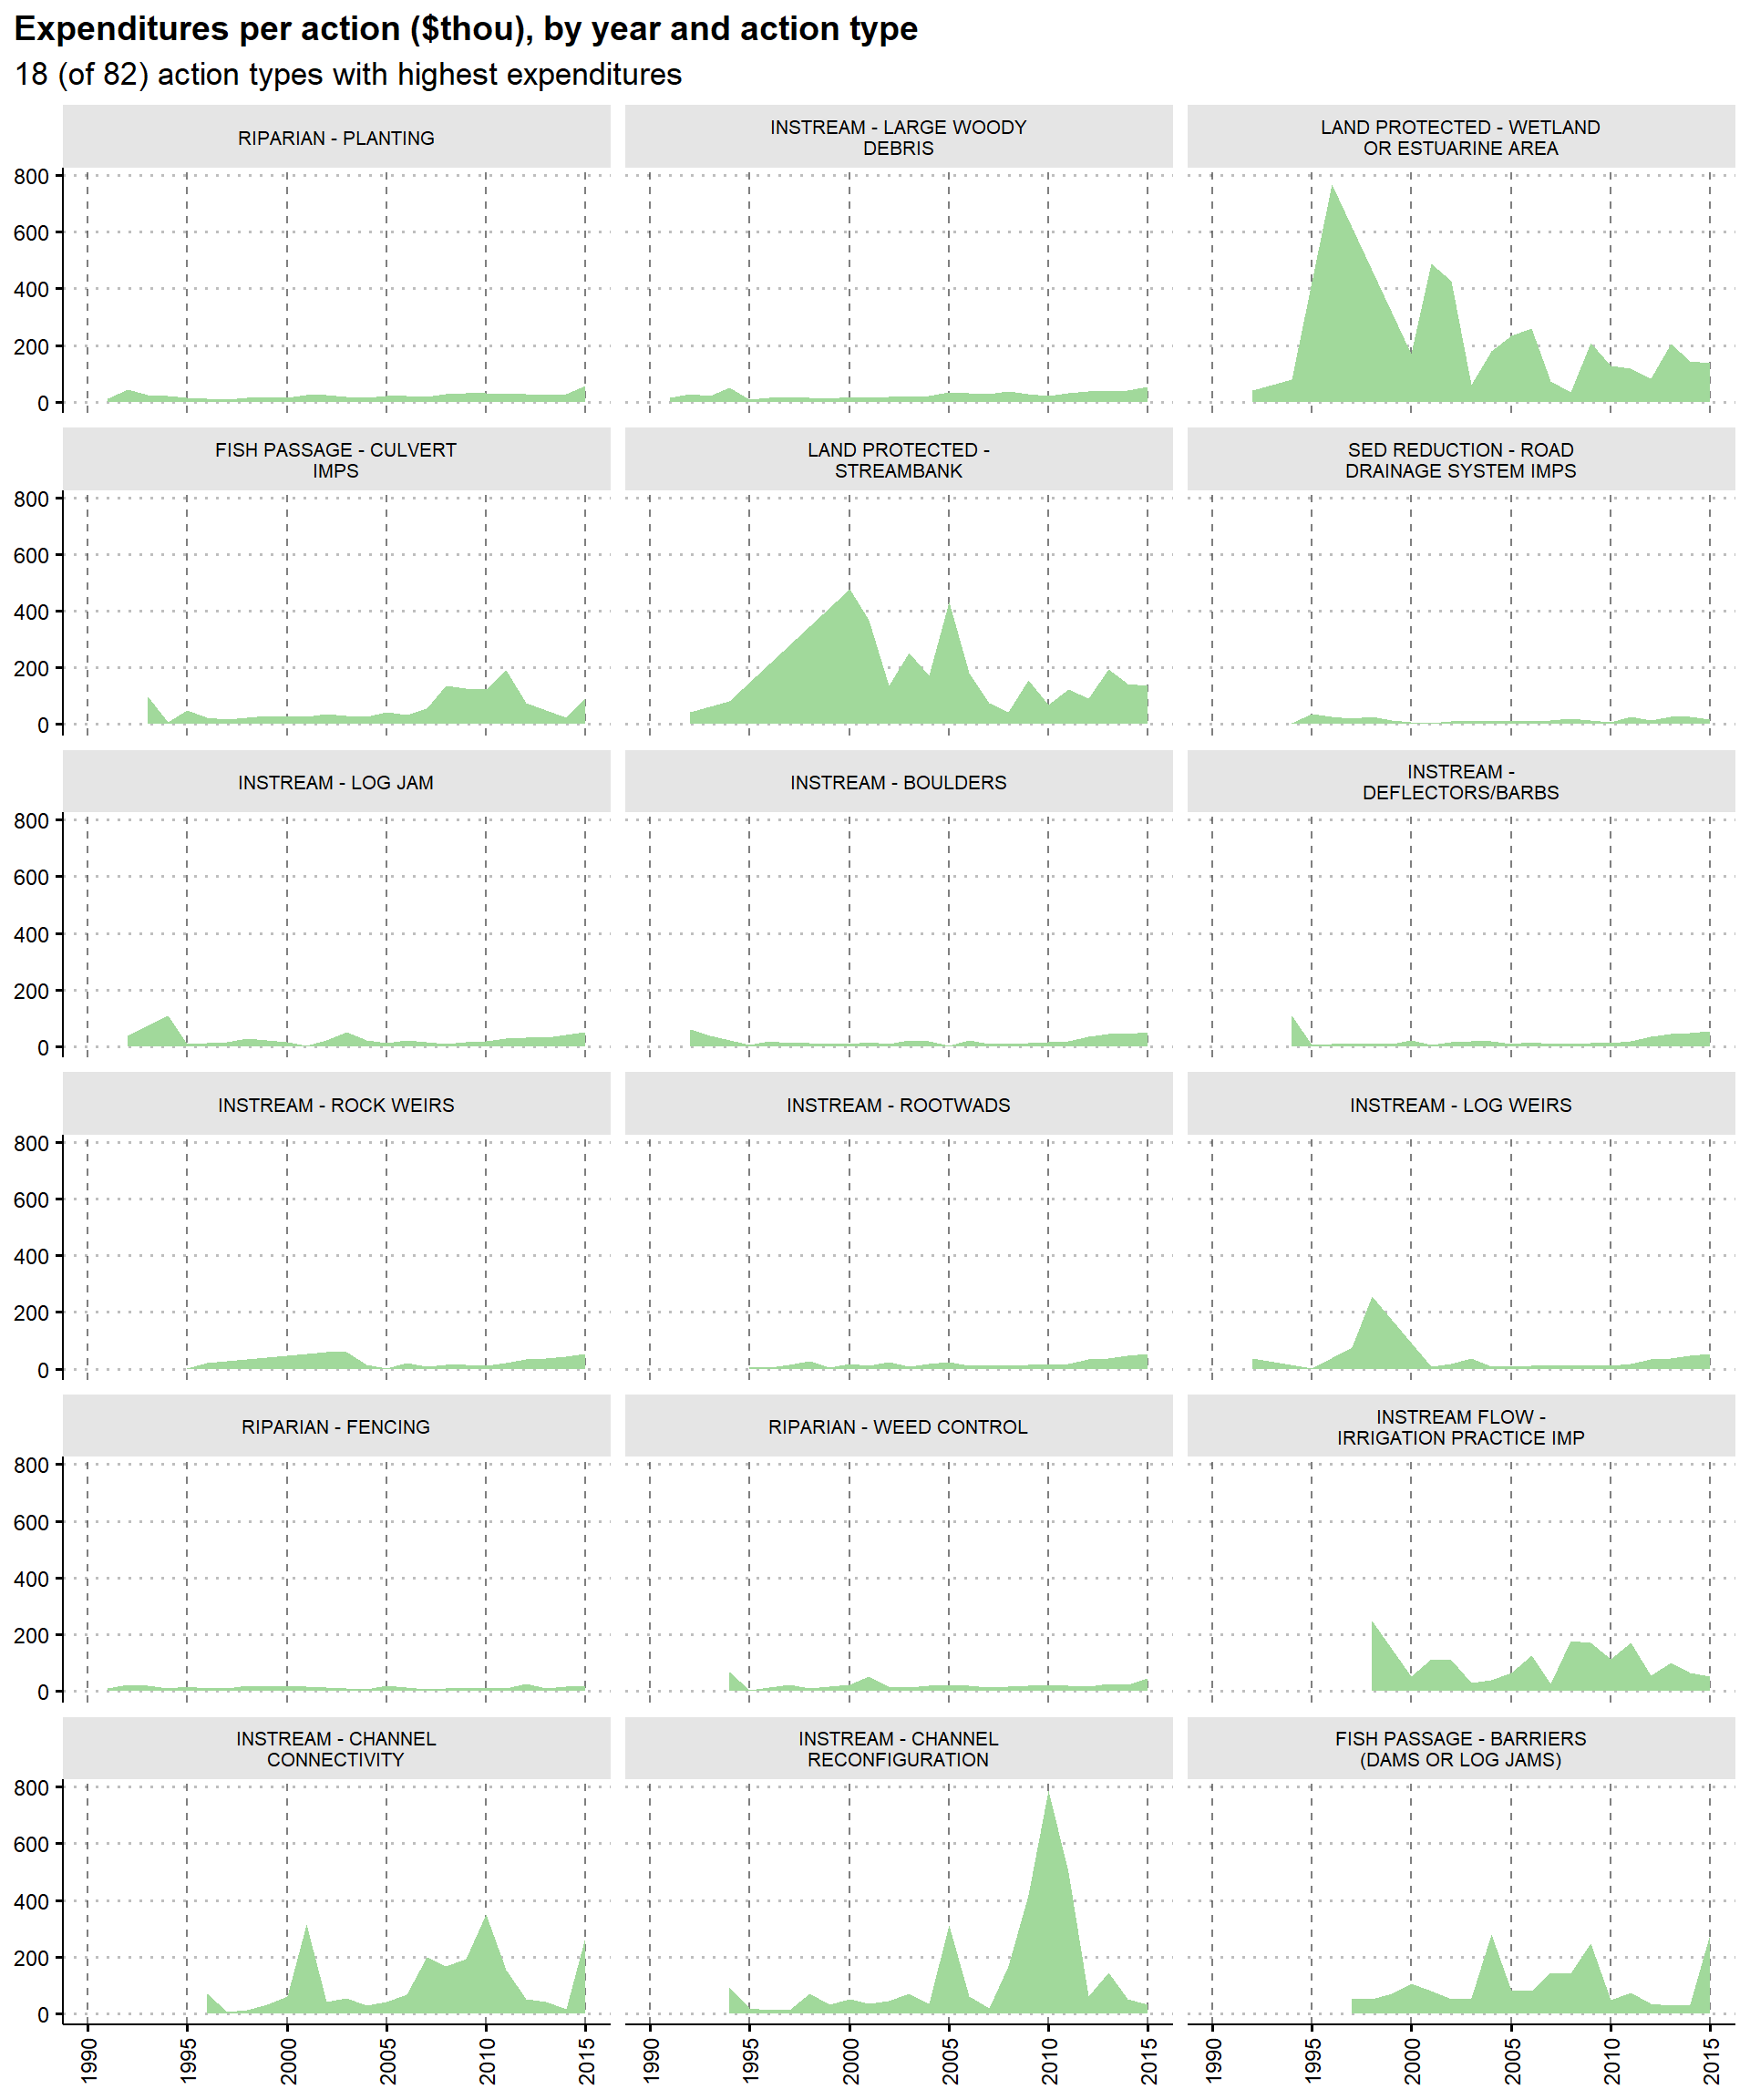
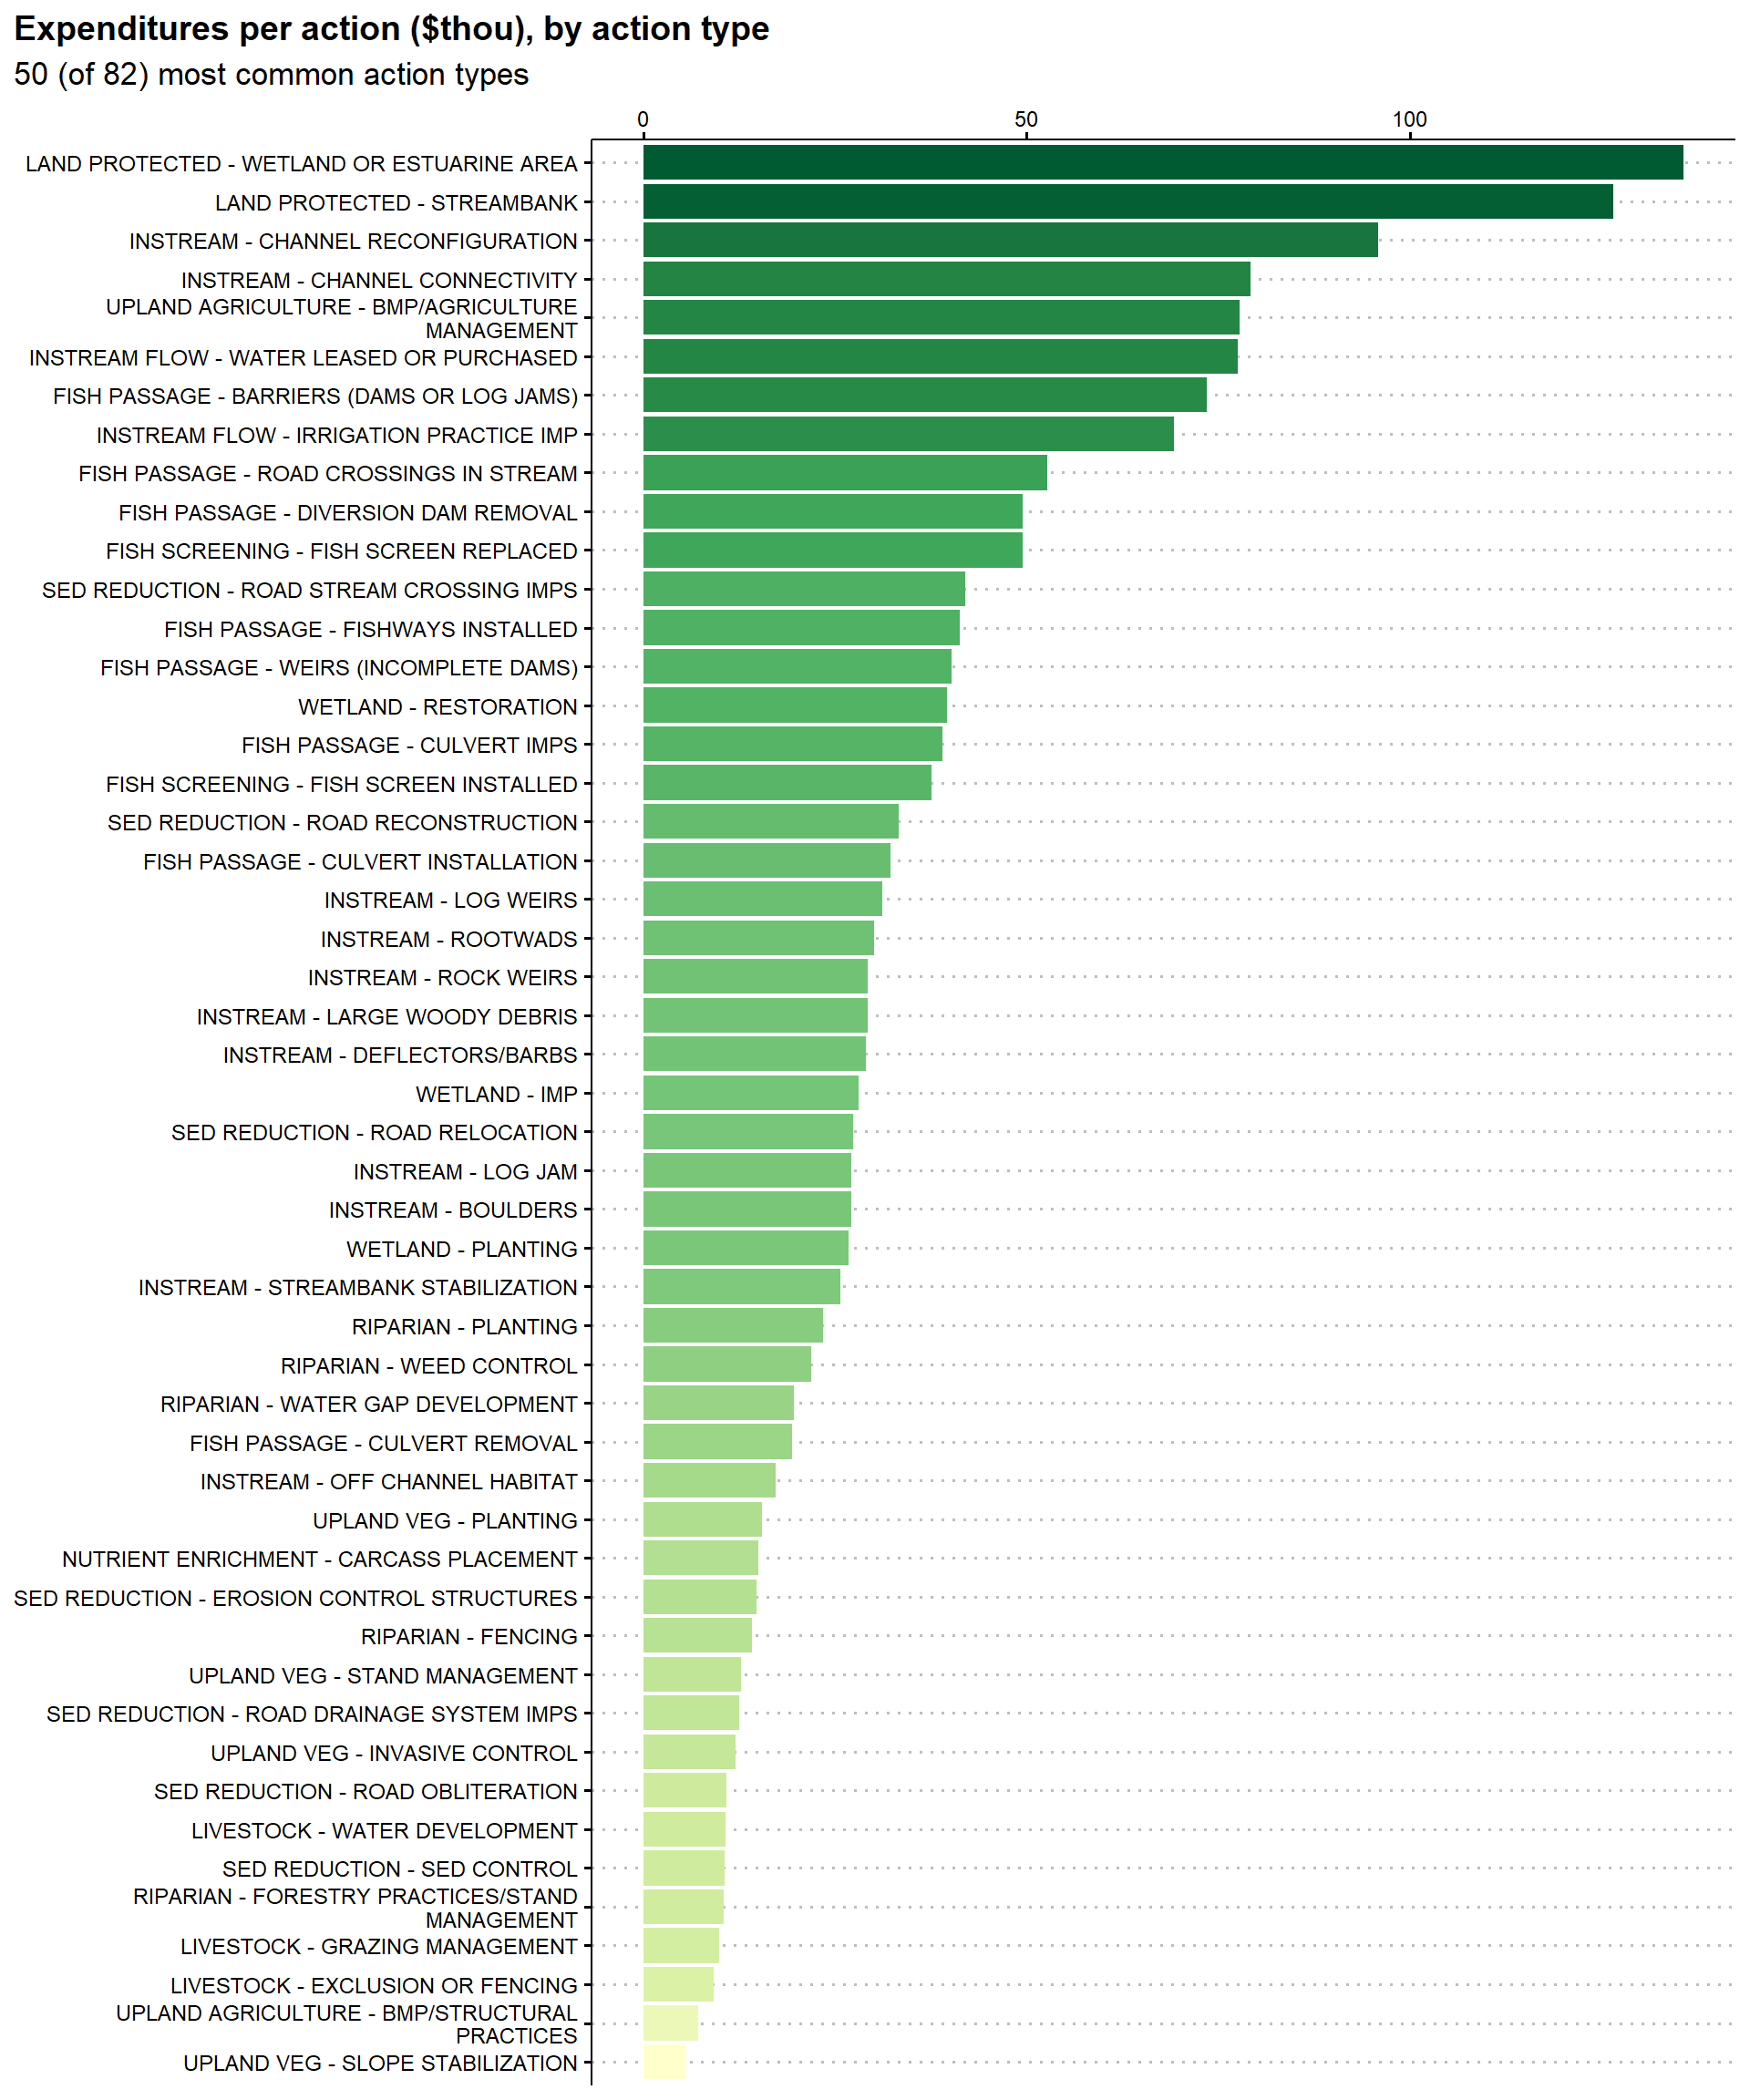
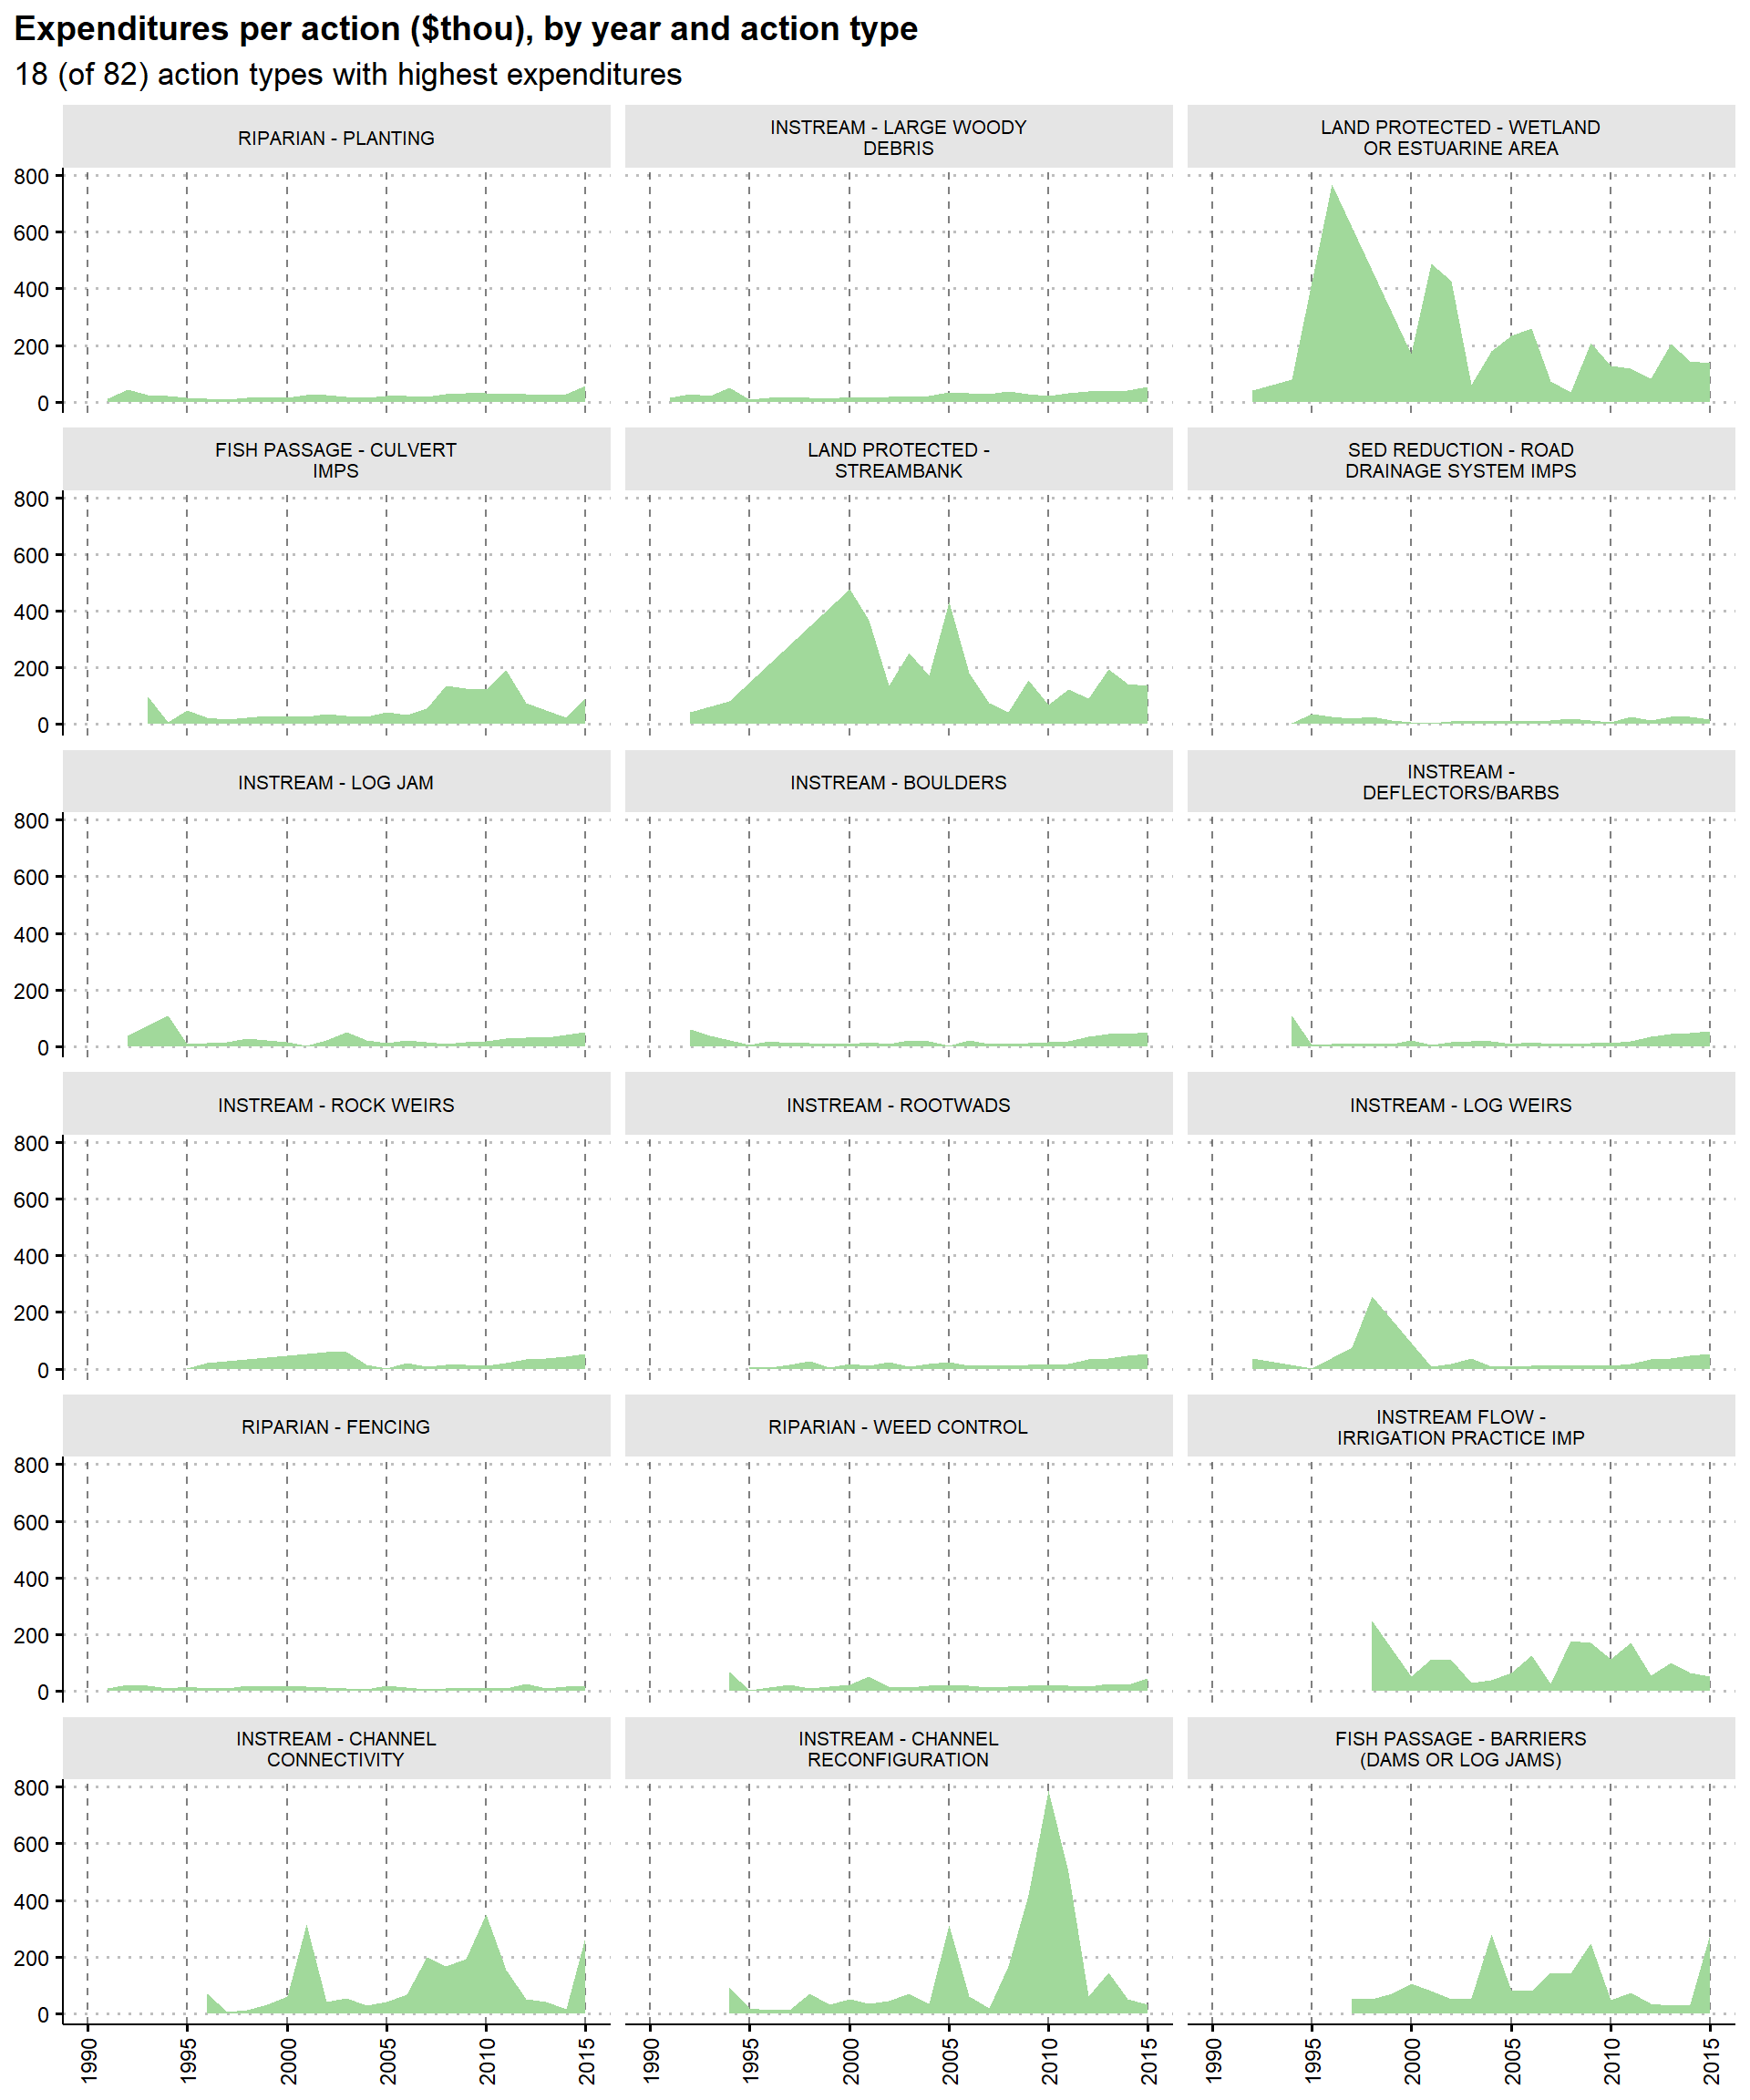
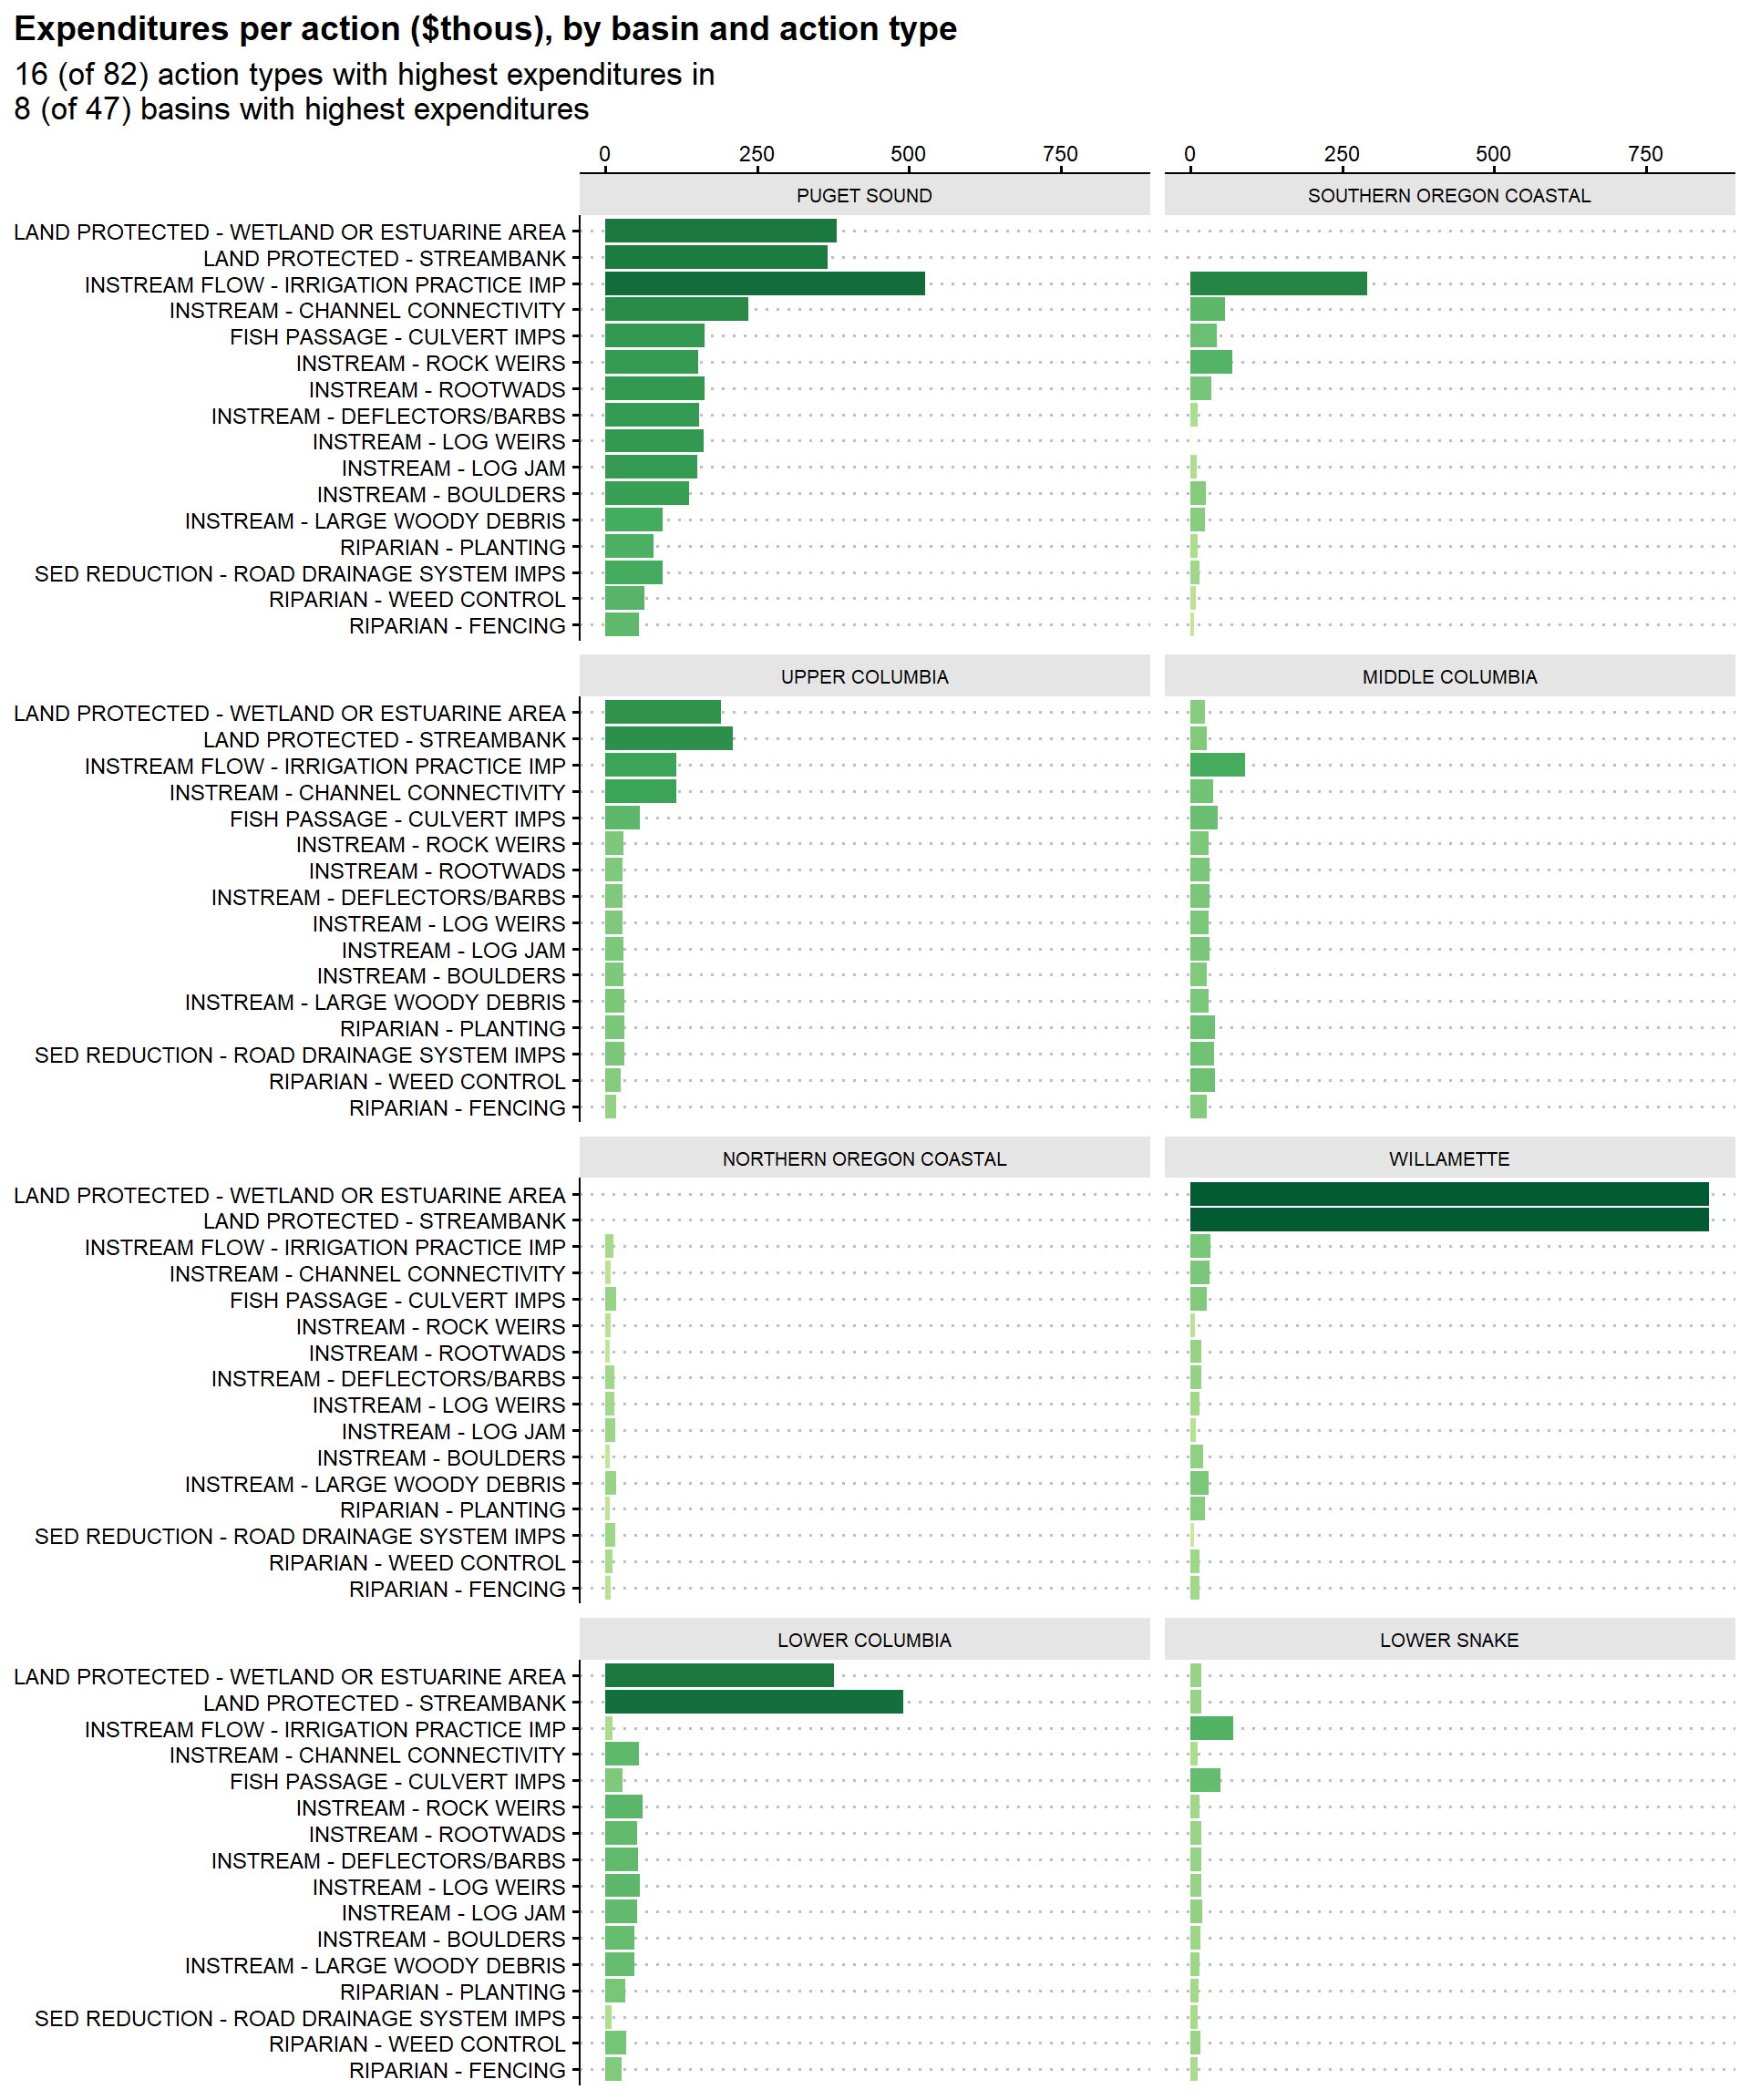
Observation: On a per action basis, projects involving channel modification have the second highest costs after land acquisition. Notably, these projects are more expensive on a per action basis than other in-stream actions like weirs, large woody debris, boulders, etc.
By Basin
By Reporting Source
Conclusions
- Cost and metric availability varies dramatically between actions and reporting source. While there is a lot of interesting data here, inconsistencies in how the data are reported how they can be used. This will be a bigger problem for some actions than others. For example, culverts and instream debris are distinct actions where metric may be less important. Costs for actions like riparian planting will be more difficult to deal with.
- Differences between reporting sources will limit the ability to model absolute cost levels. For example, OWRI projects are consistently far cheaper than those reported by Habitat Work Schedule, even for the same actions. While drivers of costs can still be modelled by controlling for these differences with fixed effects, accurately predicting total costs out-of-sample will be difficult. Comparing two out-of-sample projects and predicting which would be more expensive should be possible, but accurately predicting exact costs for each might not be.
- Focusing on culverts going forward in the near term. Because culverts are discrete actions, a simple count of “culverts per project” serves as a good measure of scale. Fish access is a major policy issue, made especially relevant by the 2018 U.S. Supreme Court Washington v. United States ruling which requires the State of Washington to improve hundreds of state-owned culverts across Western Washington.
End Matter
[1] "2021-03-15 13:32:24 PDT"R version 4.0.2 (2020-06-22)
Platform: x86_64-w64-mingw32/x64 (64-bit)
Running under: Windows 10 x64 (build 19041)
Matrix products: default
locale:
[1] LC_COLLATE=English_United States.1252
[2] LC_CTYPE=English_United States.1252
[3] LC_MONETARY=English_United States.1252
[4] LC_NUMERIC=C
[5] LC_TIME=English_United States.1252
attached base packages:
[1] stats graphics grDevices utils datasets methods base
other attached packages:
[1] here_0.1 kableExtra_1.1.0 searchable_0.3.3.1 scales_1.1.1
[5] ggthemes_4.2.0 janitor_2.0.1 forcats_0.5.0 stringr_1.4.0
[9] dplyr_1.0.1 purrr_0.3.4 readr_1.3.1 tidyr_1.1.1
[13] tibble_3.0.4 ggplot2_3.3.2 tidyverse_1.3.0 workflowr_1.6.2
loaded via a namespace (and not attached):
[1] Rcpp_1.0.5 lubridate_1.7.9 ps_1.3.3 assertthat_0.2.1
[5] rprojroot_1.3-2 digest_0.6.25 R6_2.4.1 cellranger_1.1.0
[9] backports_1.1.8 reprex_0.3.0 evaluate_0.14 httr_1.4.2
[13] pillar_1.4.6 rlang_0.4.8 readxl_1.3.1 rstudioapi_0.11
[17] blob_1.2.1 rmarkdown_2.3 labeling_0.3 webshot_0.5.2
[21] munsell_0.5.0 broom_0.7.0 compiler_4.0.2 httpuv_1.5.4
[25] modelr_0.1.8 xfun_0.16 pkgconfig_2.0.3 htmltools_0.5.0
[29] tidyselect_1.1.0 fansi_0.4.1 viridisLite_0.3.0 crayon_1.3.4
[33] dbplyr_1.4.4 withr_2.2.0 later_1.1.0.1 grid_4.0.2
[37] jsonlite_1.7.1 gtable_0.3.0 lifecycle_0.2.0 DBI_1.1.0
[41] git2r_0.27.1 magrittr_1.5 cli_2.1.0 stringi_1.4.6
[45] farver_2.0.3 fs_1.4.2 promises_1.1.1 snakecase_0.11.0
[49] xml2_1.3.2 ellipsis_0.3.1 generics_0.0.2 vctrs_0.3.4
[53] RColorBrewer_1.1-2 tools_4.0.2 glue_1.4.2 hms_0.5.3
[57] yaml_2.2.1 colorspace_1.4-1 rvest_0.3.6 knitr_1.29
[61] haven_2.3.1
R version 4.0.2 (2020-06-22)
Platform: x86_64-w64-mingw32/x64 (64-bit)
Running under: Windows 10 x64 (build 19041)

Matrix products: default

locale:
[1] LC_COLLATE=English_United States.1252
[2] LC_CTYPE=English_United States.1252
[3] LC_MONETARY=English_United States.1252
[4] LC_NUMERIC=C
[5] LC_TIME=English_United States.1252

attached base packages:
[1] stats     graphics  grDevices utils     datasets  methods   base

other attached packages:
 [1] here_0.1           kableExtra_1.1.0   searchable_0.3.3.1 scales_1.1.1
 [5] ggthemes_4.2.0     janitor_2.0.1      forcats_0.5.0      stringr_1.4.0
 [9] dplyr_1.0.1        purrr_0.3.4        readr_1.3.1        tidyr_1.1.1
[13] tibble_3.0.4       ggplot2_3.3.2      tidyverse_1.3.0    workflowr_1.6.2

loaded via a namespace (and not attached):
 [1] Rcpp_1.0.5         lubridate_1.7.9    ps_1.3.3           assertthat_0.2.1
 [5] rprojroot_1.3-2    digest_0.6.25      R6_2.4.1           cellranger_1.1.0
 [9] backports_1.1.8    reprex_0.3.0       evaluate_0.14      httr_1.4.2
[13] pillar_1.4.6       rlang_0.4.8        readxl_1.3.1       rstudioapi_0.11
[17] blob_1.2.1         rmarkdown_2.3      labeling_0.3       webshot_0.5.2
[21] munsell_0.5.0      broom_0.7.0        compiler_4.0.2     httpuv_1.5.4
[25] modelr_0.1.8       xfun_0.16          pkgconfig_2.0.3    htmltools_0.5.0
[29] tidyselect_1.1.0   fansi_0.4.1        viridisLite_0.3.0  crayon_1.3.4
[33] dbplyr_1.4.4       withr_2.2.0        later_1.1.0.1      grid_4.0.2
[37] jsonlite_1.7.1     gtable_0.3.0       lifecycle_0.2.0    DBI_1.1.0
[41] git2r_0.27.1       magrittr_1.5       cli_2.1.0          stringi_1.4.6
[45] farver_2.0.3       fs_1.4.2           promises_1.1.1     snakecase_0.11.0
[49] xml2_1.3.2         ellipsis_0.3.1     generics_0.0.2     vctrs_0.3.4
[53] RColorBrewer_1.1-2 tools_4.0.2        glue_1.4.2         hms_0.5.3
[57] yaml_2.2.1         colorspace_1.4-1   rvest_0.3.6        knitr_1.29
[61] haven_2.3.1 