Culvert Projects Summary
B. Van Deynze
March 27, 2020
This document summarizes the available culvert projects in the Pacific Northwest Salmonid Habitat Projects (PNSHP) database, with a focus on project costs. Culverts allow water to flow beneath roads, preventing washouts and flooding. However, many culvert designs prevent fish passage to spawning or rearing habitat. Improving culverts is a major priority of salmonid habitat restoration. A 2018 United States Supreme Court ruling (United States v. Washington) requires Washington State to improve state-owned culverts throughout the Puget Sound region to improve access to critical habitat for salmonid populations listed under the Endangered Species Act (ESA). These improvements are expected to cost billions of dollars. Improved understanding of drivers of the costs of culvert projects will help in prioritizing projects over space and time.
The PNSHP database is a clearinghouse for salmonid habitat improvement projects throughout the Pacific Northwest. The database is maintained at the Northwest Fisheries Science Center. Because project data is reported by a variety of entities, data quality varies. Project data includes explicit data which actions have occurred, however information on the extent of the actions, where the occur, and costs varies in availability and detail.
In the data described below, we only include projects that include geographic coordinates for work site locations that were completed between 1991 and 2015. Details on how culvert projects were identified and how the data are structured follow. The next section presents figures describing the data. We then examine additional inventories of culverts from state agencies.
Screening for Culvert Projects
The full PNSHP data includes projects with a wide range of action types. Many projects include multiple action types, often over multiple work sites. Further complicating matters, cost data is only available at the project level, meaning costs cannot be attributed to specific work sites or actions. This complicates identifying culvert projects.
There are 82 different action types included in the PNSHP data. We begin screening for culvert projects by isolating projects that include at least one of the three culvert-related action types: (1) culvert improvements or upgrades, (2) culvert removal, and (3) culvert installation. This process leaves 3,107 projects related to culvert improvement.
However, a good number of these projects involve not just culvert-related actions. These projects include 13,305 actions, but only 6,391 are culvert related.
| Action type | N |
|---|---|
| FISH PASSAGE - CULVERT IMPROVEMENTS OR UPGRADES | 3,897 |
| SEDIMENT REDUCTION - ROAD DRAINAGE SYSTEM IMPROVEMENTS | 1,708 |
| FISH PASSAGE - CULVERT REMOVAL | 1,695 |
| FISH PASSAGE - CULVERT INSTALLATION | 799 |
| SEDIMENT REDUCTION - ROAD OBLITERATION | 680 |
| RIPARIAN - PLANTING | 448 |
| INSTREAM - LARGE WOODY DEBRIS | 377 |
| INSTREAM - WOOD STRUCTURE/ LOG JAM | 371 |
| UPLAND VEGETATION - PLANTING | 211 |
| FISH PASSAGE - WEIRS (INCOMPLETE DAMS) | 192 |
| RIPARIAN - WEED CONTROL | 180 |
| UPLAND AGRICULTURE - BEST MANAGEMENT PRACTICES/ STRUCTURAL PRACTICES | 169 |
| RIPARIAN - FENCING | 167 |
| FISH PASSAGE - BARRIERS (DAMS OR LOG JAMS) | 164 |
| FISH PASSAGE - ROAD CROSSINGS IN STREAM (OTHER THAN CULVERTS) | 156 |
| INSTREAM - STREAMBANK STABILIZATION | 142 |
| SEDIMENT REDUCTION - SEDIMENT CONTROL | 138 |
| FISH PASSAGE - DIVERSION DAM/ PUSH UP DAM REMOVAL | 124 |
| INSTREAM - BOULDERS | 124 |
| INSTREAM - OFF CHANNEL HABITAT | 93 |
| SEDIMENT REDUCTION - ROAD RELOCATION | 83 |
| WETLAND - WETLAND IMPROVEMENT/ ENHANCEMENT | 78 |
| INSTREAM - DEFLECTORS/ BARBS | 75 |
| INSTREAM - ROCK WEIRS | 75 |
| INSTREAM - CHANNEL CONNECTIVITY | 69 |
| INSTREAM - LOG WEIRS | 68 |
| SEDIMENT REDUCTION - ROAD STREAM CROSSING IMPROVEMENTS | 65 |
| SEDIMENT REDUCTION - ROAD RECONSTRUCTION | 65 |
| INSTREAM - CHANNEL RECONFIGURATION | 62 |
| INSTREAM - ROOTWADS | 59 |
| WETLAND - WETLAND RESTORATION | 58 |
| SEDIMENT REDUCTION - EROSION CONTROL STRUCTURES | 56 |
| UPLAND LIVESTOCK - UPLAND GRAZING MANAGEMENT | 53 |
| UPLAND LIVESTOCK - WATER DEVELOPMENT | 43 |
| ESTUARY/ NEARSHORE - TIDEGATE ALTERATION/ REMOVAL | 40 |
| UPLAND VEGETATION - SLOPE STABILIZATION | 40 |
| UPLAND LIVESTOCK - UPLAND EXCLUSION OR FENCING | 36 |
| ESTUARY/ NEARSHORE - REMOVAL OF EXISTING FILL MATERIAL | 34 |
| RIPARIAN - WATER GAP DEVELOPMENT | 33 |
| INSTREAM FLOW - IRRIGATION PRACTICE IMPROVEMENT | 32 |
| FISH SCREENING - FISH SCREEN INSTALLED | 32 |
| WETLAND - WETLAND INVASIVE SPECIES REMOVAL | 30 |
| WETLAND - WETLAND CREATION | 25 |
| ESTUARY/ NEARSHORE - DIKE BREACHING/ REMOVAL | 24 |
| FISH PASSAGE - FISHWAYS (CHUTES OR POOLS) INSTALLED | 23 |
| FISH PASSAGE - FISH LADDER INSTALLED | 21 |
| UPLAND VEGETATION - INVASIVE PLANT CONTROL | 20 |
| WETLAND - PLANT REMOVAL/ CONTROL | 17 |
| ESTUARY/ NEARSHORE - DIKE RECONFIGURATION | 14 |
| INSTREAM - PLANT REMOVAL/ CONTROL | 14 |
| WETLAND - PLANTING | 14 |
| UPLAND VEGETATION - VEGETATION/ STAND MANAGEMENT | 13 |
| FISH SCREENING - FISH SCREEN REPLACED | 12 |
| INSTREAM - SPAWNING GRAVEL PLACEMENT | 11 |
| ESTUARY/ NEARSHORE - CHANNEL MODIFICATION | 10 |
| RIPARIAN - FORESTRY PRACTICES/ STAND MANAGEMENT | 10 |
| RIPARIAN - LIVESTOCK EXCLUSION | 8 |
| UPLAND AGRICULTURE - BEST MANAGEMENT PRACTICES/ AGRICULTURE MANAGEMENT | 6 |
| FISH PASSAGE IMPROVEMENT - ROCKED FORD- ROAD STREAM CROSSING | 6 |
| ESTUARY/ NEARSHORE - RESTORATION/REHABILITATION OF ESTUARINE HABITAT | 5 |
| INSTREAM FLOW - WATER LEASED OR PURCHASED | 4 |
| INSTREAM - PREDATOR REMOVAL PROJECT | 4 |
| INSTREAM - BEAVER INTRODUCTION | 3 |
| ESTUARY/ NEARSHORE - SHORELINE ARMOR REMOVAL OR MODIFICATION | 2 |
| FISH PASSAGE - FISH LADDER IMPROVED | 2 |
| LAND PROTECTED, ACQUIRED, OR LEASED - STREAMBANK PROTECTION | 2 |
| LAND PROTECTED, ACQUIRED, OR LEASED - WETLAND OR ESTUARINE AREA PROTECTION | 2 |
| PROJECT MAINTENANCE - SITE MAINTENANCE | 2 |
| RIPARIAN - CONSERVATION GRAZING MANAGEMENT | 2 |
| WATER QUALITY IMPROVEMENT - STORMWATER/WASTEWATER | 2 |
| ESTUARY/ NEARSHORE - INVASIVE SPECIES TREATED | 1 |
| NUTRIENT ENRICHMENT - CARCASS ANALOG | 1 |
| NUTRIENT ENRICHMENT - CARCASS PLACEMENT | 1 |
| NUTRIENT ENRICHMENT - FERTILIZER | 1 |
| WATER QUALITY IMPROVEMENT - REFUSE REMOVAL | 1 |
| WATER QUALITY IMPROVEMENT - TOXIC CLEAN-UP | 1 |
Idea: Other road work like road drainage improvements and road obliteration occur most frequently alongside culvert actions for “dirty” projects. It may be possible to control for this kind of “contamination” with simple indicator variables in a cost model.
Our ultimate goal is to get a “cost per culvert” measure. Because costs are reported at the project level, disentangling costs related to culverts and costs related to other actions will be challenging. For now, we will focus on the 2,066 projects that only involve culvert actions. We will call these projects the “pure” culvert projects and projects that are “contaminated” with other actions “dirty” projects. Project costs are available for the vast majority of pure projects, though if we can recover data from the contaminated dirty projects, we can boost our ultimate project-level sample size as much as 45%.
| Project costs available? | N | % |
|---|---|---|
| False | 275 | 13% |
| True | 1,791 | 87% |
| Project costs available? | N | % |
|---|---|---|
| False | 222 | 21% |
| True | 813 | 79% |
| # of work sites | N | % |
|---|---|---|
| 1 | 1,683 | 81.462% |
| 2 | 285 | 13.795% |
| 3 | 42 | 2.033% |
| 4 | 28 | 1.355% |
| 5 | 7 | 0.339% |
| 6 | 6 | 0.290% |
| 7 | 4 | 0.194% |
| 8 | 5 | 0.242% |
| 9 | 1 | 0.048% |
| 10 | 3 | 0.145% |
| 11 | 1 | 0.048% |
| 18 | 1 | 0.048% |
| # of actions | N | % |
|---|---|---|
| 1 | 1,620 | 78.412% |
| 2 | 332 | 16.070% |
| 3 | 41 | 1.985% |
| 4 | 42 | 2.033% |
| 5 | 6 | 0.290% |
| 6 | 7 | 0.339% |
| 7 | 3 | 0.145% |
| 8 | 7 | 0.339% |
| 9 | 1 | 0.048% |
| 10 | 4 | 0.194% |
| 14 | 1 | 0.048% |
| 18 | 1 | 0.048% |
| 22 | 1 | 0.048% |
Descriptive Figures for Culvert Projects
This section includes plots of the frequency of culvert projects and actions, the total spending on these projects, and the distributions of cost per culvert (project cost divided by the culvert counts constructed above), separated out by action type, basin, year, and reporting source. It also includes maps of where these culvert projects are distributed.
Action Counts
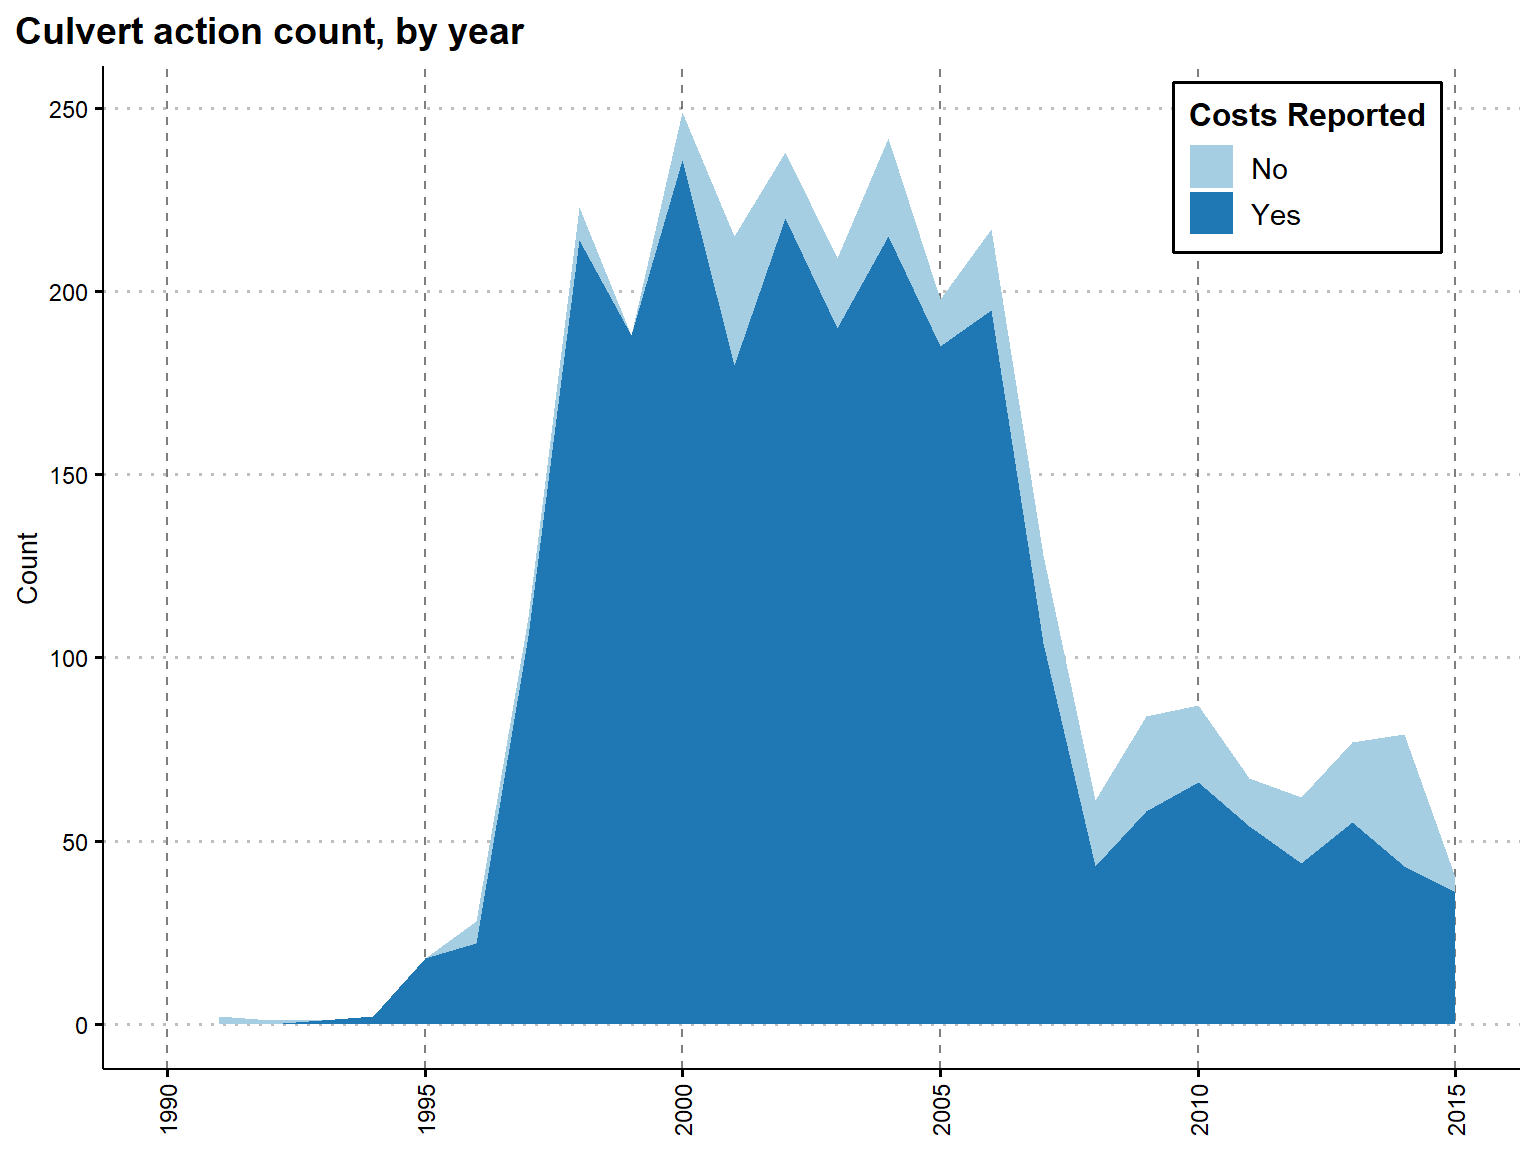
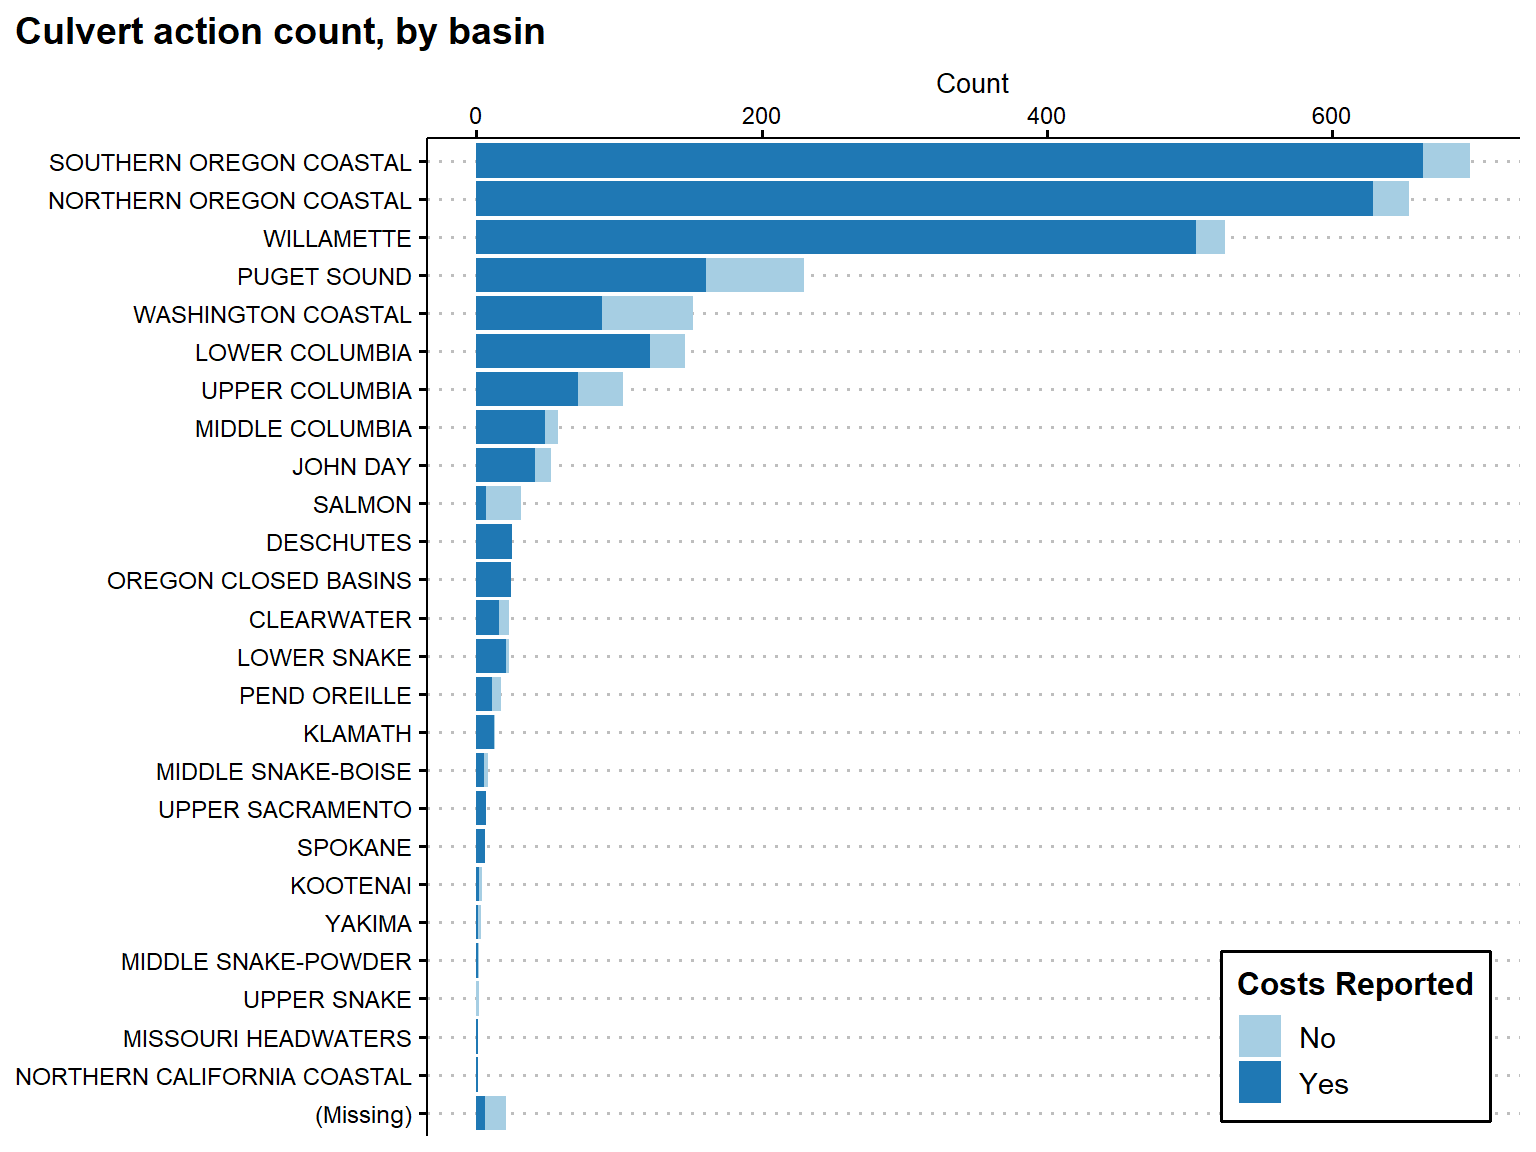
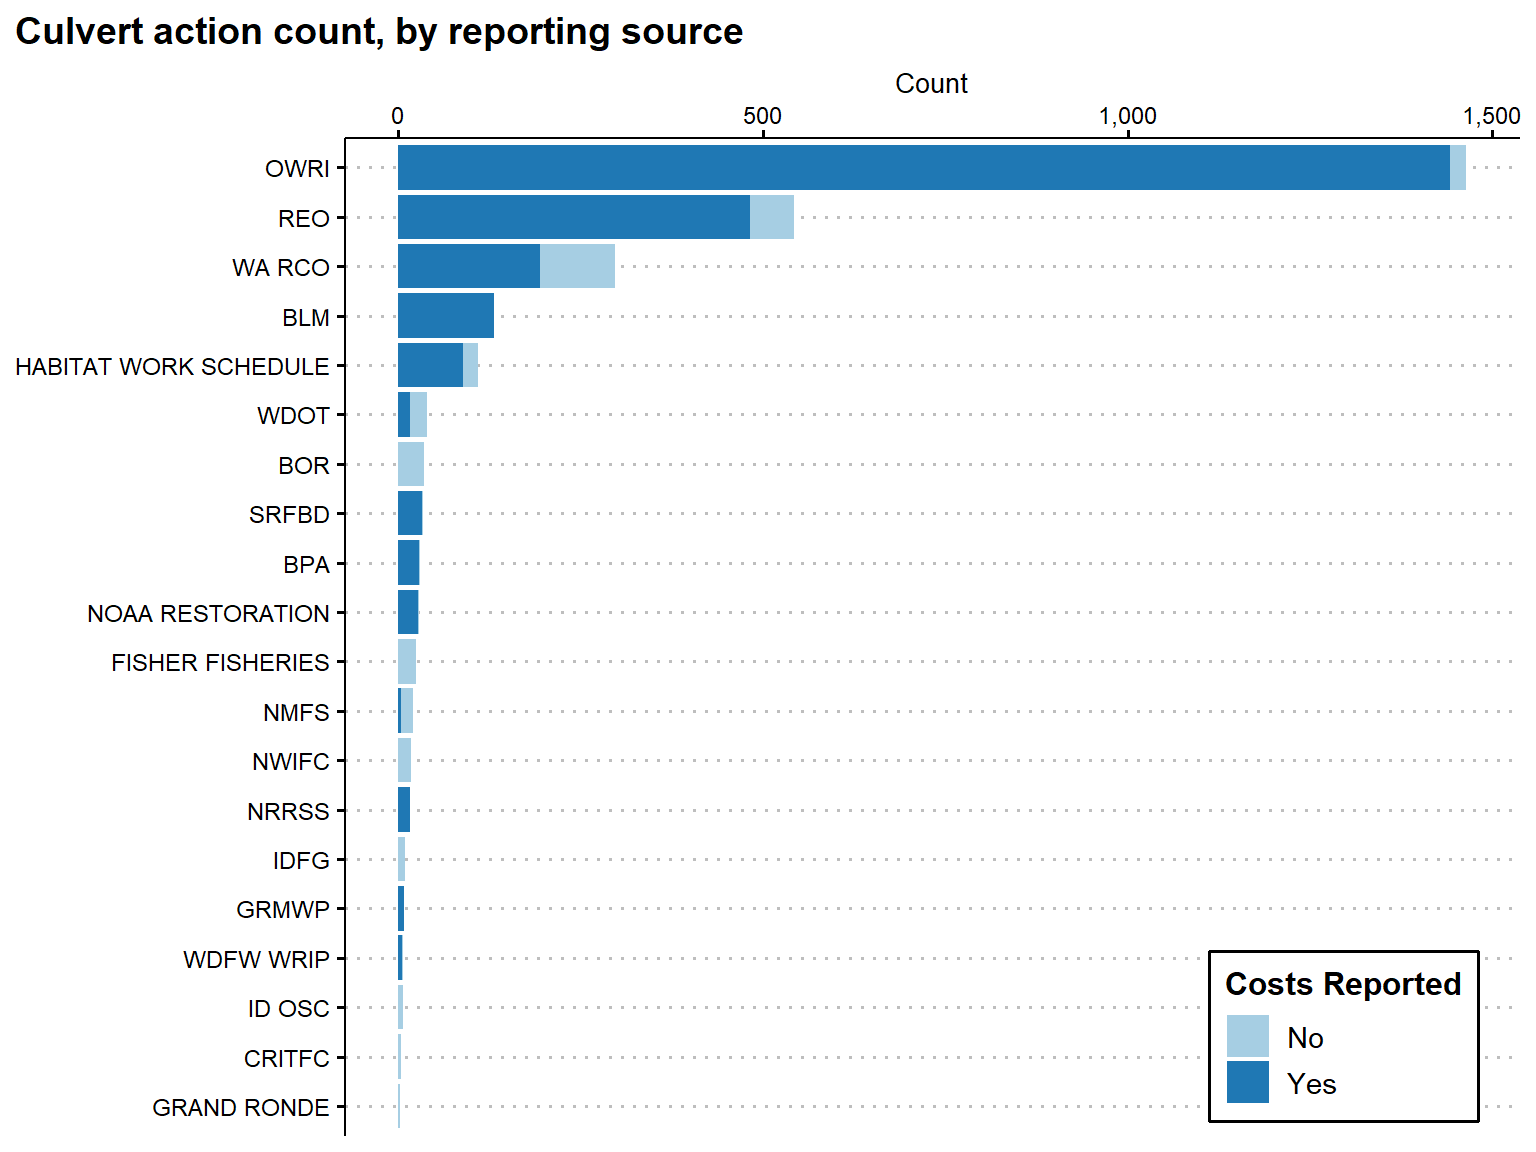
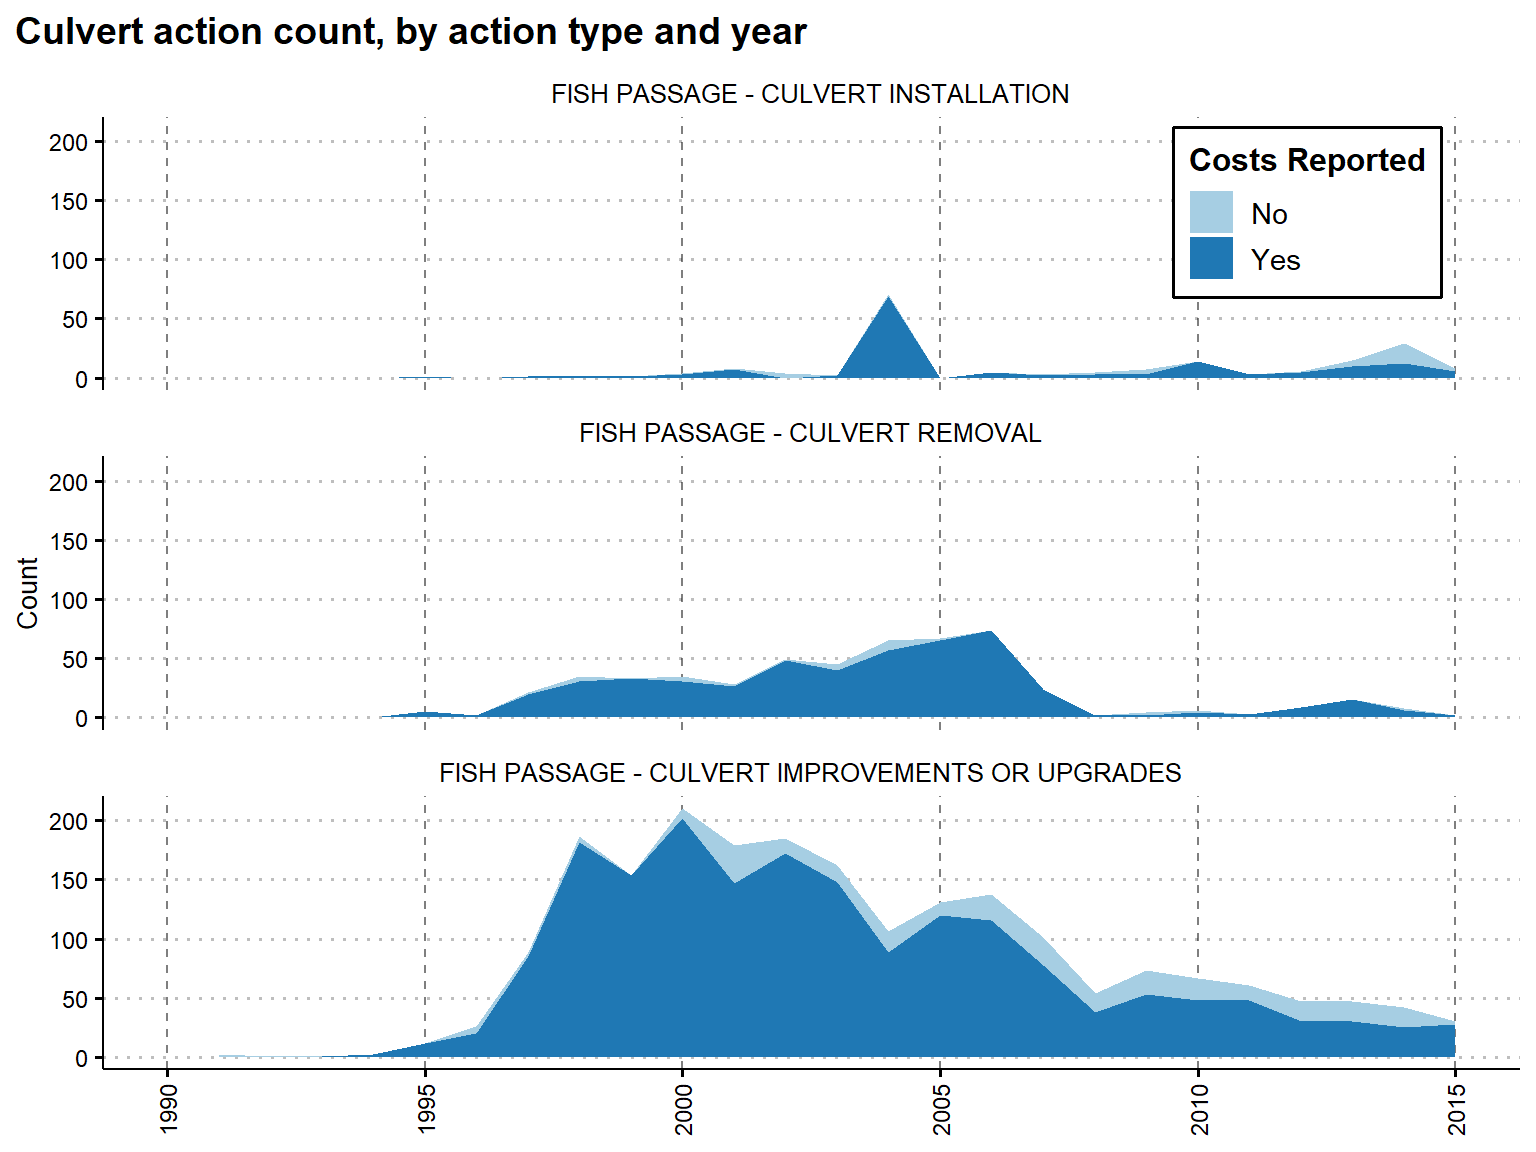
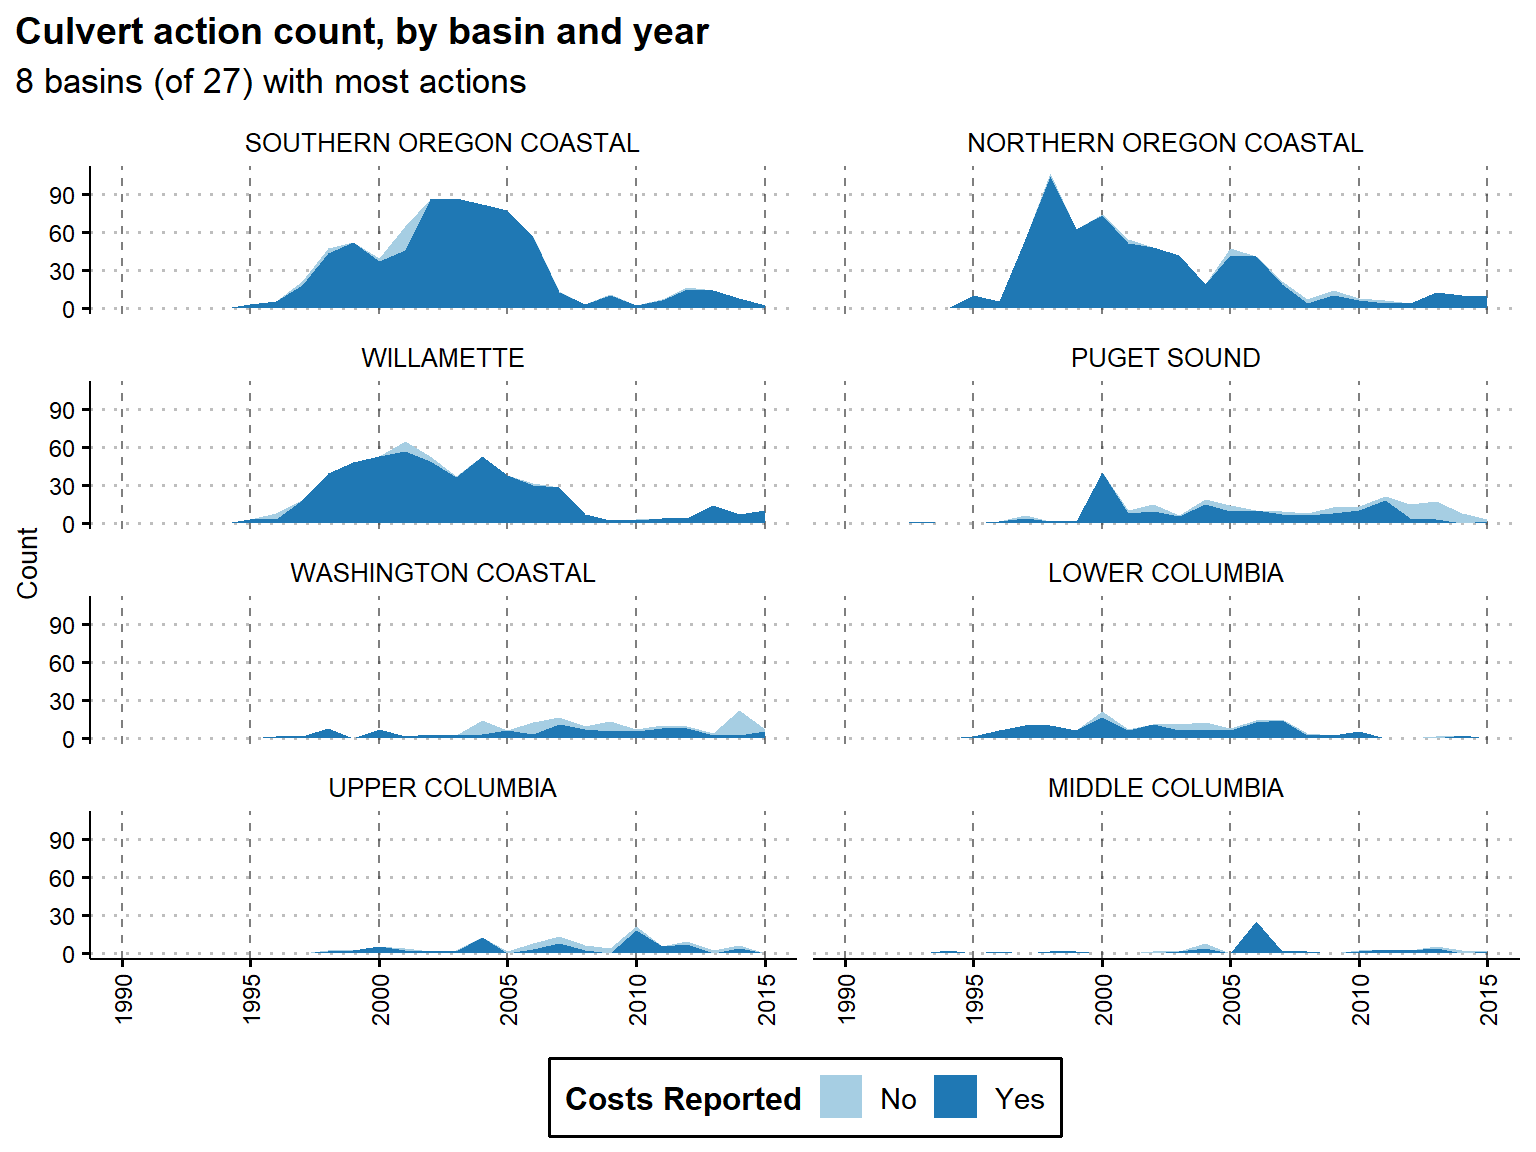
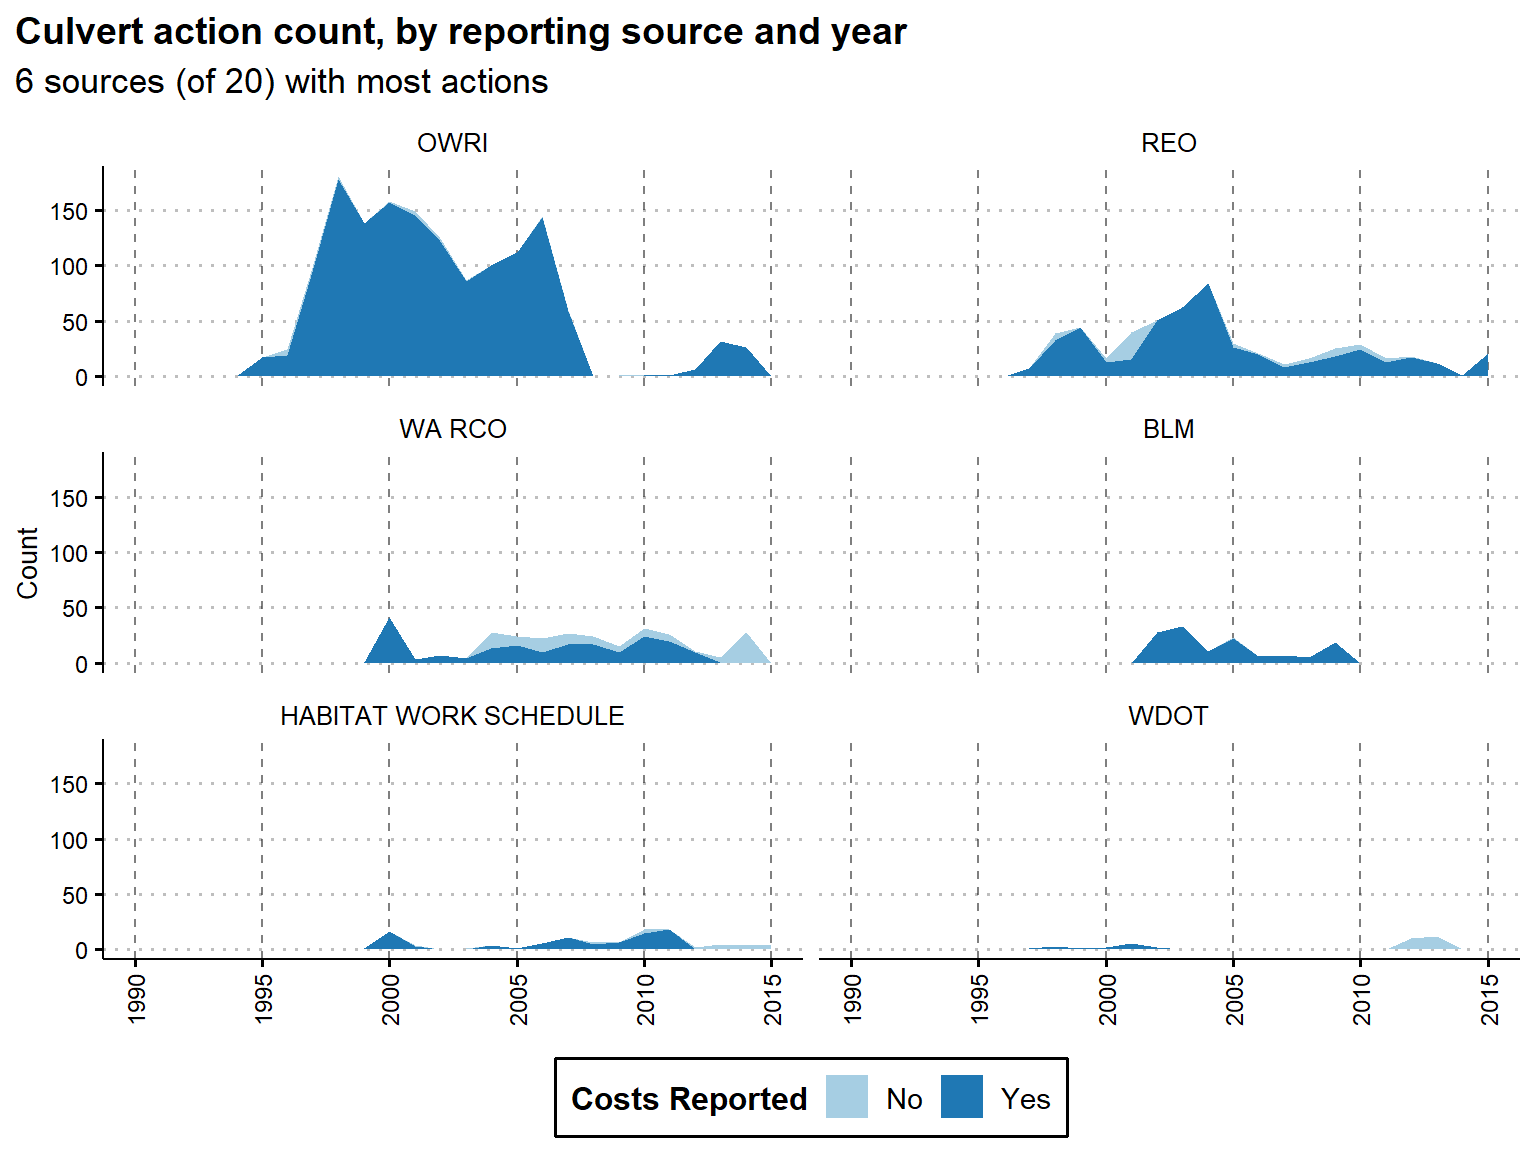
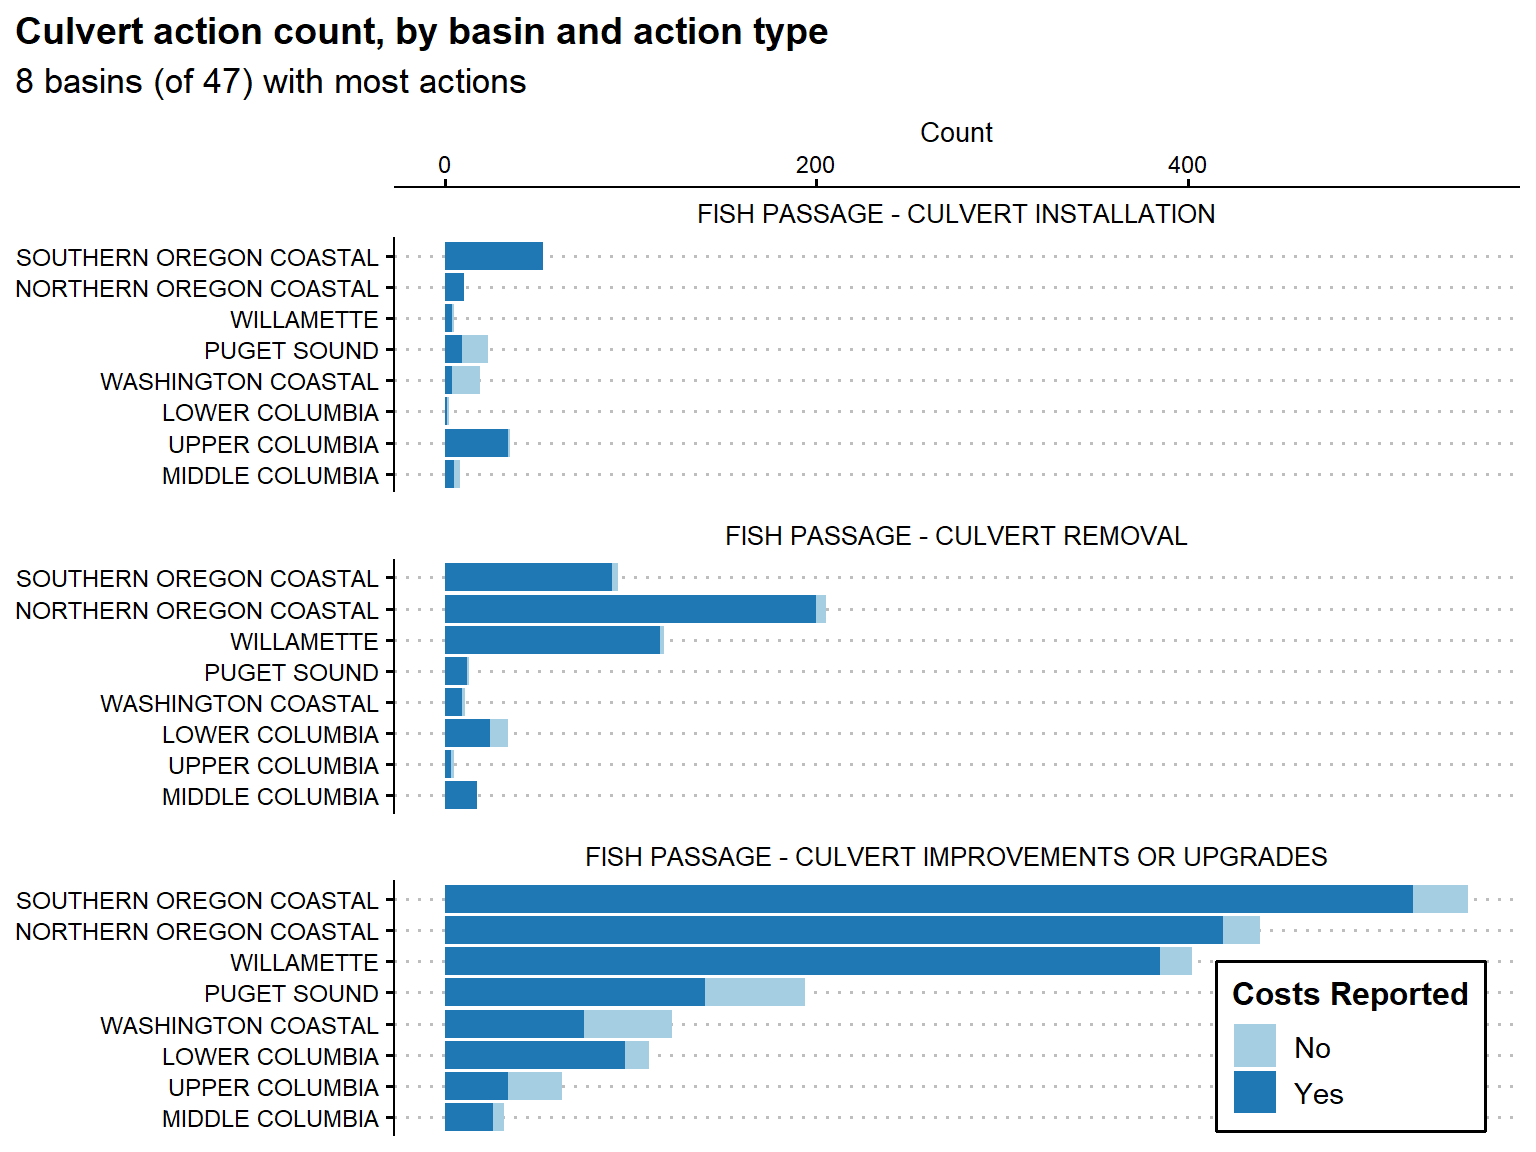
Action Counts
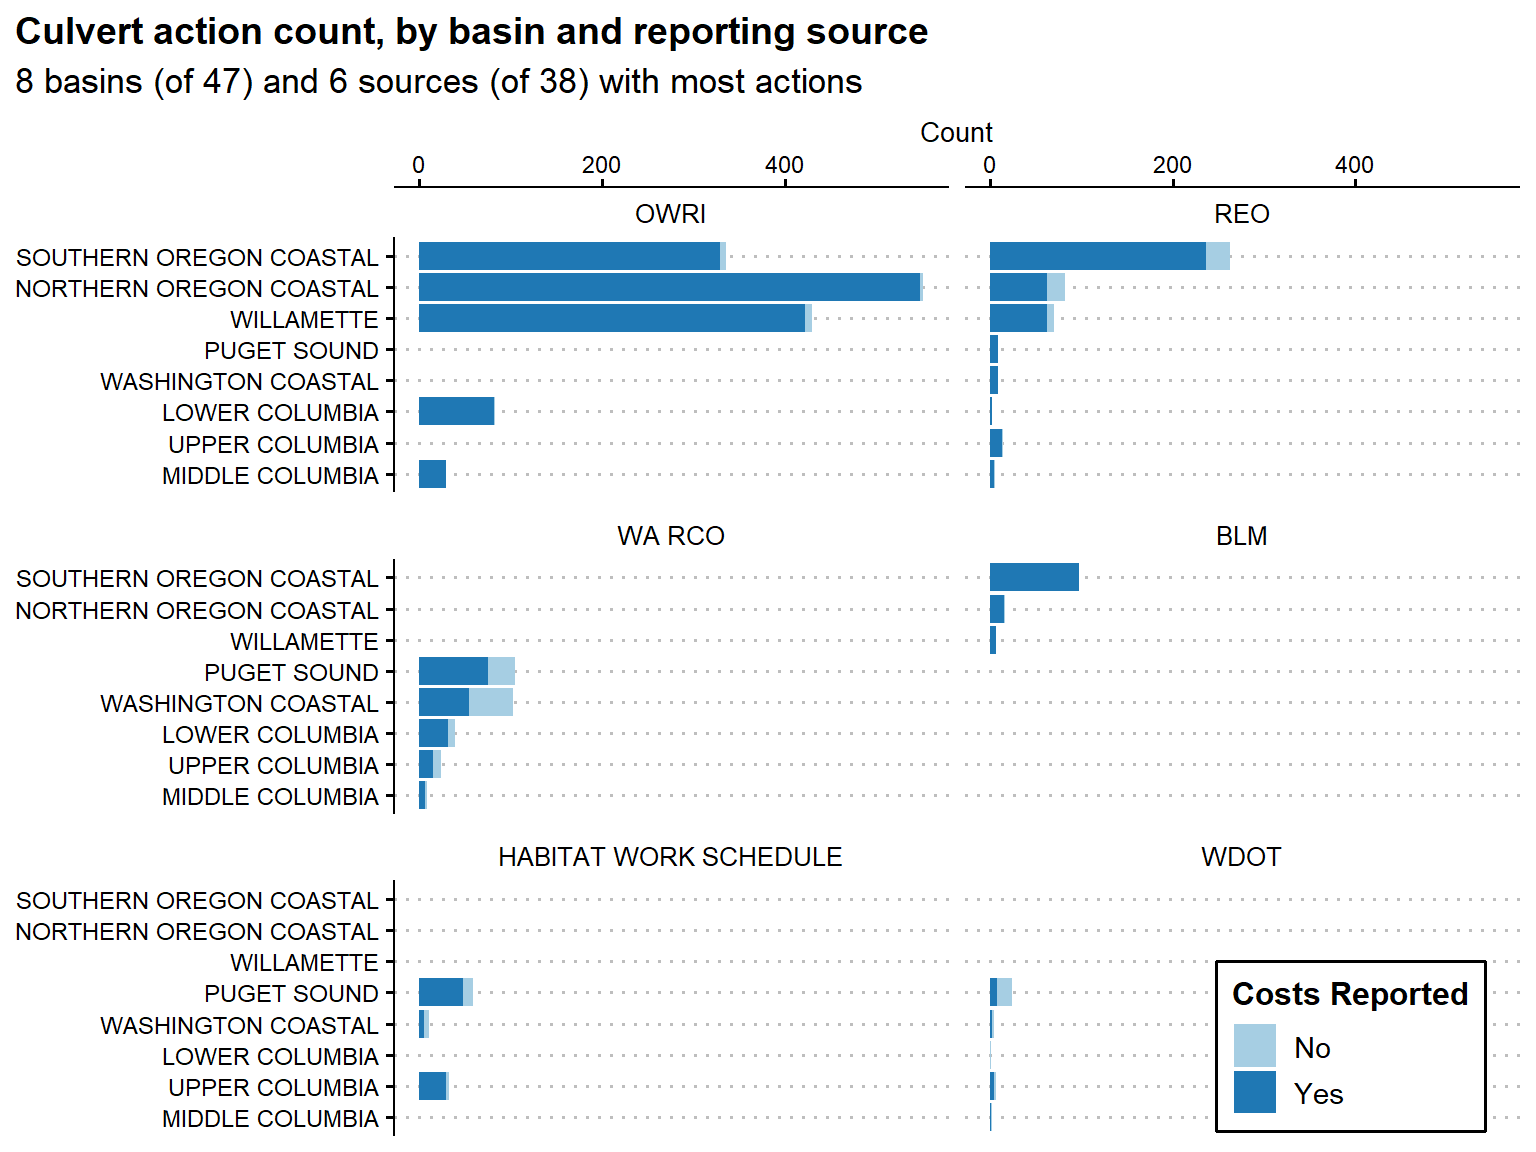
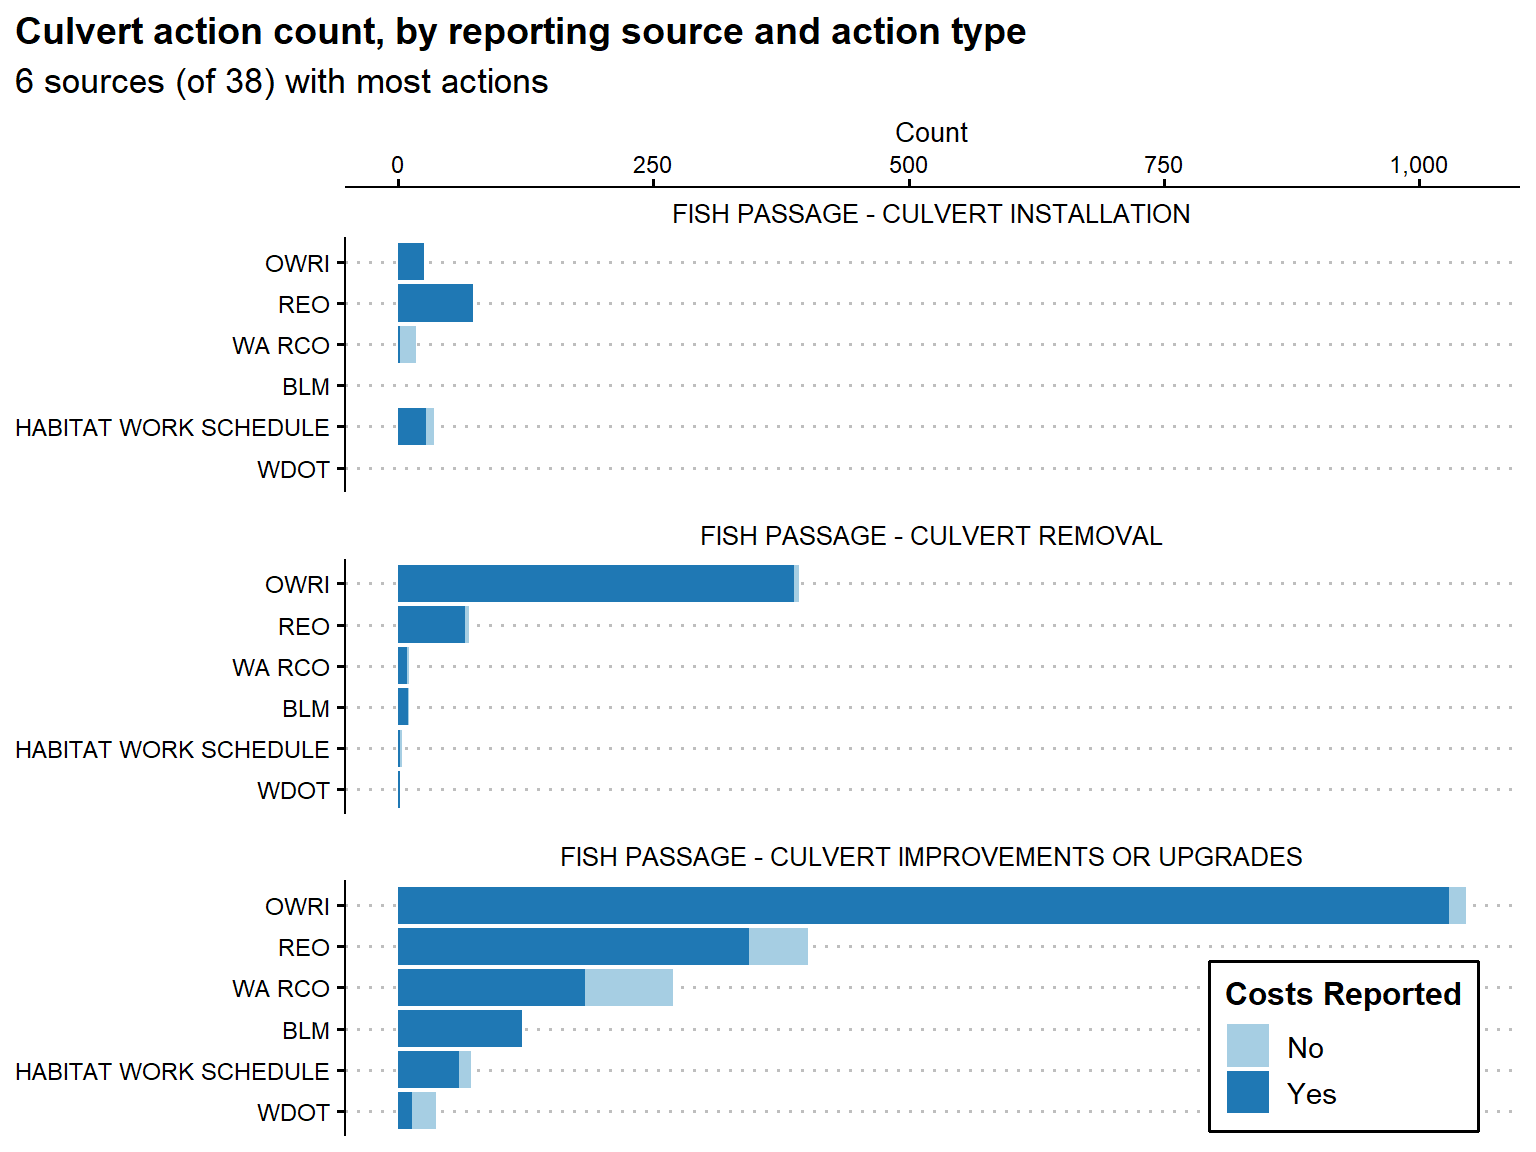
Counts of culvert-related actions by action-type, year, basin, and reporting source, separated by project cost availability. Only actions associated with pure culvert projects included. 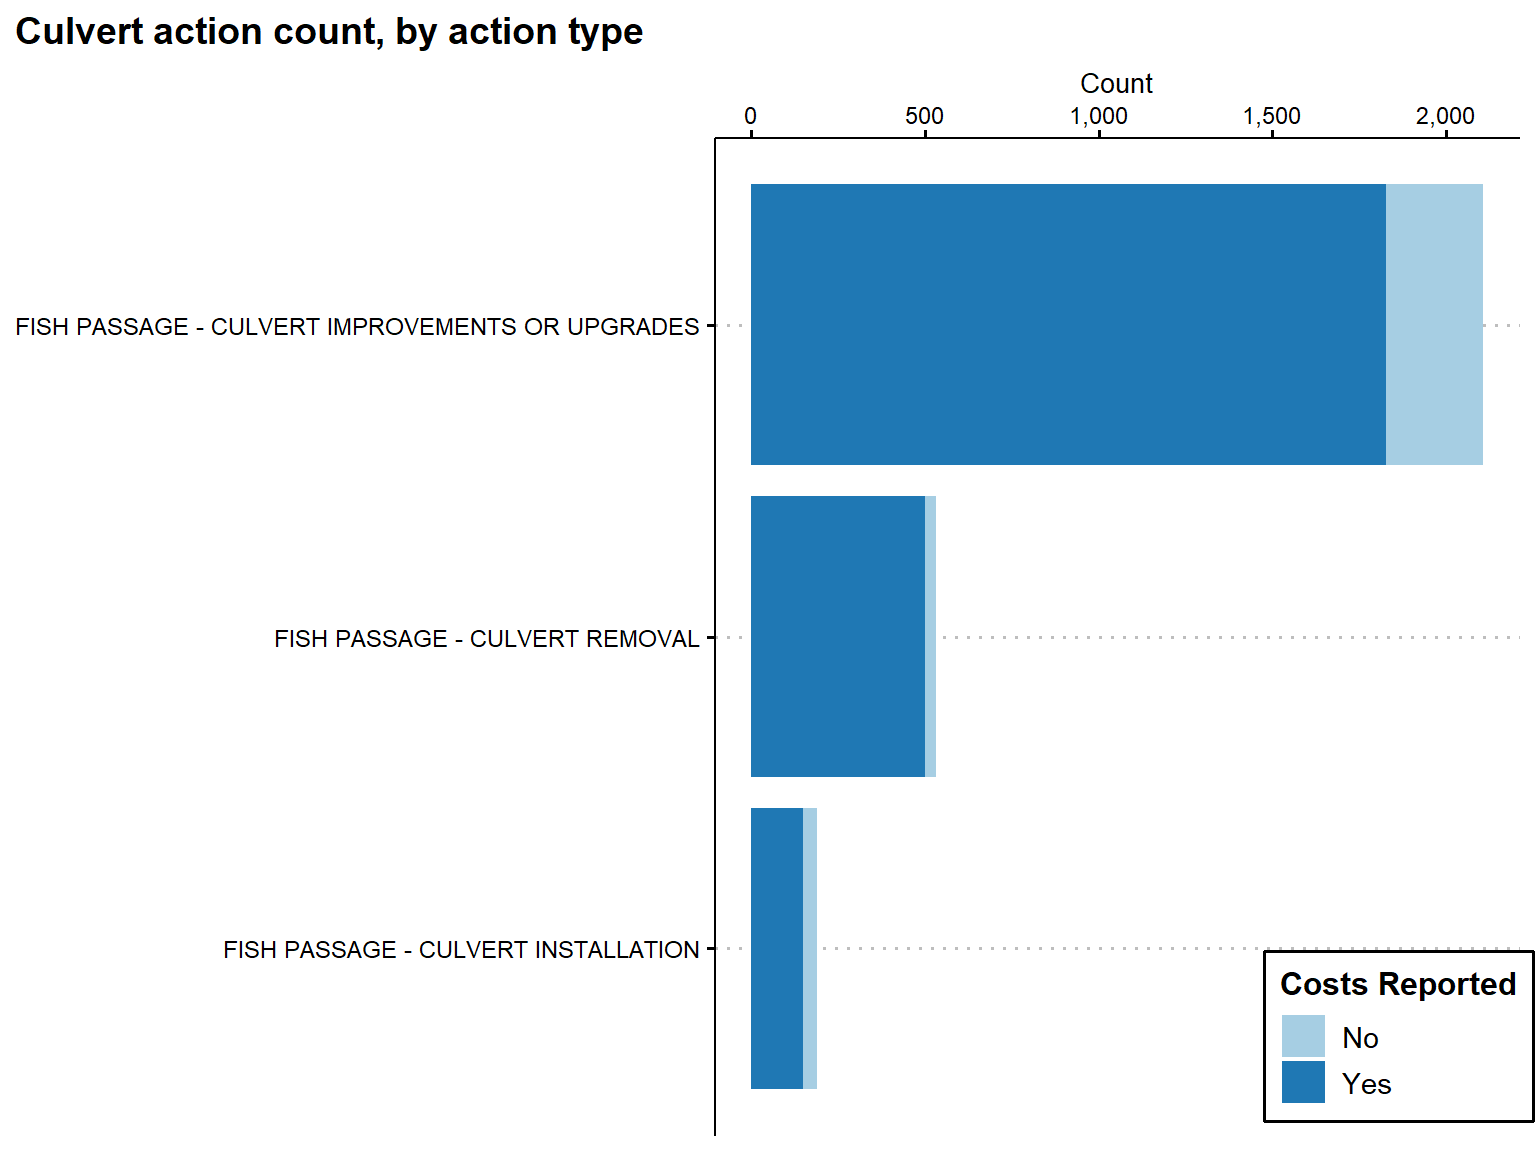
 Source glossery
Back to top
Project Counts
Project Counts
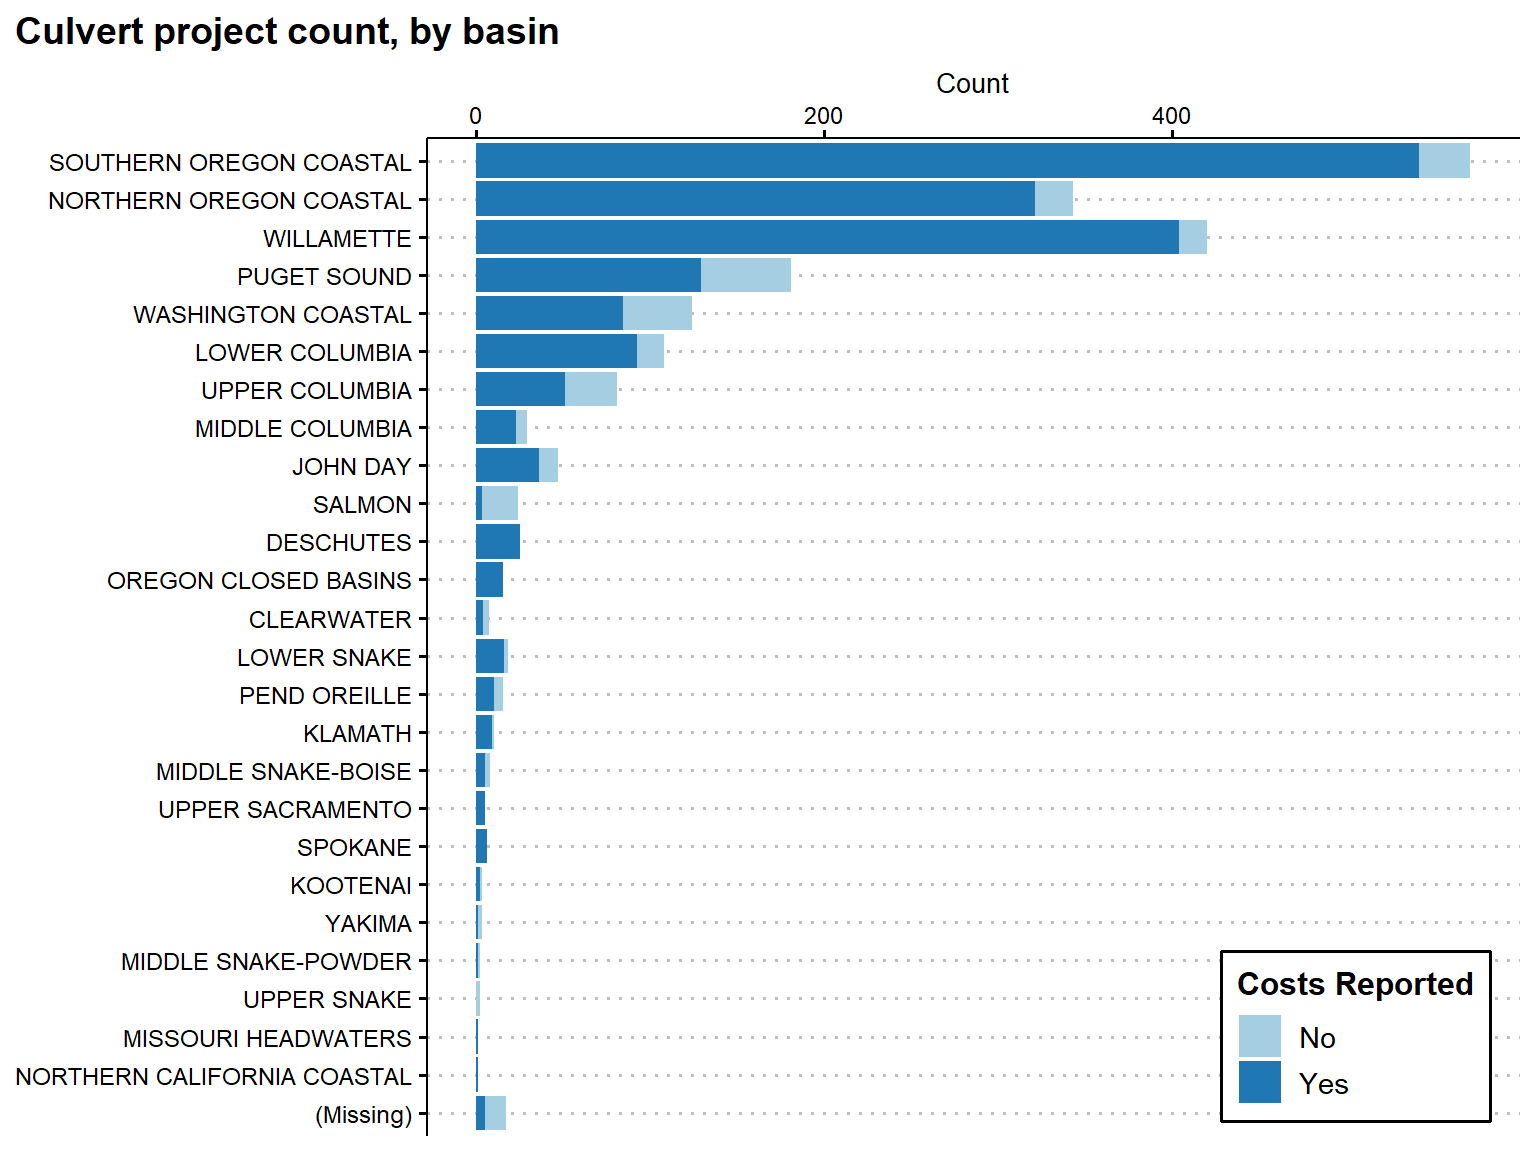
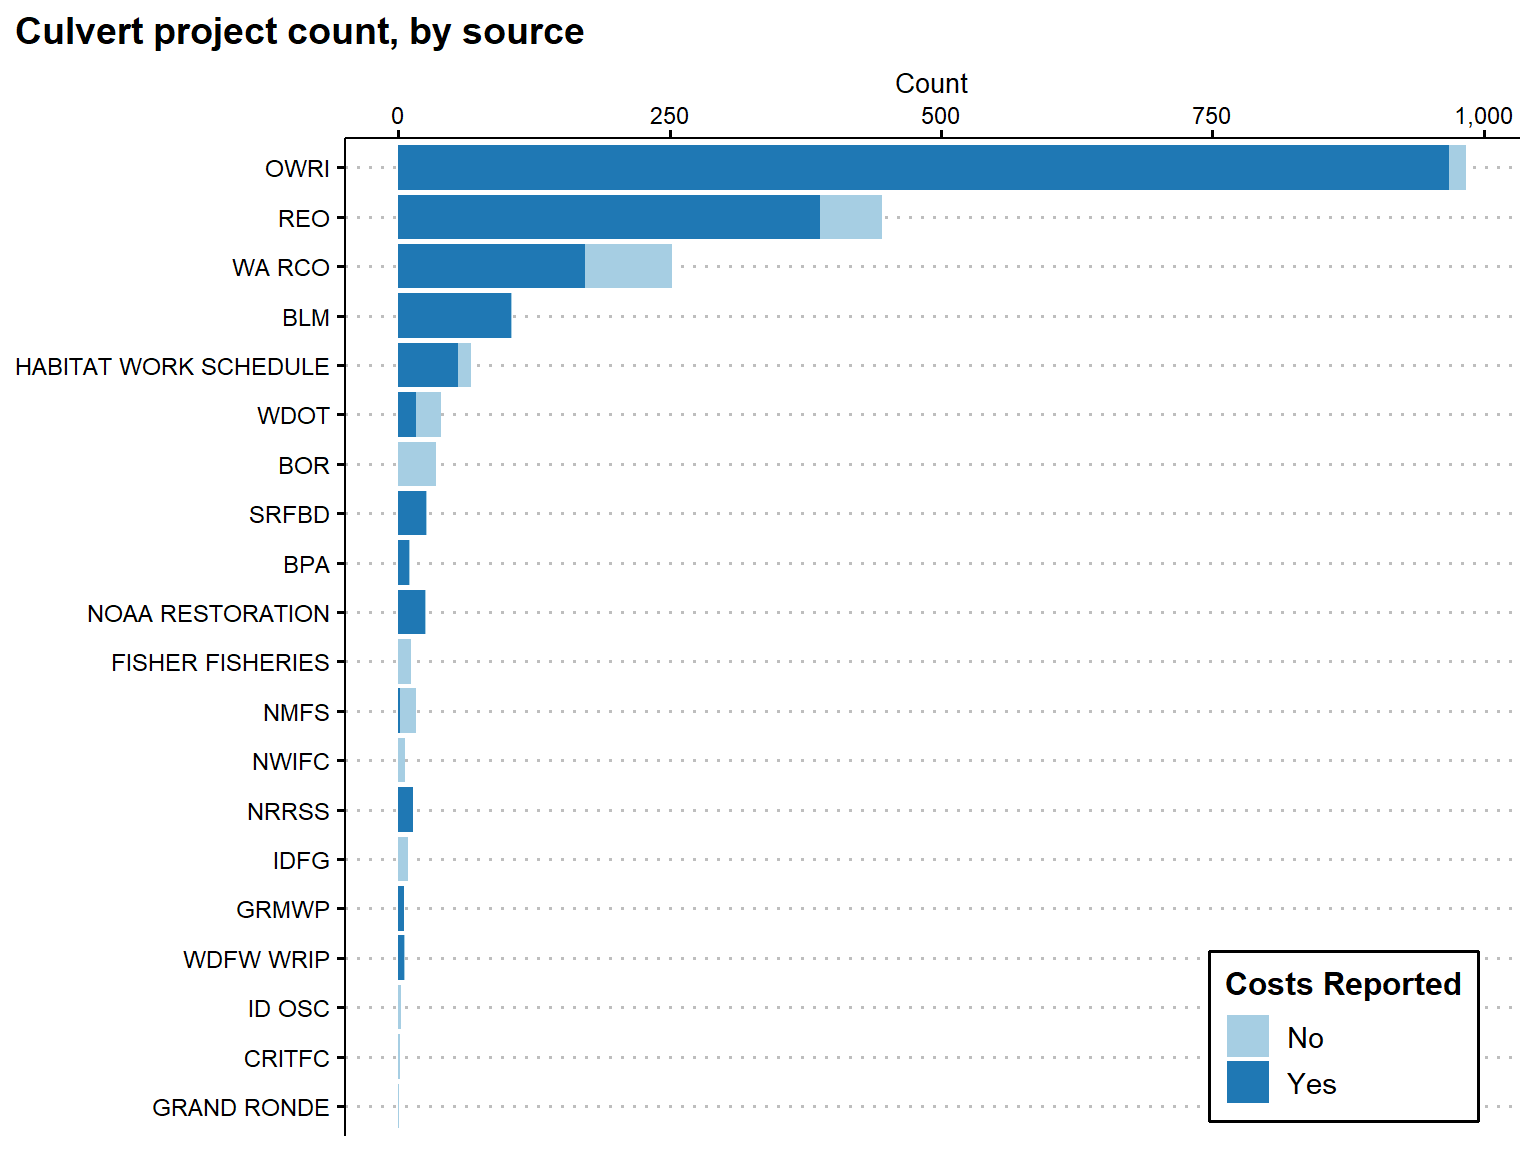
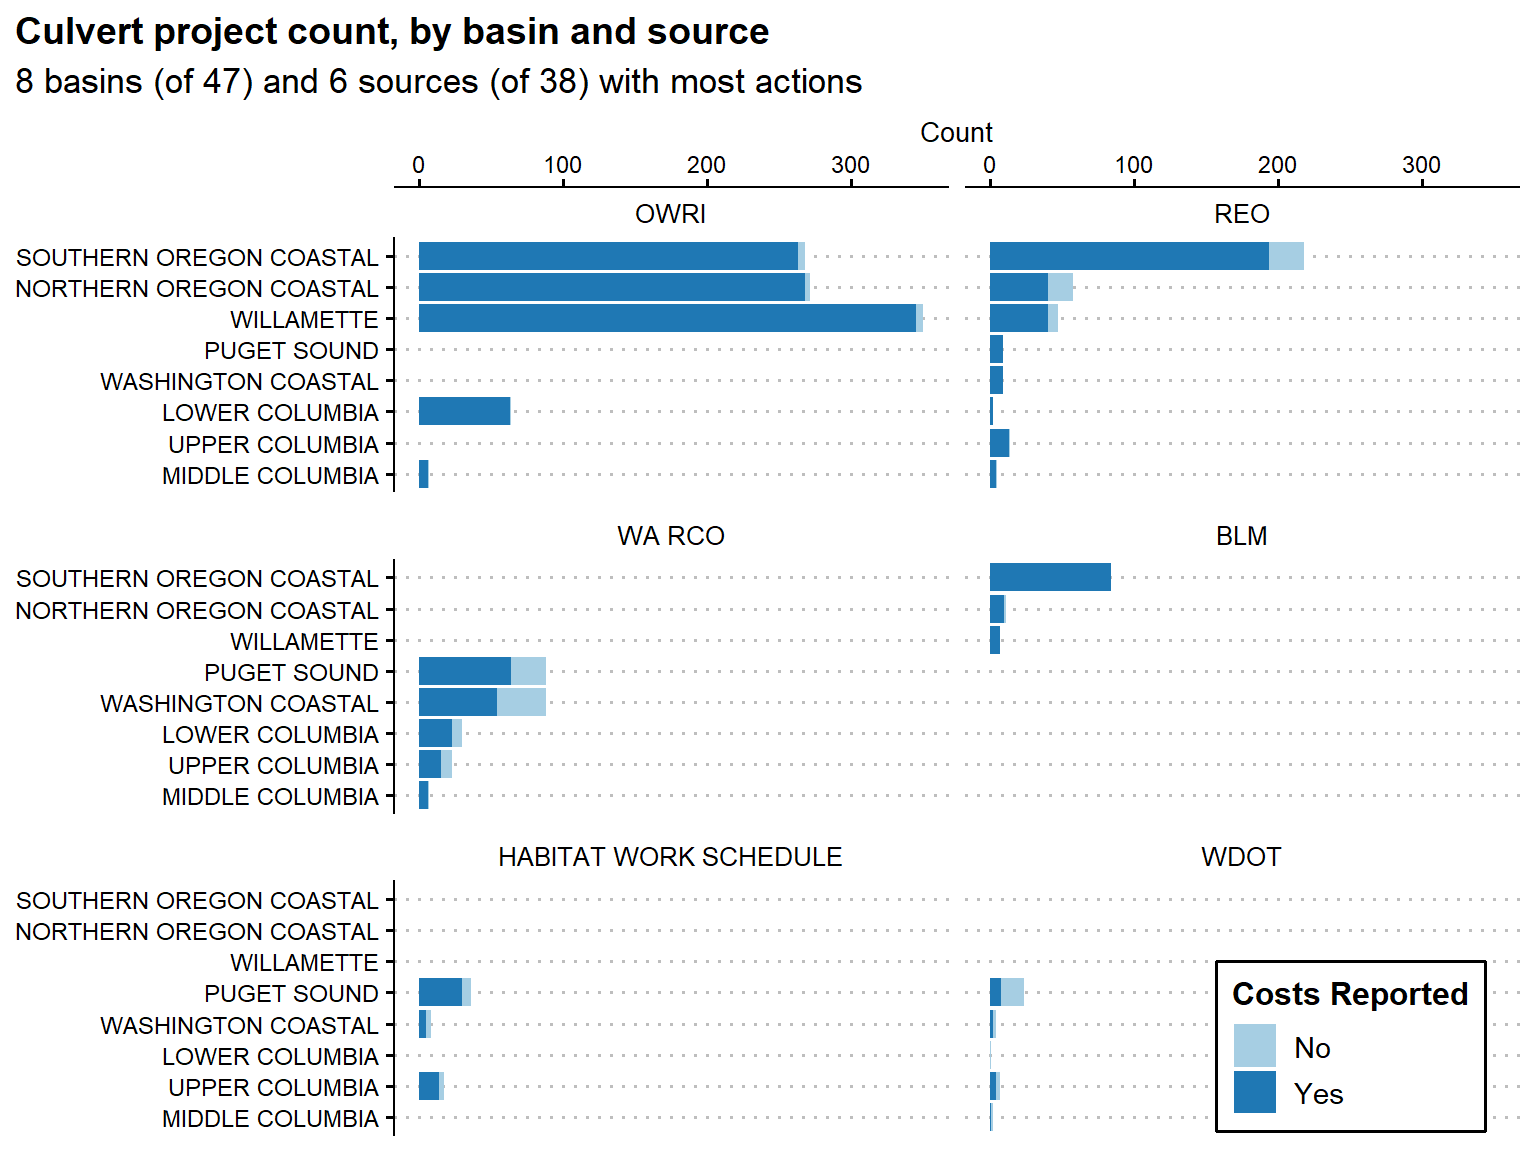
Counts of culvert-related projects by year, basin, and reporting source, separated by project cost availability. Only pure culvert projects included. 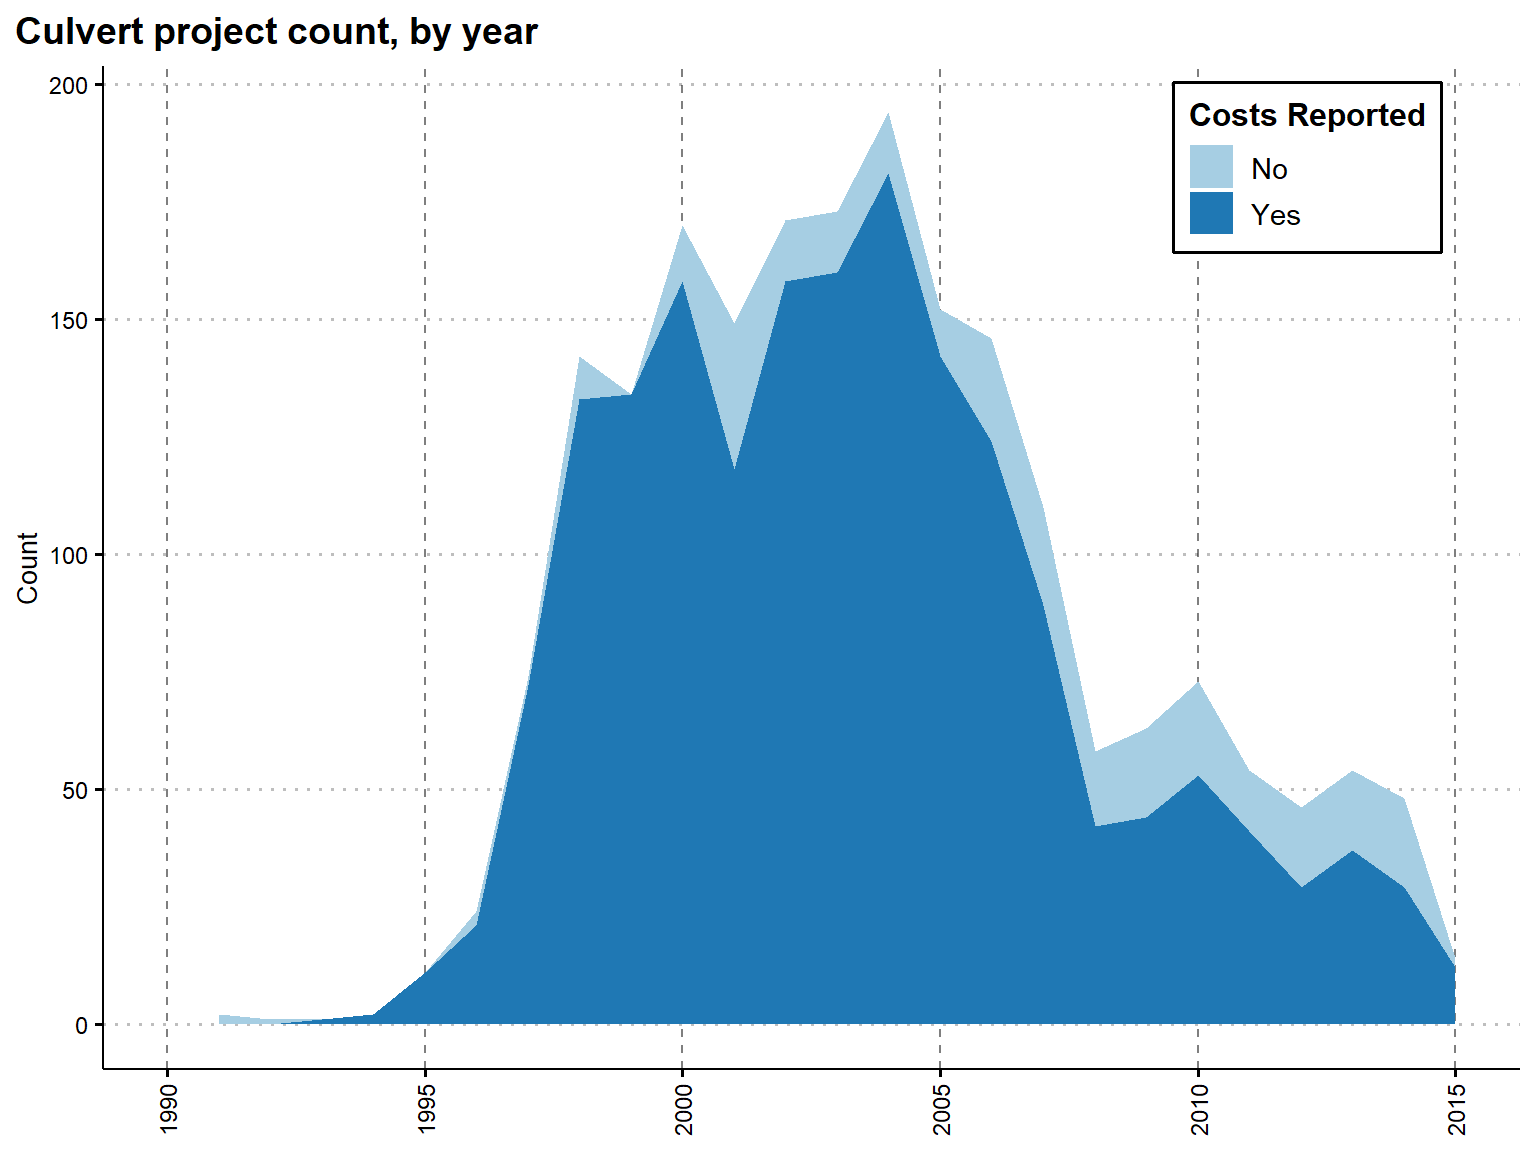
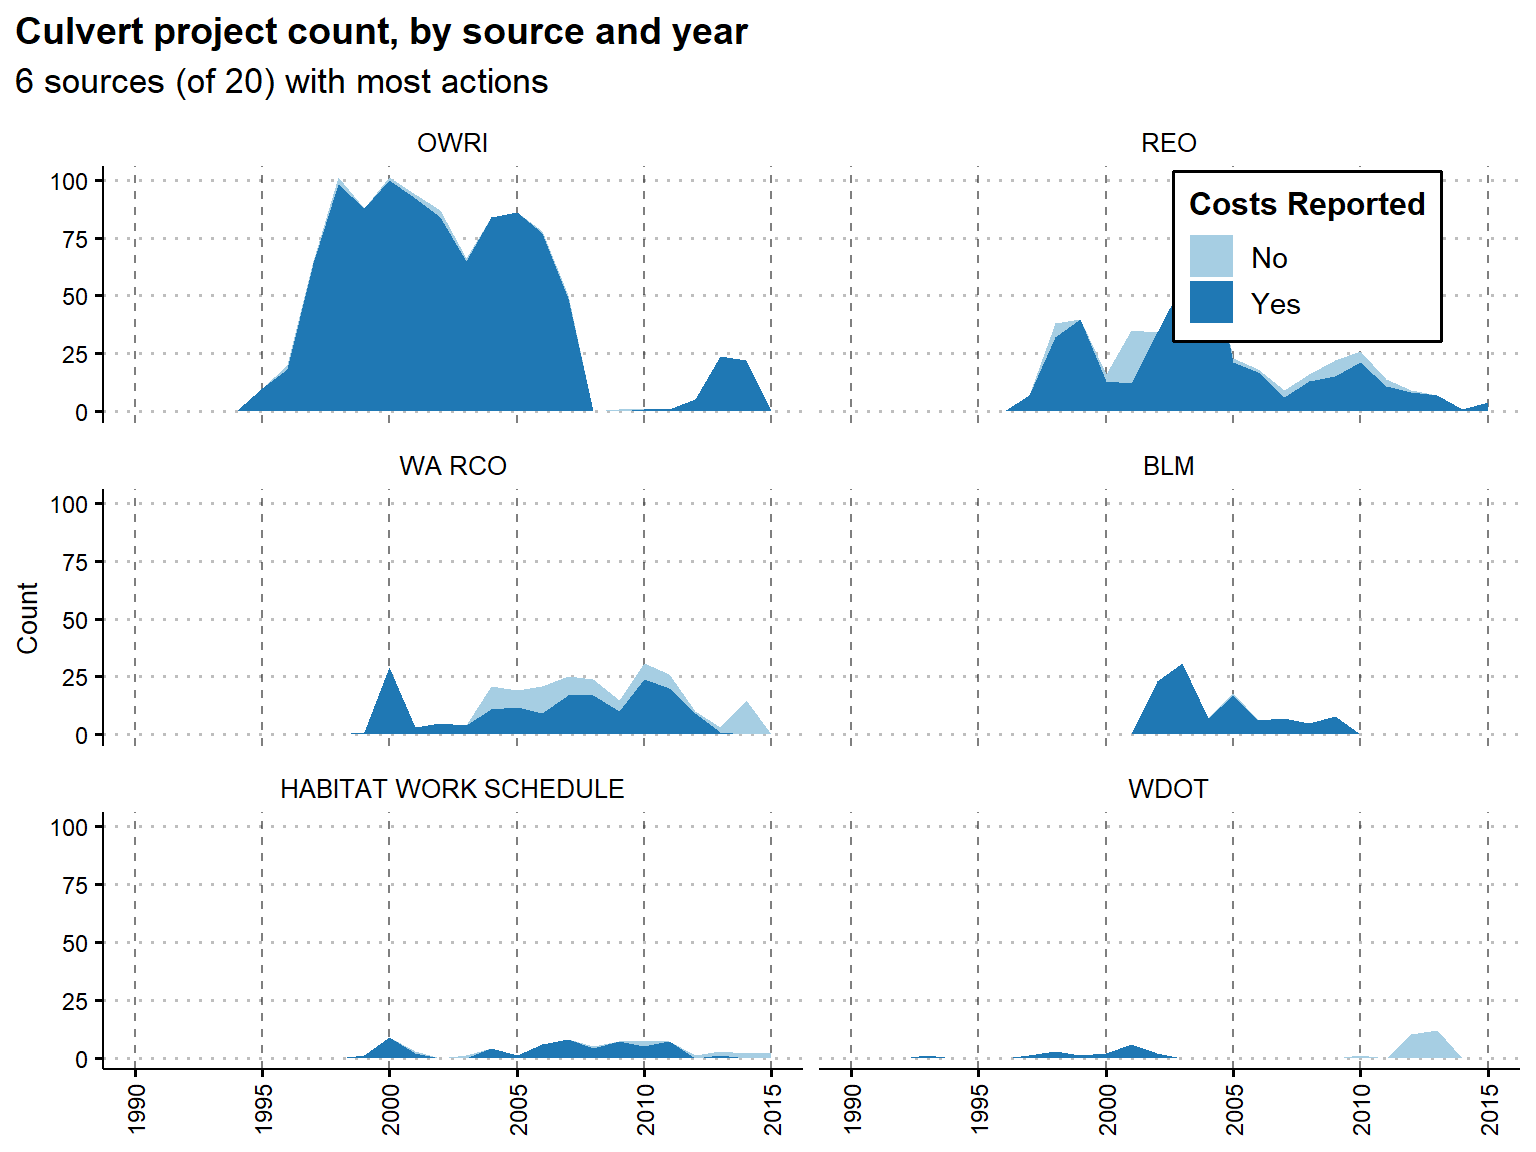
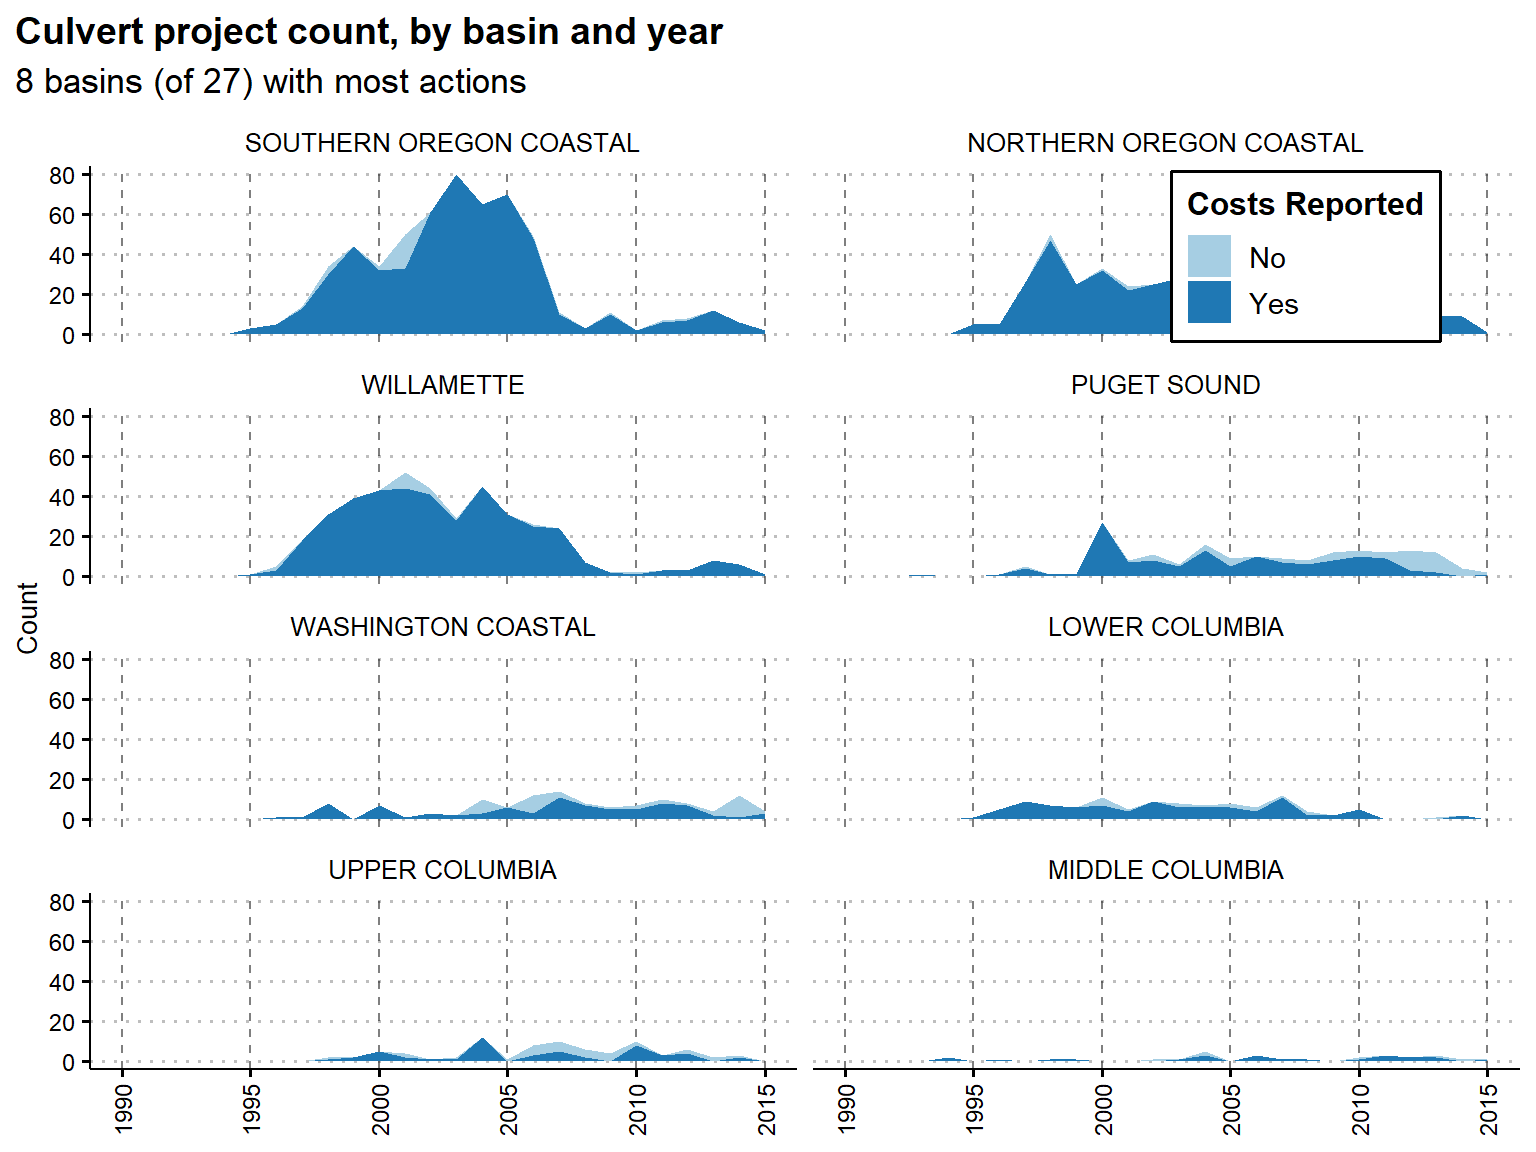
Observation: Activity increases dramatically in the late ’90s before falling off in the late ’00s.
Observation: While overall cost availability is good, costs are reported less frequently in Washington than they are in Oregon.
Observation: There have been far more culvert projects in Oregon than Washington over the years.
Observation: The activity trends are driven largely by Oregon, especially dramatic drop-offs in reports by OWRI and REO.
Observation: OWRI reports by far the most projects, and only projects in Oregon. REO is the only organization that reports projects across all eight of the basins with the most activity, though their activity is centered around Oregon as well.
Culvert Spending
Culvert Spending
Total spending on culverts by year, basin, and reporting source. Only includes spending on pure culvert projects. 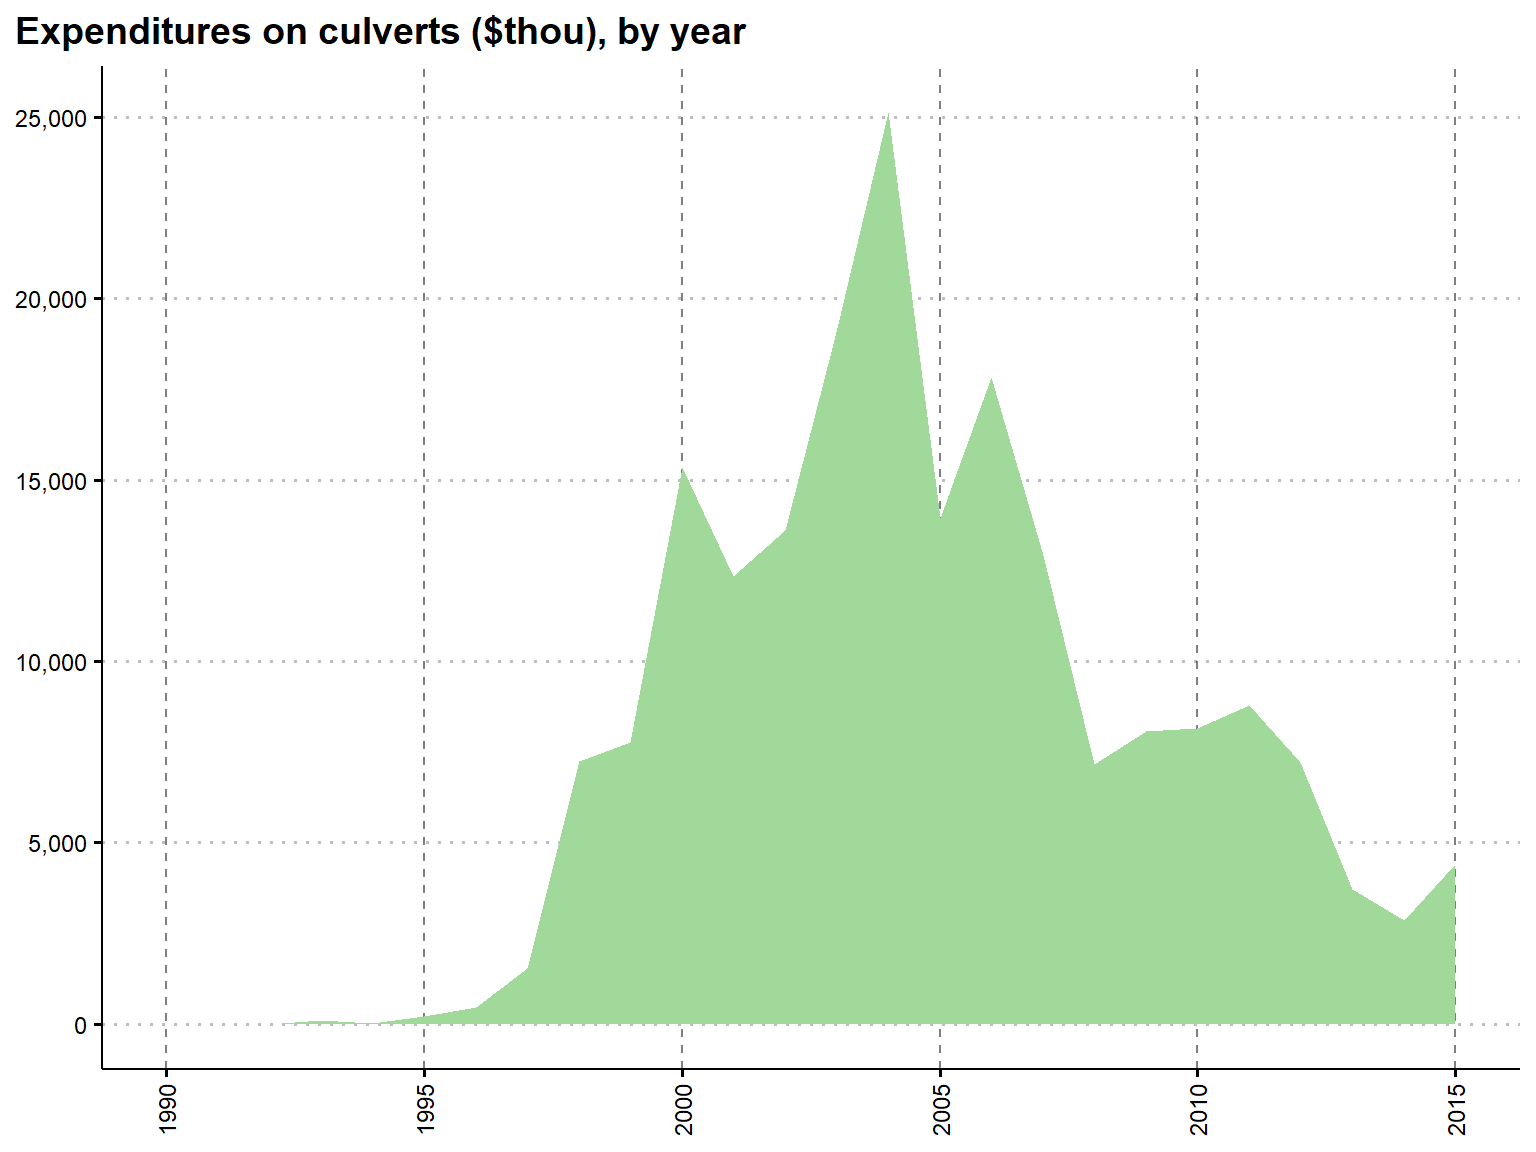
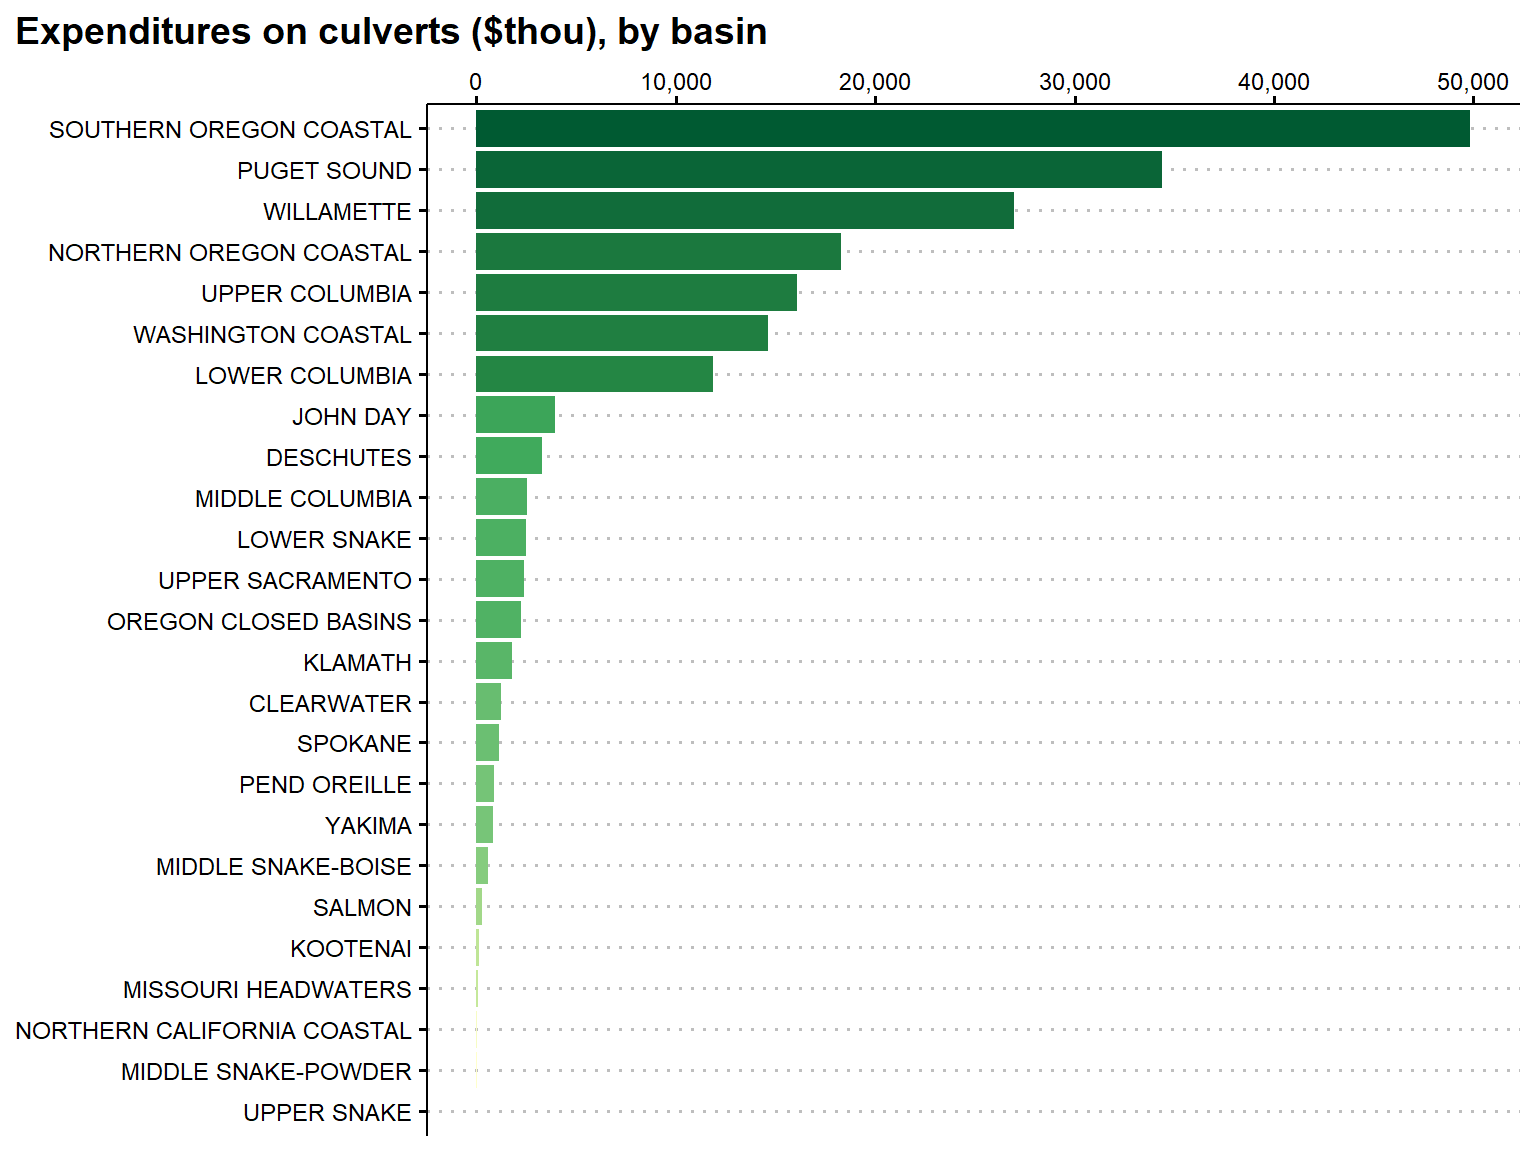
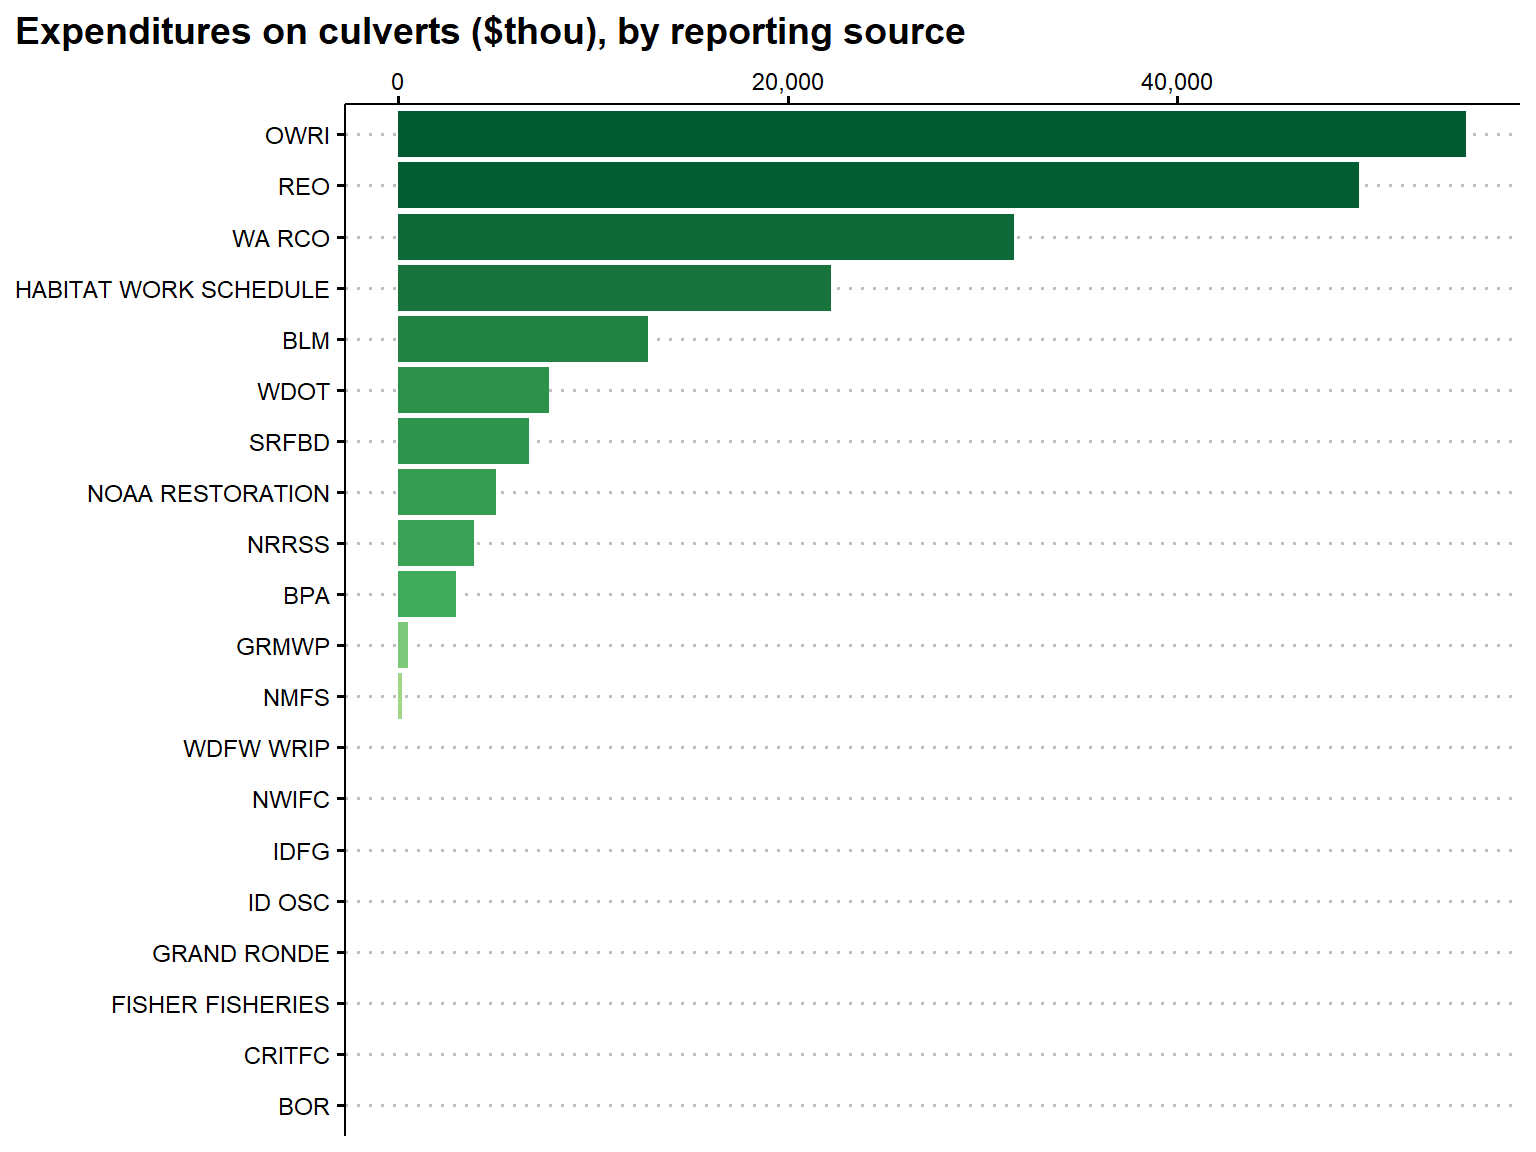
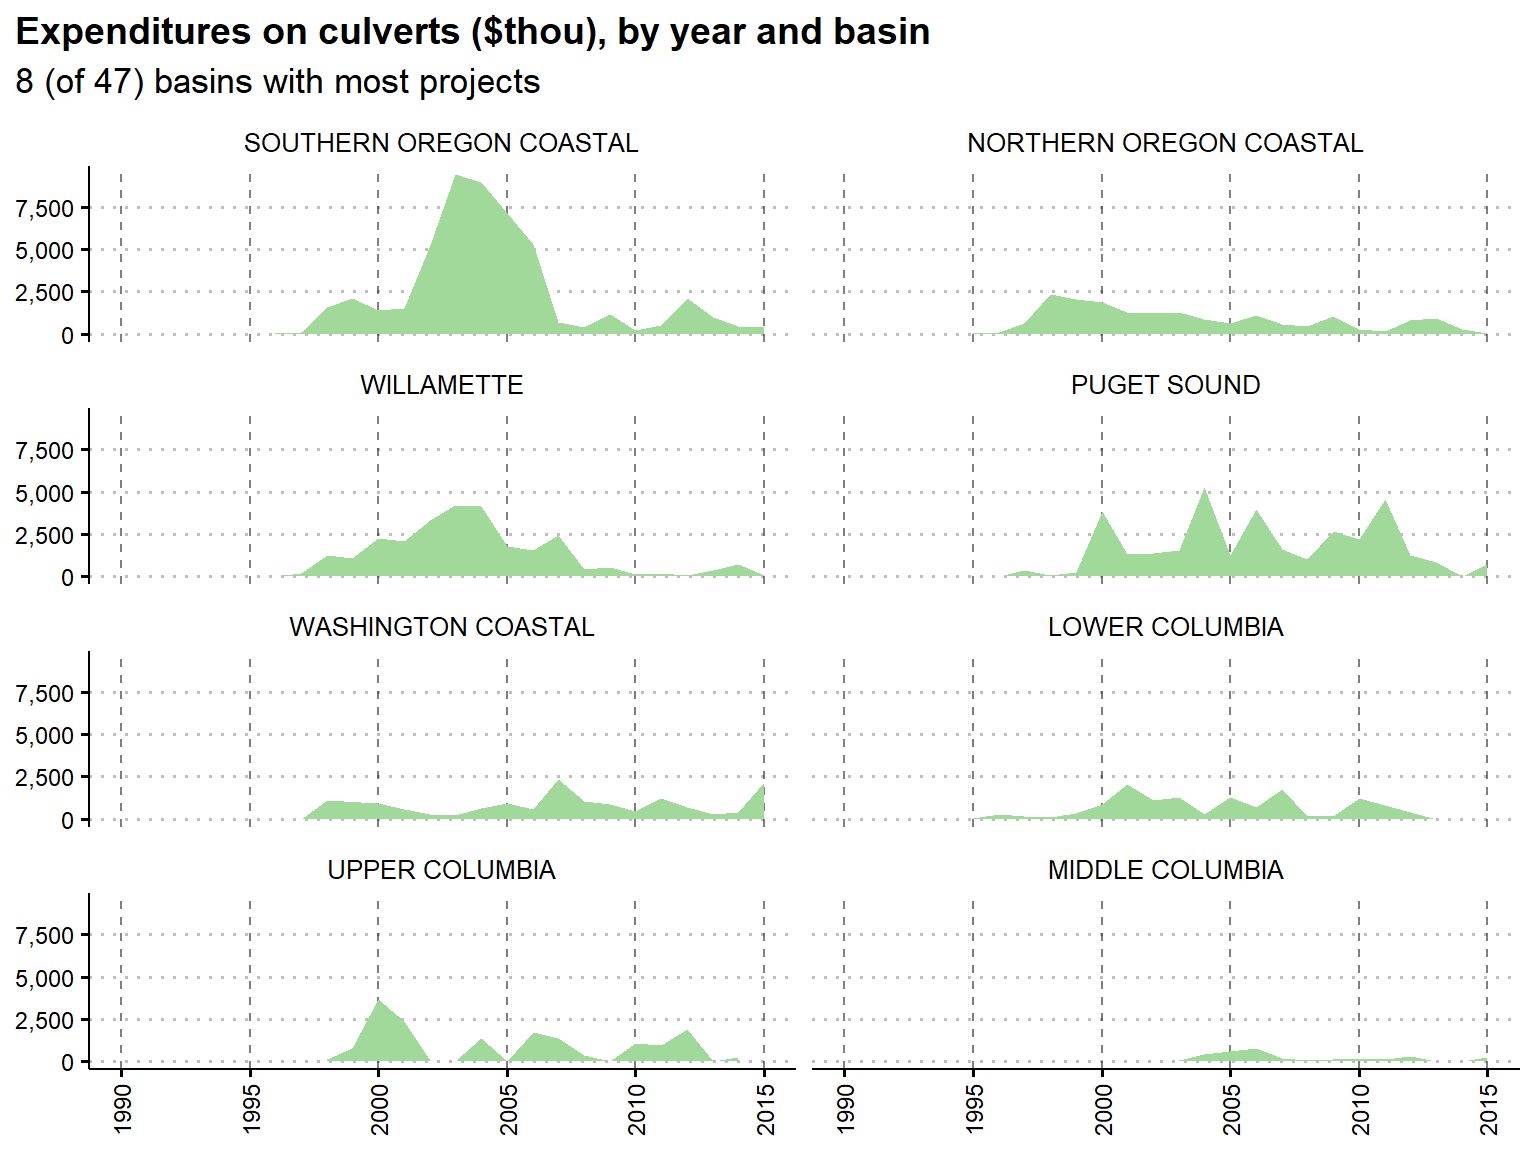
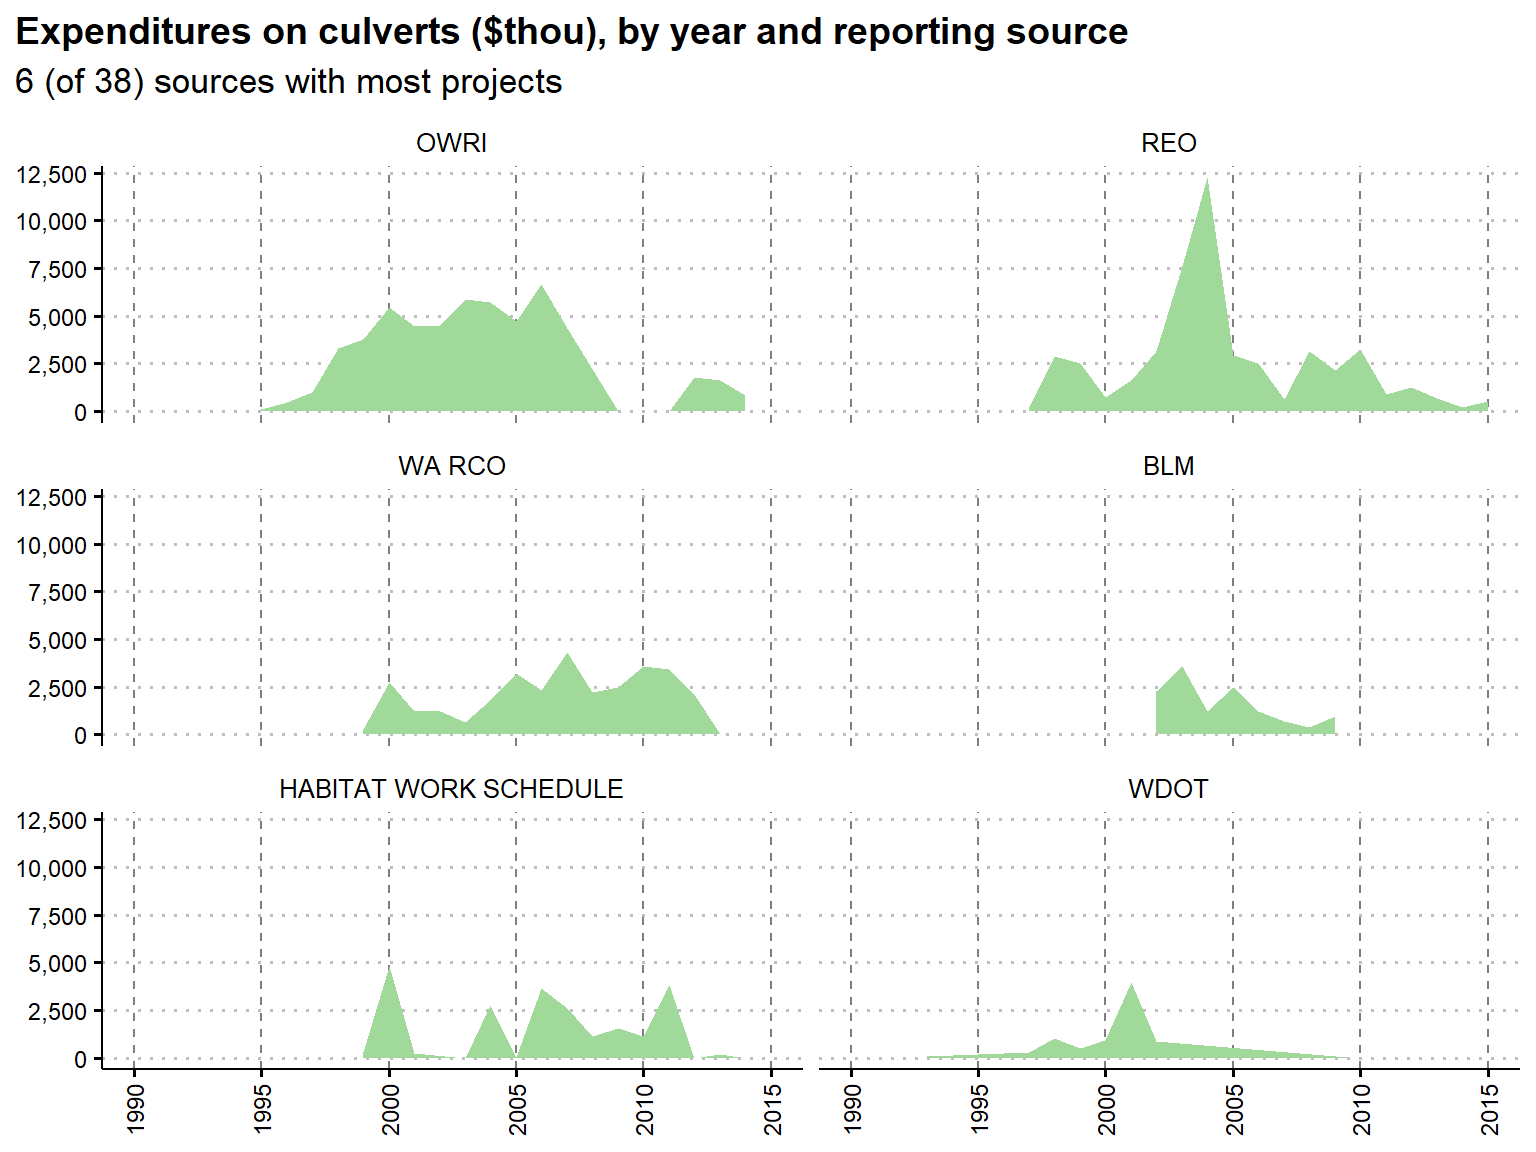
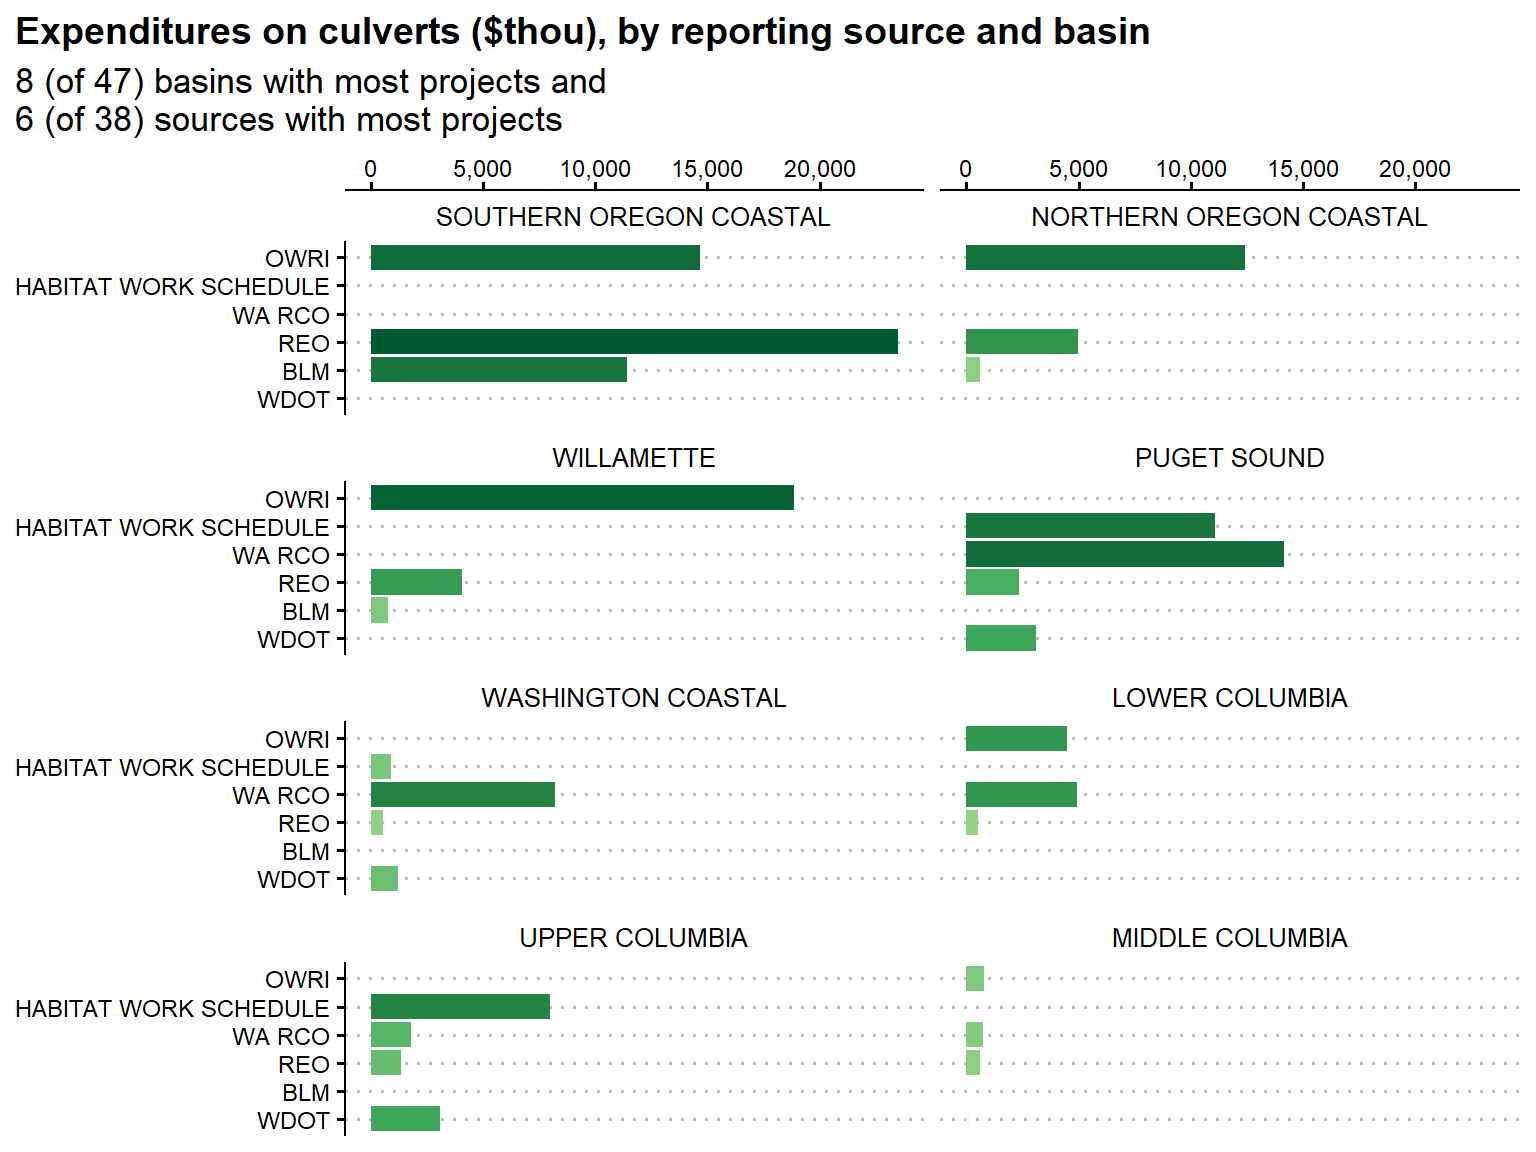
Observation: Following patterns in the number of projects, spending rose dramatically during the late ’90s before falling off to a lower level in 2007. This pattern is mostly driven by REO’s heavy investment along the southern Oregon coast in the early ’00s. The drop-off corresponds with a drop in spending by OWRI.
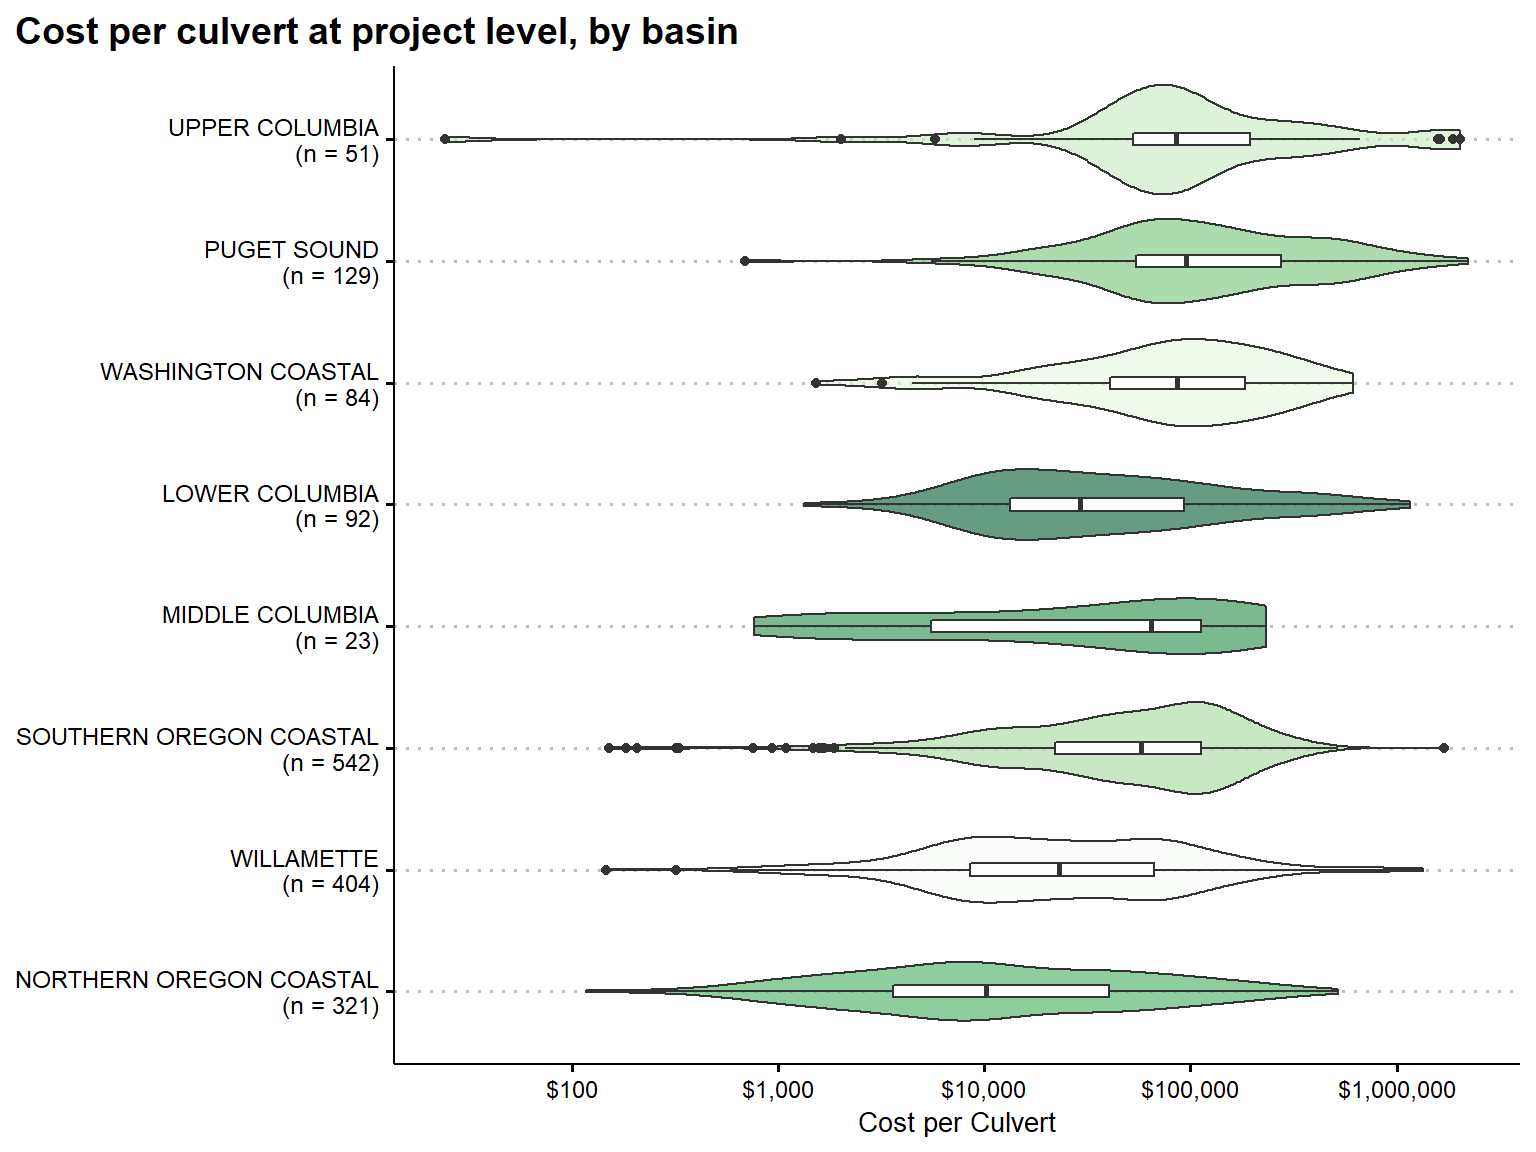
Cost per Culvert Distributions
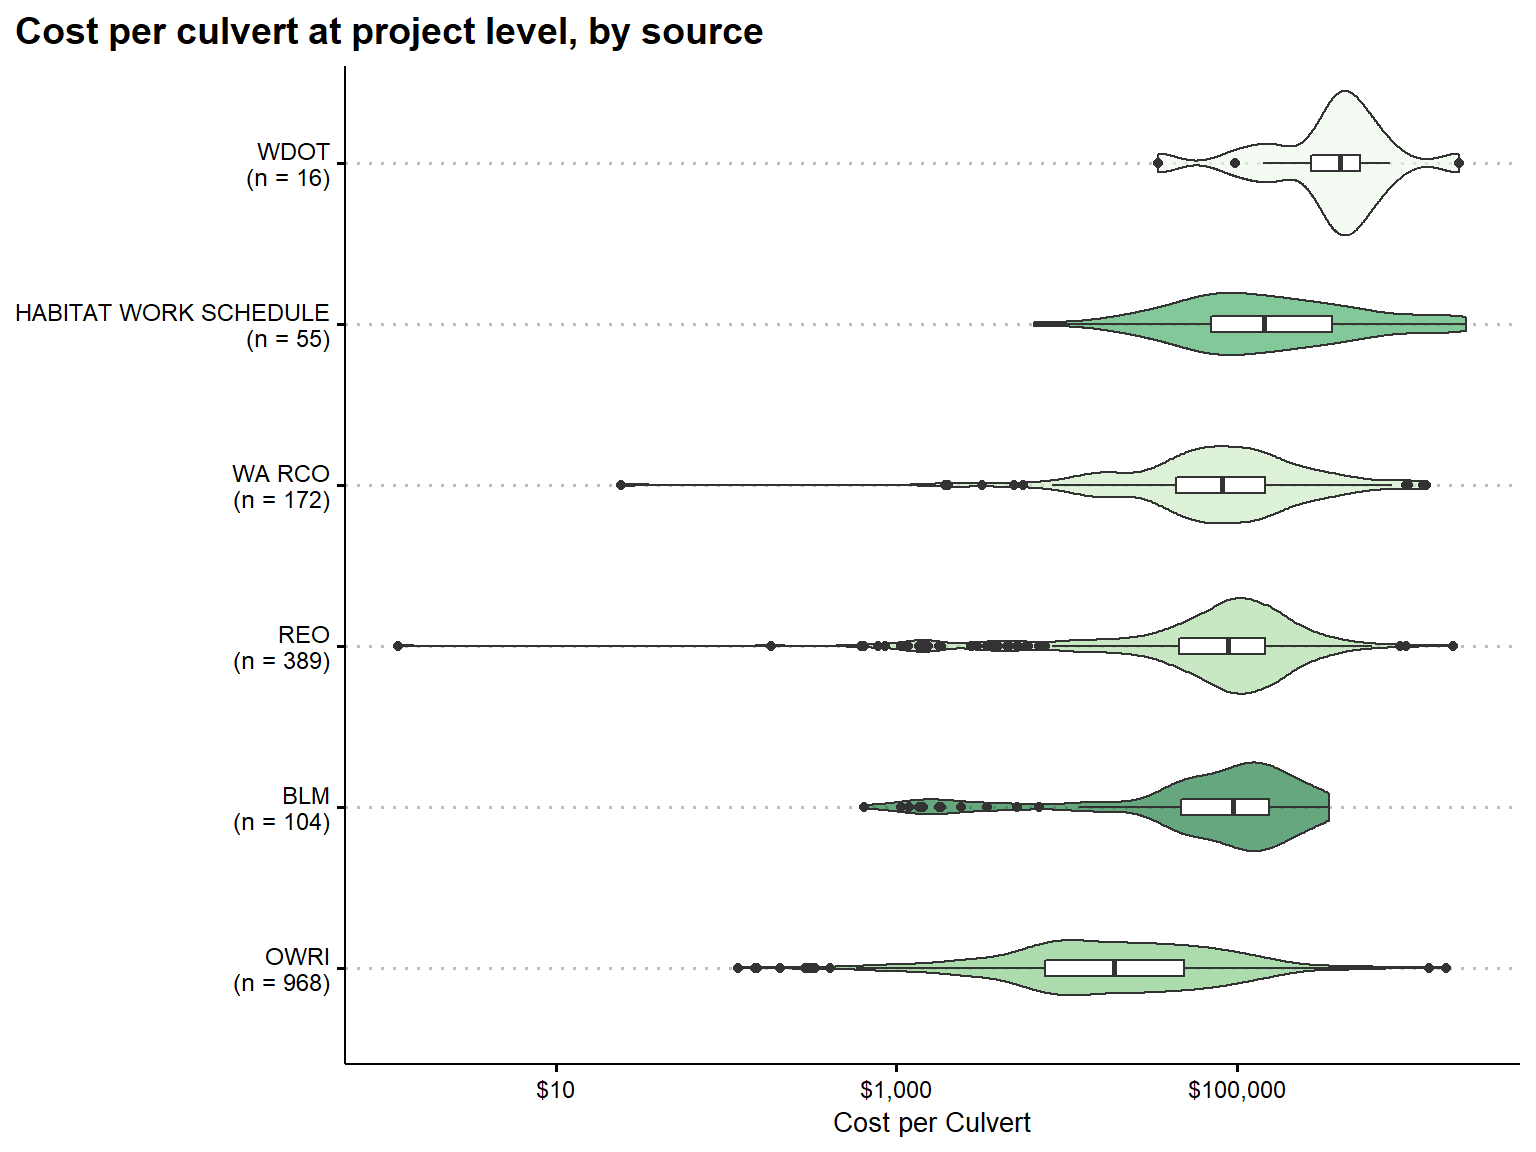
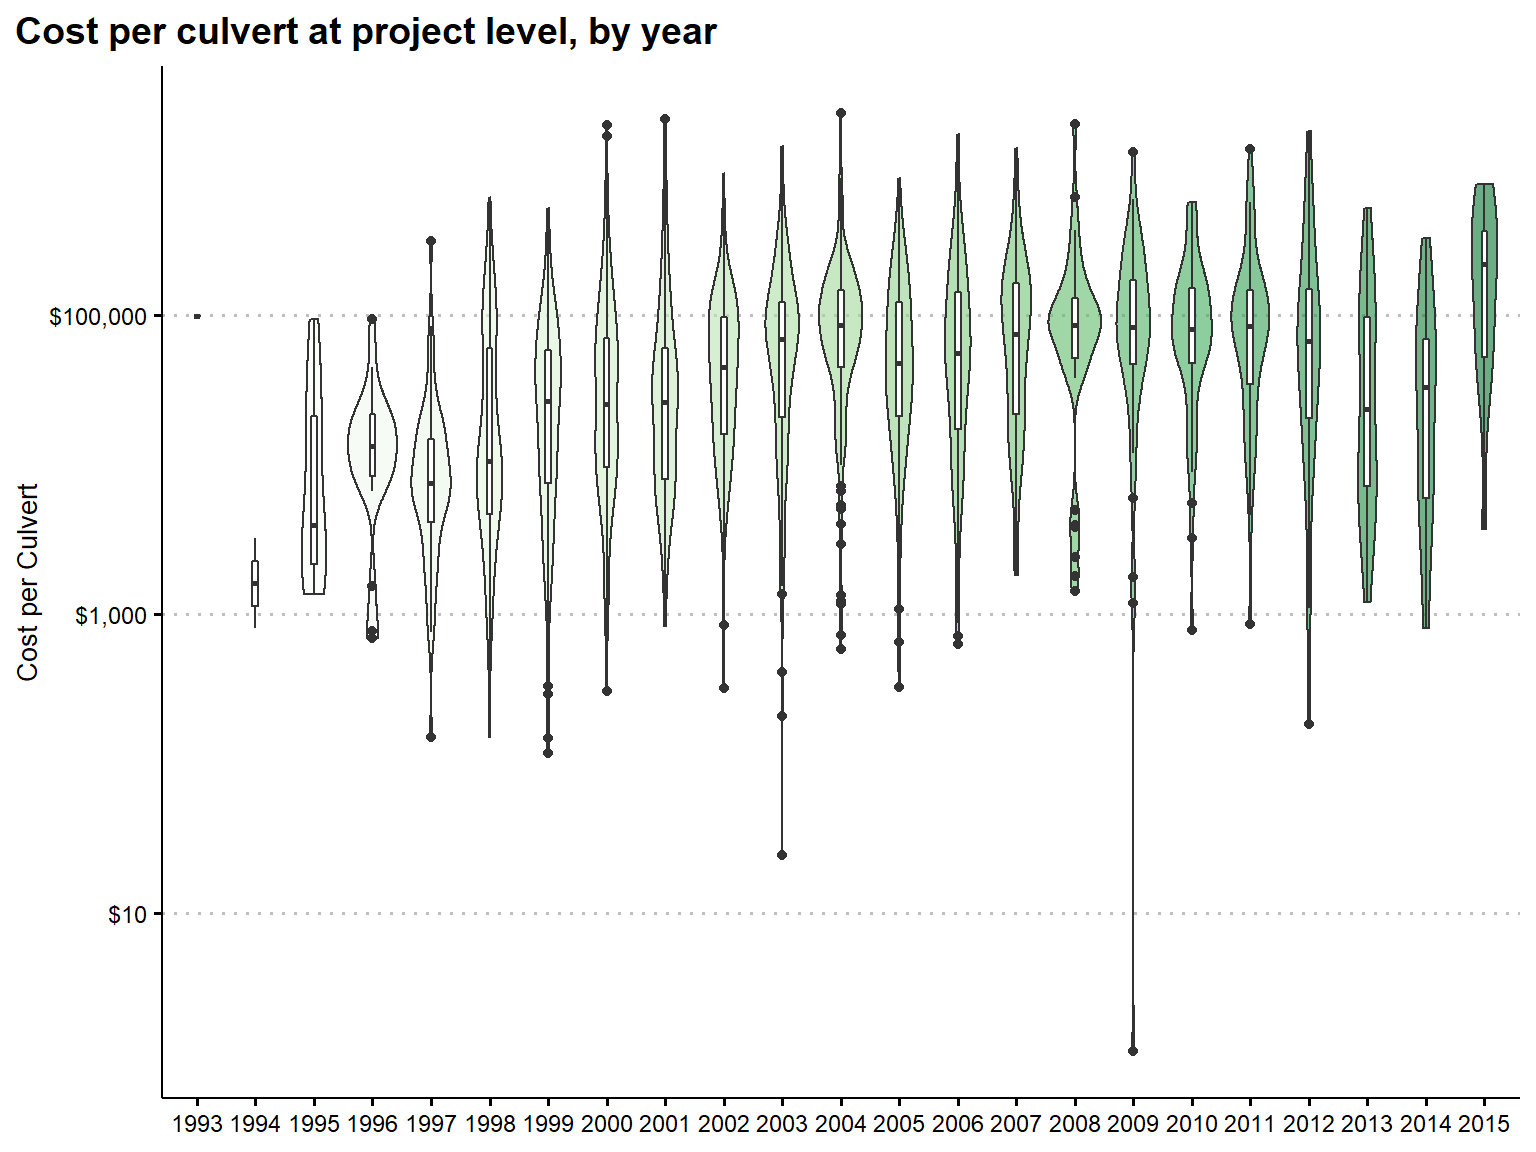
Cost per Culvert Distributions
Violin plots and box plots for project costs per culvert, on a log scale. Only includes pure culvert projects. Details on how the number of culverts is identified can be found in the appendix. 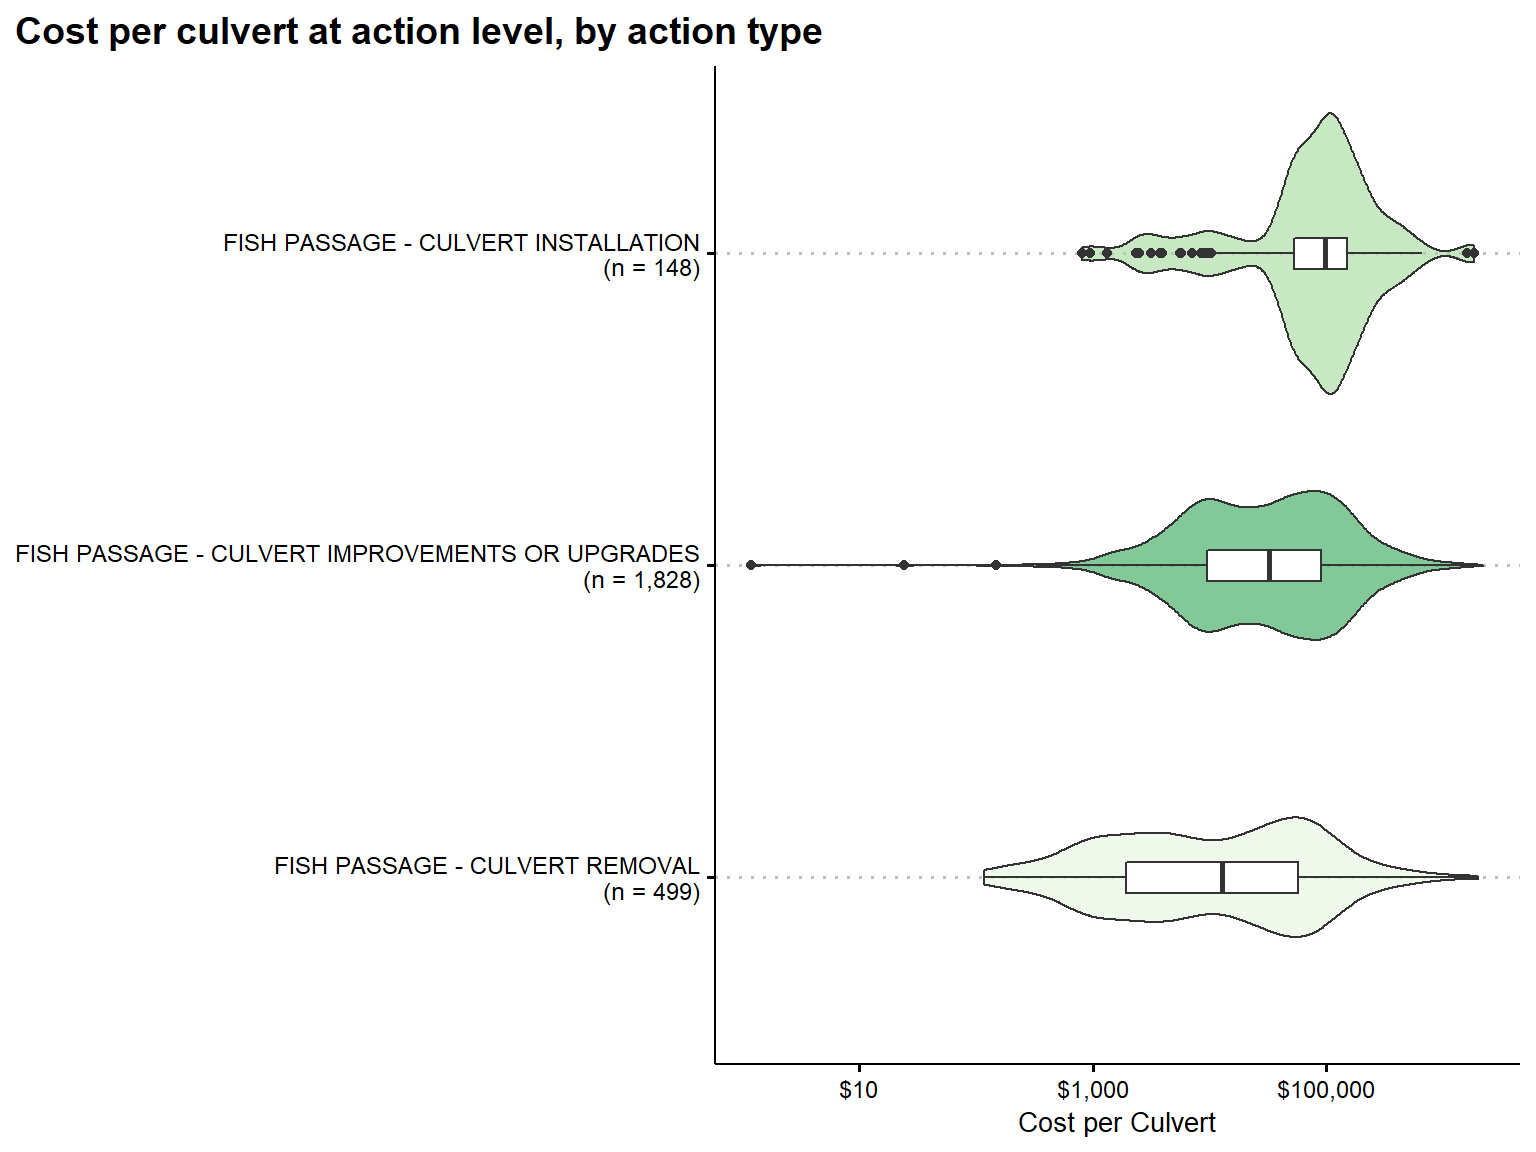
Observation: Culvert installations are the most expensive, followed by culvert upgrades and culvert removals, though with considerable overlap in the distributions.
Observation: Cost per culvert seems to be rising from 1995 through around 2004 when they flatten out. From 2008 through 2011, costs are more concentrated near the median.
Observation: There is a pretty wide range of costs across basins, but OWRI reports notably cheaper projects while WDOT’s projects are much more expensive. OWRI also reports the bulk of projects, so if their costs are systemically under-reported, then we may have a problem.
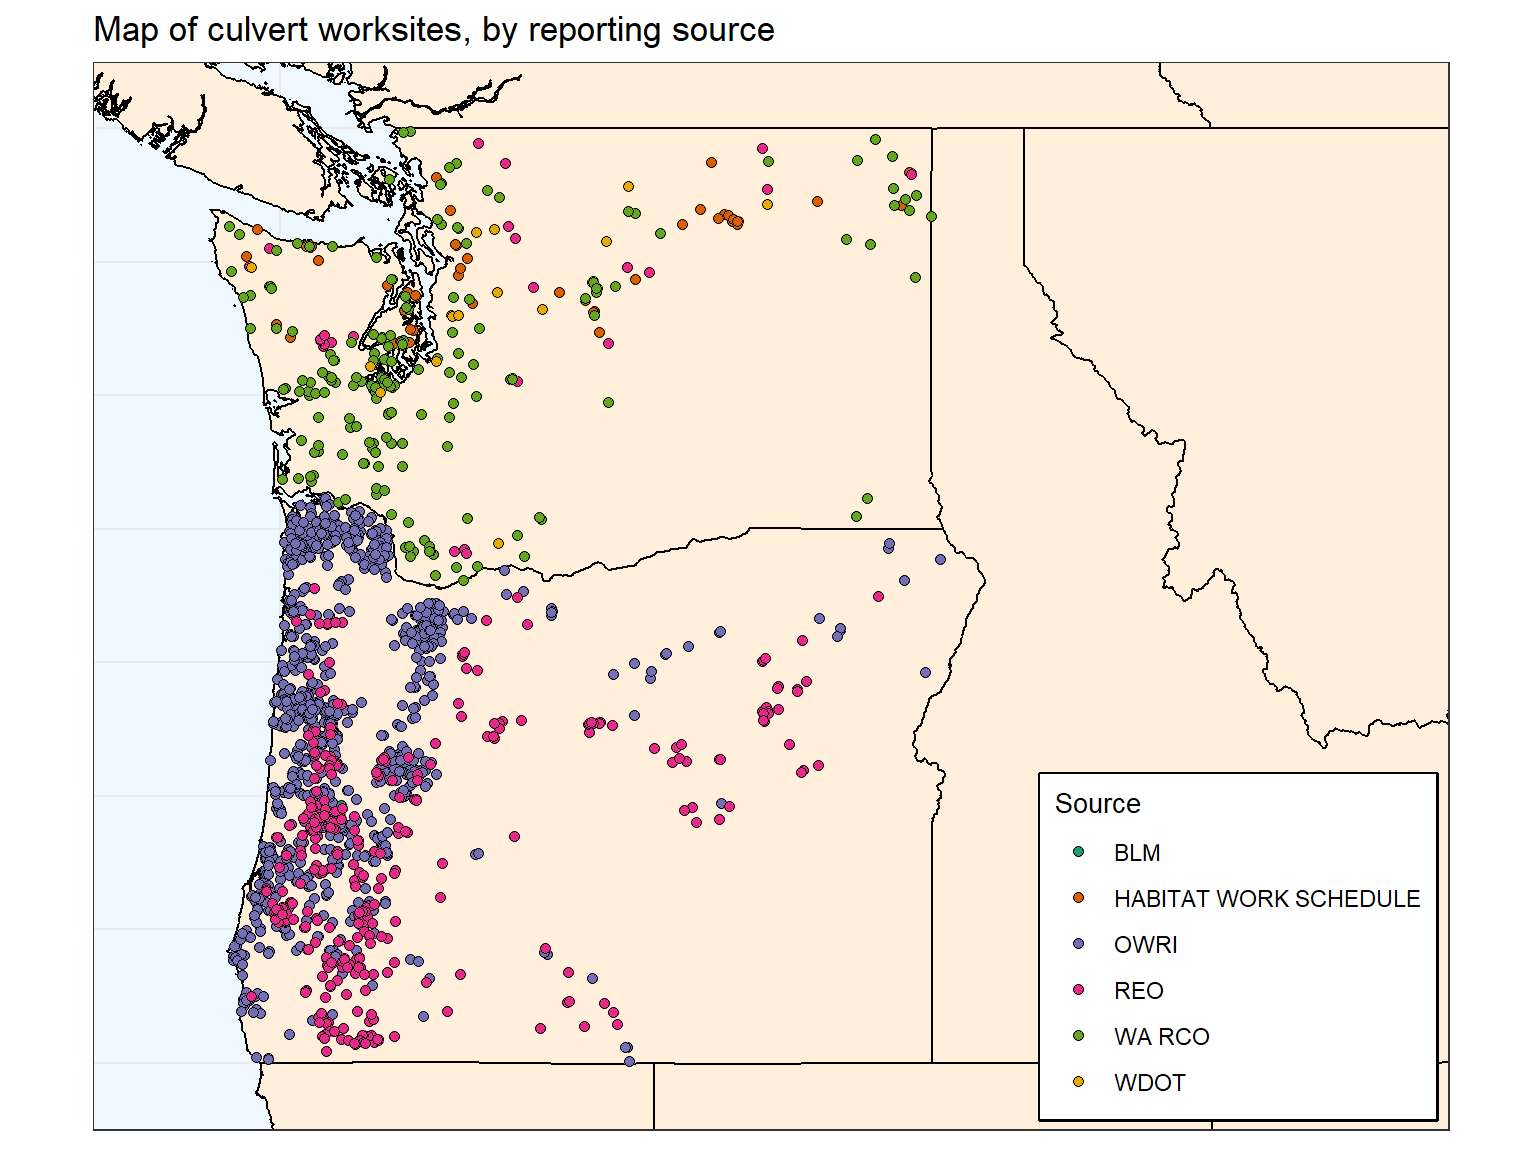
Maps
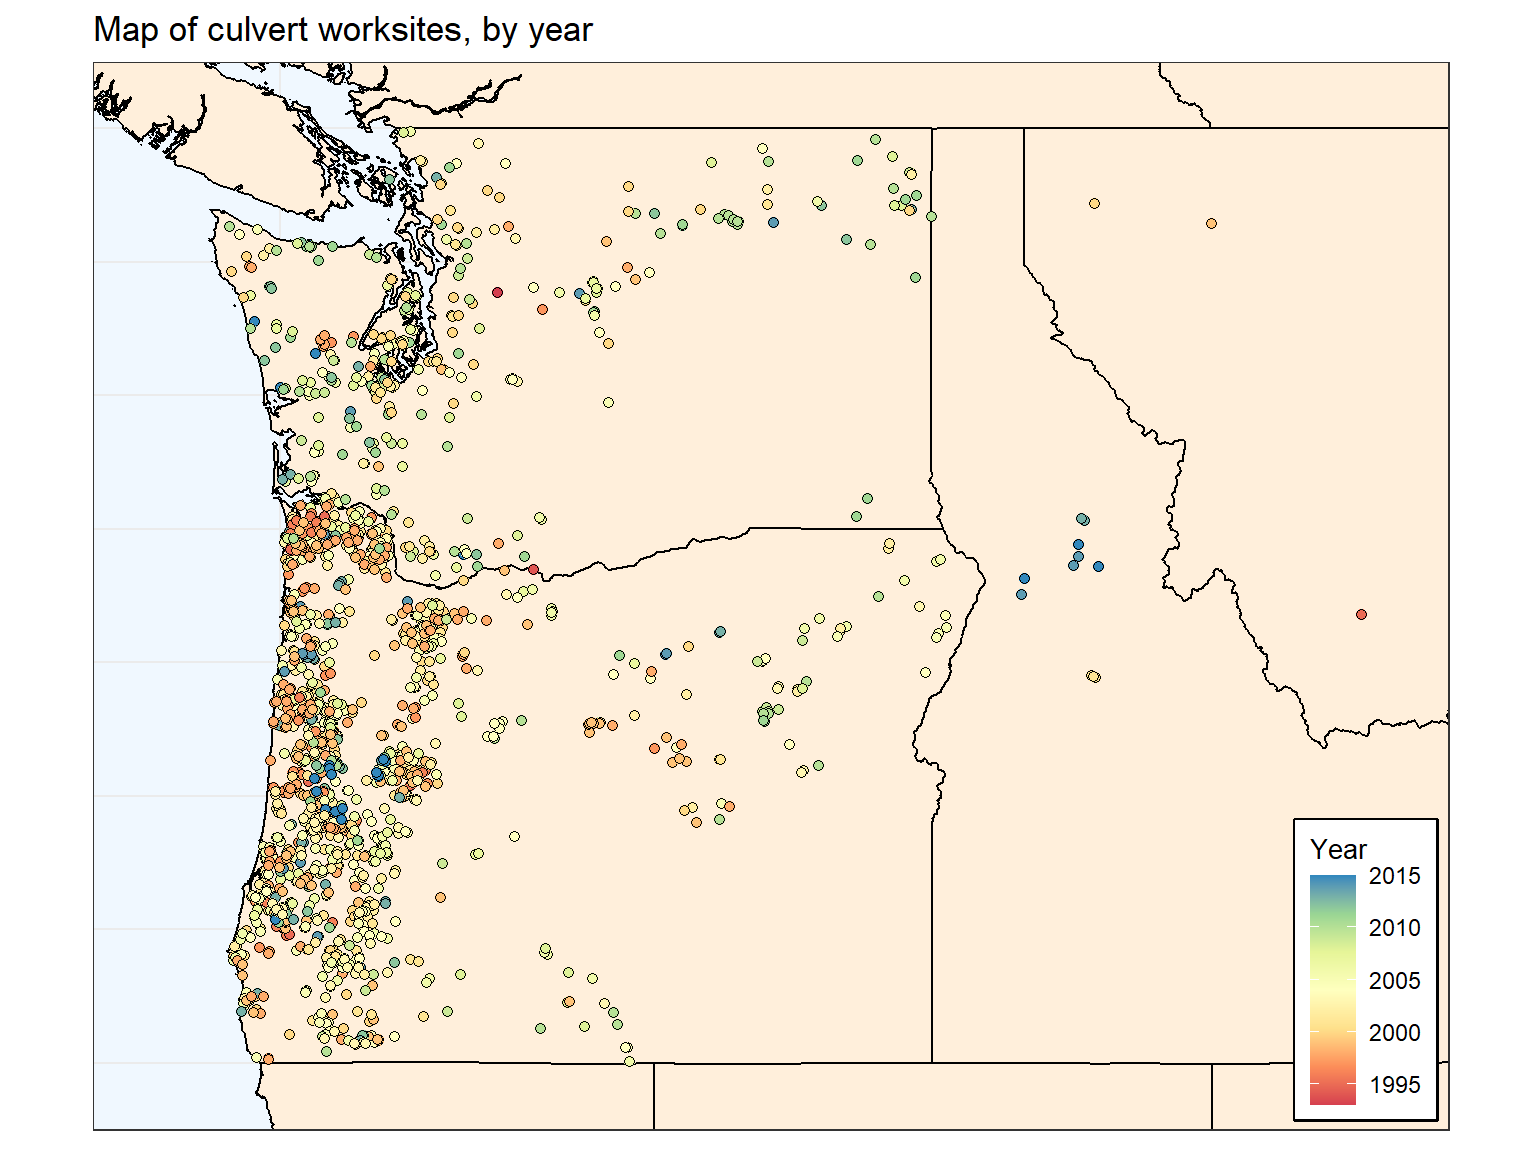
Maps
Maps show work sites associated with pure culvert projects. To trim outliers, only projects with cost per culvert above $2,000 are included. Road and river data from OpenStreetMap API.
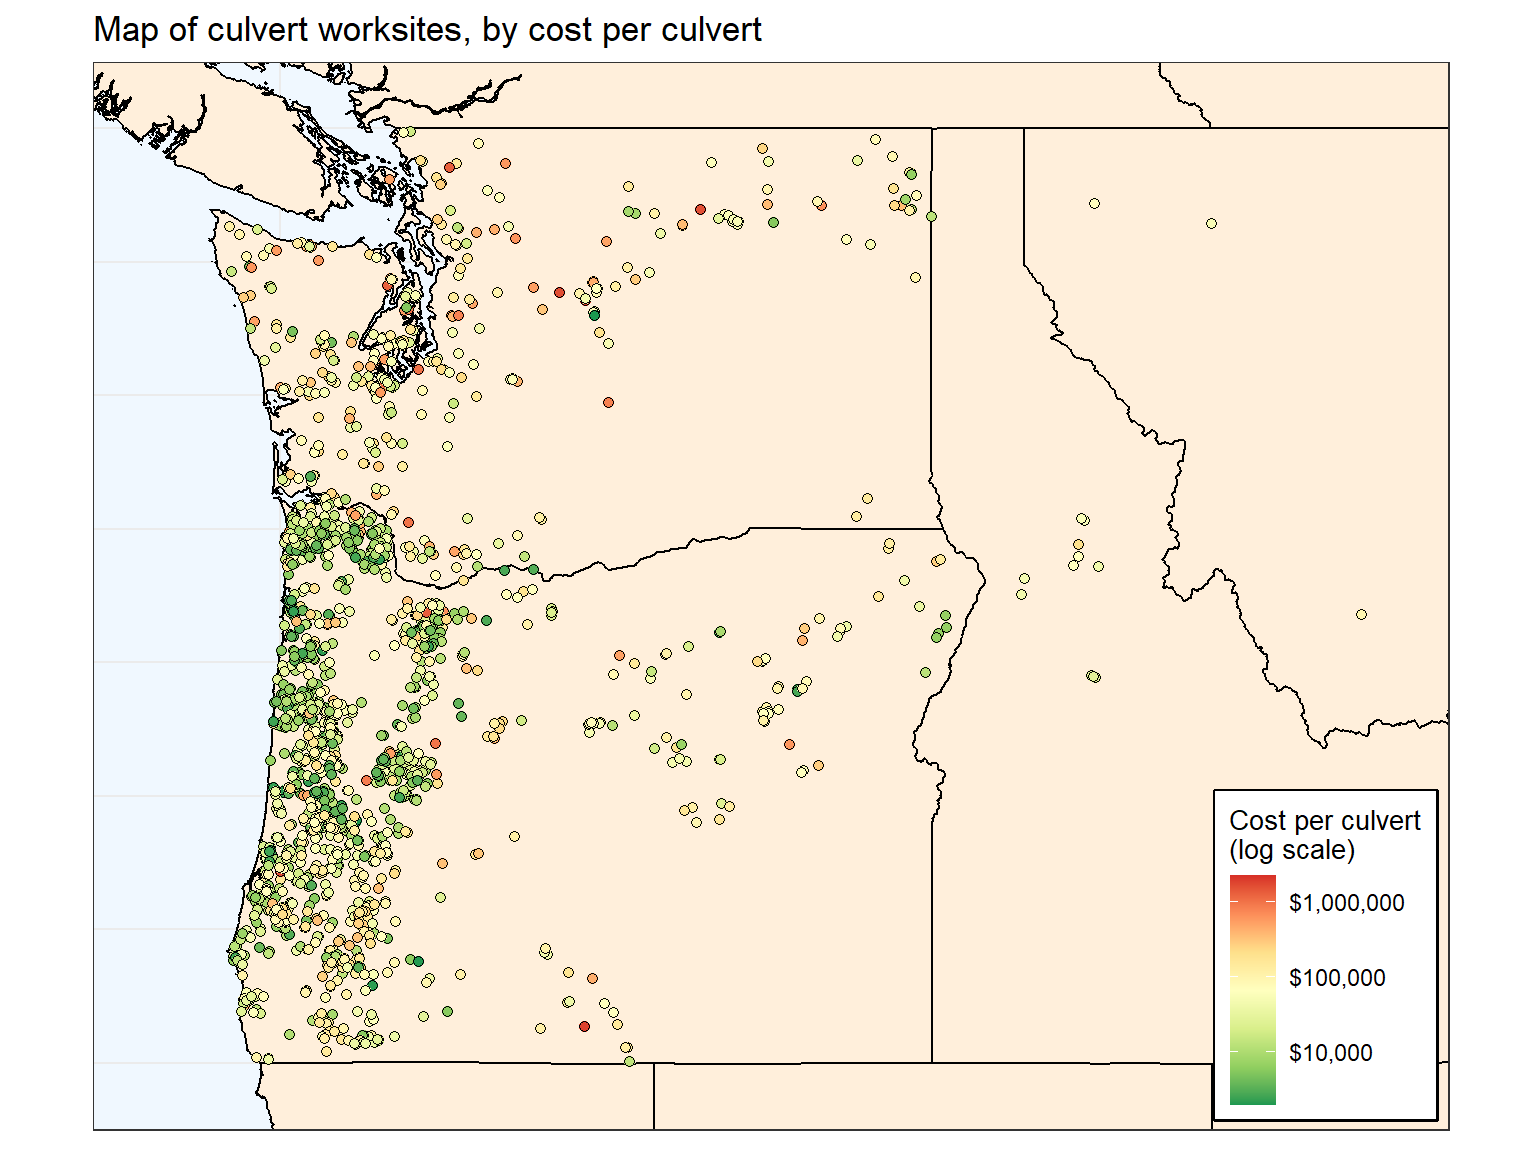
Observation: The cheapest projects are clustered along the northern Oregon coast, while the most expensive appear mostly in Washington. Projects in the middle of the distribution are well distributed across the region.
Observation: The earliest projects are clustered along the northern Oregon coast, and are also the cheapest. Washington projects tend to be more recent.
Observation: There is little geographic overlap between reporting sources, which may make mixing sources in a model difficult. Reporting source also closely corresponds with year and cost per culvert.
Outside Culvert Data
Beyond the PNSHP data, the state governments of Washington and Oregon both maintain culvert inventories. This section provides some early exploration of these inventories and how they might be used in this project.
Washington State Department of Transportation Culvert Inventory
Responsible Agency: WSDOT
Domain: Culverts on roads owned/maintained by WSDOT
Key Features: Geographic coordinates, affected species, assessment of fish passage, assessment of potential habitat gain
Access: GIS format, spreadsheet format, API available
Notes: Also available are “daughter” inventories detailing previously upgraded culverts, culverts scheduled for work, and culverts subject to the 2018 Supreme Court ruling. Lack of data on culverts on county, private, and municipal roads may limit the usefulness of this inventory for predicting benefits of specific culverts.
Links: Overview
Idea: We might be able to use land ownership and management records for areas upstream from state-owned culverts as a way to control for whether or not culverts can be “chained” together to maximize habitat access from the point of view of WSDOT.
Oregon Department of Fish and Wildlife Culvert Inventory
Responsible Agency: ODFW
Domain: Culverts maintained by Oregon Department of Transportation, as well as other government agencies, including lower-level municipalities (e.g. counties, cities)
Key Features: Geographic coordinates, assessment of fish passage, length, width, height, slope, drop
Access: GIS format only
Notes: Significantly more detailed and wide-reaching than the WSDOT inventory. ODFW claims that this is the most robust inventory of culverts in Oregon, but does not claim it is comprehensive.
Links: Overview; Viewer
Idea: We may be able to use “fuzzy matching” methods to recover additional information about culverts included in the the PNSHP data.
Idea: Once we develop a model for culvert costs, we can feed the culverts from these inventories into the model to predict costs, which can then be used to help prioritize projects.
Appendix: Source Glossary
Thirty-eight different organizations, referred to as sources, contribute data to PNSHP. Below you will find a glossary of each source code.
ASOTIN - Asotin County Conservation District (Asotin County is the southeastern-most county in Washington and contains important Snake River watersheds)
BLM - Bureau of Land Management
BOR - Bureau of Reclamation (Department of the Interior agency responsible for water storage and irrigation, including federal dams)
BPA - Bonneville Power Administration
CBFWA - Columbia Basin Fish and Wildlife Authority (Now defunct group of state, federal, and tribal agencies organized to advise BPA on habitat improvement efforts)
CHEHALIS - Chehalis Tribe (Southwestern Washington)
COLVILLE - Colville Tribe (Northeastern Washington)
COQUILLE - Coquille Tribe (Southwestern Oregon)
COWLITZ - Cowlitz Tribe (Northeastern Washington)
CRITFC - Columbia River Inter-Tribal Fisheries Commission
DUCKS UNLIMITED - Ducks Unlimited
FISHER FISHERIES - Fisher Fisheries Consultancy
GRAND RONDE - Grand Ronde Tribe (Central Western Oregon)
GRMWP - Grande Ronde Model Watershed Program (Northeastern Oregon river)
HABITAT WORK SCHEDULE - Washington State program for tracking projects by the 27 “Lead Entities”, local boards responsible for managing state salmon habitat spending ID OSC - Idaho Office of Species Conservation
IDAHODEQ - Idaho Department of Environmental Quality
IDFG - Idaho Department of Fish and Game
IDFG SCREEN SHOP - Fish screen efforts for IDFG
KRITFWC - Klamath River Inter-Tribal Fish and Water Commission (Southern Oregon river)
MONTANA WATER CENTER - Research institute based at Montana State
NMFS - NOAA Fisheries
NOAA RESTORATION - NOAA Restoration Center
NRRSS - National River Restoration Science Synthesis project (a project of American Rivers)
NWIFC - Northwest Indian Fisheries Commission
OR WATER TRUST - Oregon Water Trust
OWRI - Oregon Watershed Restoration Inventory
PCSRF - Pacific Coastal Salmon Recovery Fund (federal grant program administered by NOAA)
REO - United States Forest Service Region 6 Regional Ecosystem Office
SHOSHONE-BANNOCK - Shoshone-Bannock Tribes (Southeastern Idaho)
SRFBD - Salmon Funding Recovery Board Database (Washington State Recreation and Conservation Office grant program)
STREAMNET - Data project of the Pacific States Marine Fisheries Commission
WA DOE - Washington State Department of Ecology
WA RCO - Washington State Recreation and Conservation Office
WA WATER TRUST - Washington Water Trust
WDFW FISHWAY - Washington State Department of Fish and Wildlife (WDFW) Fishway Program
WDFW WRIP - WDFW Watershed Recovery Inventory Project
WDOT - Washington Department of Transportation
Appendix: Creating a Consistent Project-level Culvert Count
Our ultimate goal is to model the costs of culvert projects. To do this, we need a consistent count of how many culverts each project involves. While this might seem straight forward, this information is reported in a number of different ways in the PNSHP data. In most cases, we can simply count the number of actions for each project. That is, the number of culverts equals the number of culvert-related actions.
However, 354 actions (associated with 279 projects) also include a “metric” variable labelled “count of blockages”. This variable measures the number of culverts addressed by the action, at the work site, or by the project. In this section, we will cover how we identify and deal with each of these three cases.
When there is only a single action associated with a project, we can simply use the value provided in the “count of blockages” metric. The table below provides examples of the action-level data when this is the case. This accounts for 248 projects.
| project_id | worksite_id | action | metric | numeric_value | units | n_action_prj |
|---|---|---|---|---|---|---|
| WARCO_RCO_08-1982 R | WARCO_RCO_08-1982 R-WS-11647 | FISH PASSAGE - CULVERT IMPROVEMENTS OR UPGRADES | COUNT OF BLOCKAGES | 21 | COUNT | 1 |
| WARCO_RCO_07-1881 P | WARCO_RCO_07-1881 P-WS-10230 | FISH PASSAGE - CULVERT IMPROVEMENTS OR UPGRADES | COUNT OF BLOCKAGES | 123 | COUNT | 1 |
| WARCO_RCO_04-1749 R | WARCO_RCO_04-1749 R-WS-10007 | FISH PASSAGE - CULVERT IMPROVEMENTS OR UPGRADES | COUNT OF BLOCKAGES | 1 | COUNT | 1 |
| WARCO_RCO_02-1447 R | WARCO_RCO_02-1447 R-WS-1730 | FISH PASSAGE - CULVERT IMPROVEMENTS OR UPGRADES | COUNT OF BLOCKAGES | 1 | COUNT | 1 |
| WARCO_RCO_04-1626 R | WARCO_RCO_04-1626 R-WS-2646 | FISH PASSAGE - CULVERT IMPROVEMENTS OR UPGRADES | COUNT OF BLOCKAGES | 9 | COUNT | 1 |
For many of the remaining projects, the number of actions associated with the project is exactly equal to the number given by “count of blockages”. This implies that “count of blockages” is provided at the project level. When this is the case, we can ignore “count of blockages” and use the number of actions as our project-level count of culverts. The table below provides four examples for when this is the case. This accounts for 18 projects.
| project_id | worksite_id | action | metric | numeric_value | units | n_action_prj |
|---|---|---|---|---|---|---|
| REO - R_6040 | REO - R_6040-WS-1 | FISH PASSAGE - CULVERT REMOVAL | COUNT OF BLOCKAGES | 6 | COUNT | 6 |
| REO - R_6040 | REO - R_6040-WS-2 | FISH PASSAGE - CULVERT REMOVAL | COUNT OF BLOCKAGES | 6 | COUNT | 6 |
| REO - R_6040 | REO - R_6040-WS-3 | FISH PASSAGE - CULVERT REMOVAL | COUNT OF BLOCKAGES | 6 | COUNT | 6 |
| REO - R_6040 | REO - R_6040-WS-4 | FISH PASSAGE - CULVERT REMOVAL | COUNT OF BLOCKAGES | 6 | COUNT | 6 |
| REO - R_6040 | REO - R_6040-WS-5 | FISH PASSAGE - CULVERT REMOVAL | COUNT OF BLOCKAGES | 6 | COUNT | 6 |
| REO - R_6040 | REO - R_6040-WS-6 | FISH PASSAGE - CULVERT REMOVAL | COUNT OF BLOCKAGES | 6 | COUNT | 6 |
| HWS - HWS_1893 | HWS - HWS_1893-WS-1 | FISH PASSAGE - CULVERT IMPROVEMENTS OR UPGRADES | COUNT OF BLOCKAGES | 3 | COUNT | 3 |
| HWS - HWS_1893 | HWS - HWS_1893-WS-2 | FISH PASSAGE - CULVERT IMPROVEMENTS OR UPGRADES | COUNT OF BLOCKAGES | 3 | COUNT | 3 |
| HWS - HWS_1893 | HWS - HWS_1893-WS-3 | FISH PASSAGE - CULVERT IMPROVEMENTS OR UPGRADES | COUNT OF BLOCKAGES | 3 | COUNT | 3 |
| HWS - HWS_11151 | HWS - HWS_11151-WS-1 | FISH PASSAGE - CULVERT IMPROVEMENTS OR UPGRADES | COUNT OF BLOCKAGES | 2 | COUNT | 2 |
| HWS - HWS_11151 | HWS - HWS_11151-WS-2 | FISH PASSAGE - CULVERT IMPROVEMENTS OR UPGRADES | COUNT OF BLOCKAGES | 2 | COUNT | 2 |
| WARCO_RCO_00-1899 R | WARCO_RCO_00-1899 R-WS-884 | FISH PASSAGE - CULVERT IMPROVEMENTS OR UPGRADES | COUNT OF BLOCKAGES | 2 | COUNT | 2 |
| WARCO_RCO_00-1899 R | WARCO_RCO_00-1899 R-WS-884 | FISH PASSAGE - CULVERT REMOVAL | COUNT OF BLOCKAGES | 2 | COUNT | 2 |
In the third class of projects where “count of blockages” appears, each project has multiple work sites with a single action where the “count of blockages” variable is equal to one in all cases. This case can be identified by isolating rows where the count of blockages is equal to one while the number of actions exactly equals the number of at the project level. Some examples are provided below. In this scenario, we can use the number of actions as the number of culverts. This class accounts for 11 projects.
| project_id | worksite_id | action | metric | numeric_value | units | n_action_prj | n_worksites |
|---|---|---|---|---|---|---|---|
| HWS - HWS_11099 | HWS - HWS_11099-WS-1 | FISH PASSAGE - CULVERT IMPROVEMENTS OR UPGRADES | COUNT OF BLOCKAGES | 1 | COUNT | 2 | 2 |
| HWS - HWS_11099 | HWS - HWS_11099-WS-2 | FISH PASSAGE - CULVERT IMPROVEMENTS OR UPGRADES | COUNT OF BLOCKAGES | 1 | COUNT | 2 | 2 |
| HWS - HWS_16458 | HWS - HWS_16458-WS-1 | FISH PASSAGE - CULVERT IMPROVEMENTS OR UPGRADES | COUNT OF BLOCKAGES | 1 | COUNT | 7 | 7 |
| HWS - HWS_16458 | HWS - HWS_16458-WS-2 | FISH PASSAGE - CULVERT IMPROVEMENTS OR UPGRADES | COUNT OF BLOCKAGES | 1 | COUNT | 7 | 7 |
| HWS - HWS_16458 | HWS - HWS_16458-WS-5 | FISH PASSAGE - CULVERT IMPROVEMENTS OR UPGRADES | COUNT OF BLOCKAGES | 1 | COUNT | 7 | 7 |
| HWS - HWS_16458 | HWS - HWS_16458-WS-6 | FISH PASSAGE - CULVERT IMPROVEMENTS OR UPGRADES | COUNT OF BLOCKAGES | 1 | COUNT | 7 | 7 |
| HWS - HWS_16458 | HWS - HWS_16458-WS-7 | FISH PASSAGE - CULVERT IMPROVEMENTS OR UPGRADES | COUNT OF BLOCKAGES | 1 | COUNT | 7 | 7 |
| HWS - HWS_16458 | HWS - HWS_16458-WS-8 | FISH PASSAGE - CULVERT IMPROVEMENTS OR UPGRADES | COUNT OF BLOCKAGES | 1 | COUNT | 7 | 7 |
| HWS - HWS_9725 | HWS - HWS_9725-WS-1 | FISH PASSAGE - CULVERT INSTALLATION | COUNT OF BLOCKAGES | 1 | COUNT | 2 | 2 |
| HWS - HWS_9725 | HWS - HWS_9725-WS-2 | FISH PASSAGE - CULVERT INSTALLATION | COUNT OF BLOCKAGES | 1 | COUNT | 2 | 2 |
| REO - R_5721 | REO - R_5721-WS-1 | FISH PASSAGE - CULVERT IMPROVEMENTS OR UPGRADES | COUNT OF BLOCKAGES | 1 | COUNT | 4 | 4 |
| REO - R_5721 | REO - R_5721-WS-2 | FISH PASSAGE - CULVERT IMPROVEMENTS OR UPGRADES | COUNT OF BLOCKAGES | 1 | COUNT | 4 | 4 |
| REO - R_5721 | REO - R_5721-WS-3 | FISH PASSAGE - CULVERT IMPROVEMENTS OR UPGRADES | COUNT OF BLOCKAGES | 1 | COUNT | 4 | 4 |
| REO - R_5721 | REO - R_5721-WS-4 | FISH PASSAGE - CULVERT IMPROVEMENTS OR UPGRADES | COUNT OF BLOCKAGES | 1 | COUNT | 4 | 4 |
Finally, there are a number of edge cases where one of the actions for a multiple action project has a “count of blockages” variable provided, but the other actions for the project do not, with no metric provided. For some of these projects, the single instance for “count of blockages” is equal to the number of work sites, which implies that this single “count of blockages” is likely provided at the project level. For others, the count given is one but multiple work sites are present. In either case, it should be safe to use the number of work sites as the count of culverts. Examples of these situations are provided below.
| project_id | worksite_id | action | metric | numeric_value | units | n_worksites |
|---|---|---|---|---|---|---|
| OWRI - OR_20140386 | OWRI - OR_20140386-WS-1 | FISH PASSAGE - CULVERT REMOVAL | COUNT OF BLOCKAGES | 1 | COUNT | 3 |
| OWRI - OR_20140386 | OWRI - OR_20140386-WS-2 | FISH PASSAGE - CULVERT REMOVAL | NA | NA | NA | 3 |
| OWRI - OR_20140386 | OWRI - OR_20140386-WS-3 | FISH PASSAGE - CULVERT REMOVAL | NA | NA | NA | 3 |
| WARCO_RCO_04-1020 R | WARCO_RCO_04-1020 R-WS-2164 | FISH PASSAGE - CULVERT IMPROVEMENTS OR UPGRADES | COUNT OF BLOCKAGES | 2 | COUNT | 2 |
| WARCO_RCO_04-1020 R | WARCO_RCO_04-1020 R-WS-2165 | FISH PASSAGE - CULVERT IMPROVEMENTS OR UPGRADES | NA | NA | NA | 2 |
| WARCO_RCO_99-1433 R | WARCO_RCO_99-1433 R-WS-8708 | FISH PASSAGE - CULVERT REMOVAL | COUNT OF BLOCKAGES | 1 | COUNT | 2 |
| WARCO_RCO_99-1433 R | WARCO_RCO_99-1433 R-WS-8709 | FISH PASSAGE - CULVERT REMOVAL | NA | NA | NA | 2 |
Ultimately, there are only six projects remaining after these cases are accounted for. For these six projects, the number of culverts is ambiguous. The number provided in “count of blockages” is either larger or smaller than the number of work sites at the project level. It is unclear how many culverts were worked on for these projects, so we drop them and move along.
End Matter
[1] "2021-03-15 13:29:48 PDT"R version 4.0.2 (2020-06-22)
Platform: x86_64-w64-mingw32/x64 (64-bit)
Running under: Windows 10 x64 (build 19041)
Matrix products: default
locale:
[1] LC_COLLATE=English_United States.1252
[2] LC_CTYPE=English_United States.1252
[3] LC_MONETARY=English_United States.1252
[4] LC_NUMERIC=C
[5] LC_TIME=English_United States.1252
attached base packages:
[1] stats graphics grDevices utils datasets methods base
other attached packages:
[1] here_0.1 xtable_1.8-4 kableExtra_1.1.0
[4] knitr_1.29 searchable_0.3.3.1 scales_1.1.1
[7] ggthemes_4.2.0 janitor_2.0.1 forcats_0.5.0
[10] stringr_1.4.0 dplyr_1.0.1 purrr_0.3.4
[13] readr_1.3.1 tidyr_1.1.1 tibble_3.0.4
[16] tidyverse_1.3.0 raster_3.3-13 sp_1.4-4
[19] osmdata_0.1.3 sf_0.9-5 rnaturalearthdata_0.1.0
[22] rnaturalearth_0.1.0 ggmap_3.0.0.902 ggplot2_3.3.2
[25] workflowr_1.6.2
loaded via a namespace (and not attached):
[1] bitops_1.0-6 fs_1.4.2 lubridate_1.7.9
[4] RColorBrewer_1.1-2 webshot_0.5.2 httr_1.4.2
[7] rprojroot_1.3-2 tools_4.0.2 backports_1.1.8
[10] rgdal_1.5-16 R6_2.4.1 KernSmooth_2.23-17
[13] rgeos_0.5-3 DBI_1.1.0 colorspace_1.4-1
[16] withr_2.2.0 tidyselect_1.1.0 curl_4.3
[19] compiler_4.0.2 git2r_0.27.1 cli_2.1.0
[22] rvest_0.3.6 xml2_1.3.2 labeling_0.3
[25] classInt_0.4-3 digest_0.6.25 rmarkdown_2.3
[28] jpeg_0.1-8.1 pkgconfig_2.0.3 htmltools_0.5.0
[31] highr_0.8 dbplyr_1.4.4 rlang_0.4.8
[34] readxl_1.3.1 rstudioapi_0.11 farver_2.0.3
[37] generics_0.0.2 jsonlite_1.7.1 magrittr_1.5
[40] Rcpp_1.0.5 munsell_0.5.0 fansi_0.4.1
[43] lifecycle_0.2.0 stringi_1.4.6 yaml_2.2.1
[46] snakecase_0.11.0 plyr_1.8.6 grid_4.0.2
[49] blob_1.2.1 promises_1.1.1 crayon_1.3.4
[52] lattice_0.20-41 haven_2.3.1 hms_0.5.3
[55] ps_1.3.3 pillar_1.4.6 rjson_0.2.20
[58] codetools_0.2-16 reprex_0.3.0 glue_1.4.2
[61] evaluate_0.14 modelr_0.1.8 png_0.1-7
[64] vctrs_0.3.4 httpuv_1.5.4 RgoogleMaps_1.4.5.3
[67] cellranger_1.1.0 gtable_0.3.0 assertthat_0.2.1
[70] xfun_0.16 broom_0.7.0 e1071_1.7-3
[73] later_1.1.0.1 class_7.3-17 viridisLite_0.3.0
[76] units_0.6-7 ellipsis_0.3.1
R version 4.0.2 (2020-06-22)
Platform: x86_64-w64-mingw32/x64 (64-bit)
Running under: Windows 10 x64 (build 19041)

Matrix products: default

locale:
[1] LC_COLLATE=English_United States.1252
[2] LC_CTYPE=English_United States.1252
[3] LC_MONETARY=English_United States.1252
[4] LC_NUMERIC=C
[5] LC_TIME=English_United States.1252

attached base packages:
[1] stats     graphics  grDevices utils     datasets  methods   base

other attached packages:
 [1] here_0.1                xtable_1.8-4            kableExtra_1.1.0
 [4] knitr_1.29              searchable_0.3.3.1      scales_1.1.1
 [7] ggthemes_4.2.0          janitor_2.0.1           forcats_0.5.0
[10] stringr_1.4.0           dplyr_1.0.1             purrr_0.3.4
[13] readr_1.3.1             tidyr_1.1.1             tibble_3.0.4
[16] tidyverse_1.3.0         raster_3.3-13           sp_1.4-4
[19] osmdata_0.1.3           sf_0.9-5                rnaturalearthdata_0.1.0
[22] rnaturalearth_0.1.0     ggmap_3.0.0.902         ggplot2_3.3.2
[25] workflowr_1.6.2

loaded via a namespace (and not attached):
 [1] bitops_1.0-6        fs_1.4.2            lubridate_1.7.9
 [4] RColorBrewer_1.1-2  webshot_0.5.2       httr_1.4.2
 [7] rprojroot_1.3-2     tools_4.0.2         backports_1.1.8
[10] rgdal_1.5-16        R6_2.4.1            KernSmooth_2.23-17
[13] rgeos_0.5-3         DBI_1.1.0           colorspace_1.4-1
[16] withr_2.2.0         tidyselect_1.1.0    curl_4.3
[19] compiler_4.0.2      git2r_0.27.1        cli_2.1.0
[22] rvest_0.3.6         xml2_1.3.2          labeling_0.3
[25] classInt_0.4-3      digest_0.6.25       rmarkdown_2.3
[28] jpeg_0.1-8.1        pkgconfig_2.0.3     htmltools_0.5.0
[31] highr_0.8           dbplyr_1.4.4        rlang_0.4.8
[34] readxl_1.3.1        rstudioapi_0.11     farver_2.0.3
[37] generics_0.0.2      jsonlite_1.7.1      magrittr_1.5
[40] Rcpp_1.0.5          munsell_0.5.0       fansi_0.4.1
[43] lifecycle_0.2.0     stringi_1.4.6       yaml_2.2.1
[46] snakecase_0.11.0    plyr_1.8.6          grid_4.0.2
[49] blob_1.2.1          promises_1.1.1      crayon_1.3.4
[52] lattice_0.20-41     haven_2.3.1         hms_0.5.3
[55] ps_1.3.3            pillar_1.4.6        rjson_0.2.20
[58] codetools_0.2-16    reprex_0.3.0        glue_1.4.2
[61] evaluate_0.14       modelr_0.1.8        png_0.1-7
[64] vctrs_0.3.4         httpuv_1.5.4        RgoogleMaps_1.4.5.3
[67] cellranger_1.1.0    gtable_0.3.0        assertthat_0.2.1
[70] xfun_0.16           broom_0.7.0         e1071_1.7-3
[73] later_1.1.0.1       class_7.3-17        viridisLite_0.3.0
[76] units_0.6-7         ellipsis_0.3.1